Pesticide Usage in Scotland: Rodenticides on Arable Farms 2024
This report presents survey results of rodenticide use on arable farms in Scotland in 2024. Almost 46 tonnes of rodenticides were applied on an estimated 39% of all arable farms in 2024. Rodenticide use in 2024 shows a significant downward trend compared to the previous ten years.
Appendix 3: Ten year trends in rodenticide use on arable farms 2014-2024 (1,2,3,4,13)
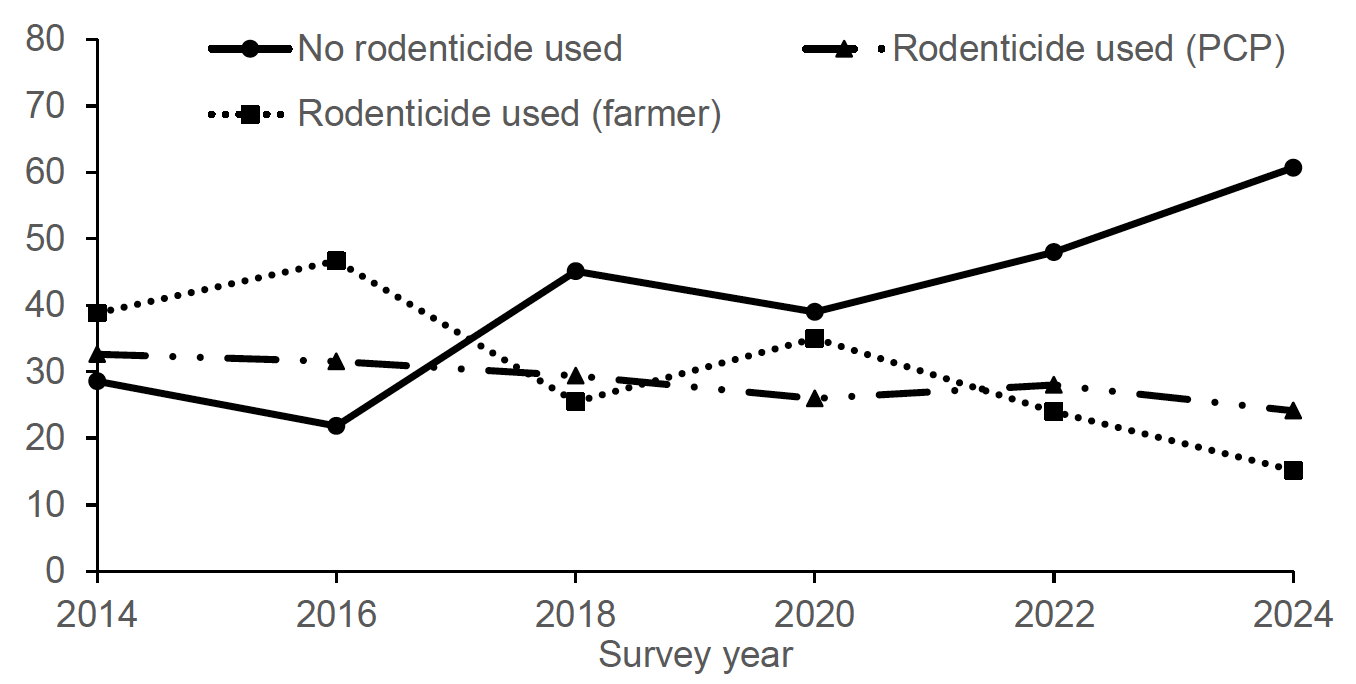
Line chart showing the percentage of farms using no rodenticide, and percentage of holdings where rodenticides were applied by PCPs or farmers between 2014-2024. The proportion of holdings using no rodenticide increased over time and farmers applied rodenticide on fewer holdings over time.
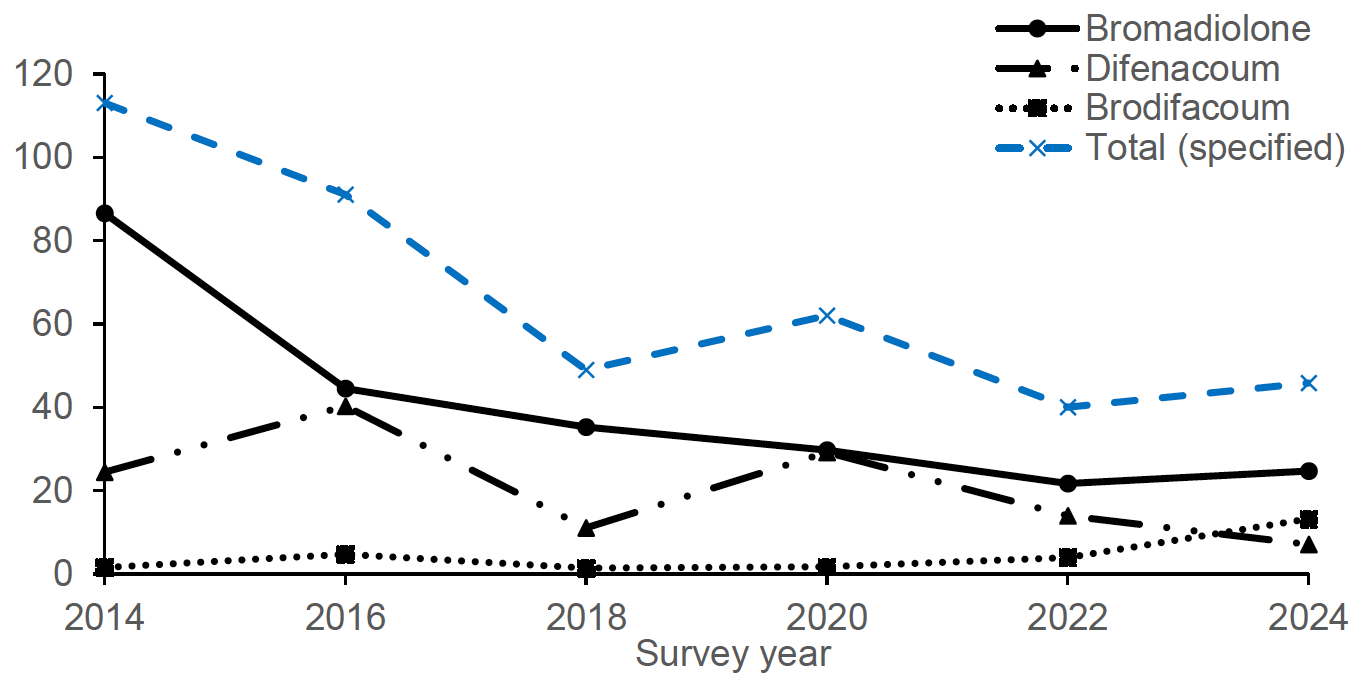
A line chart showing weight (tonnes) of the dominant SGAR products and all specified products used on arable farms in survey years from 2014-2024. There was an overall decrease in weight of product used, but brodifacoum use increased from 2022.
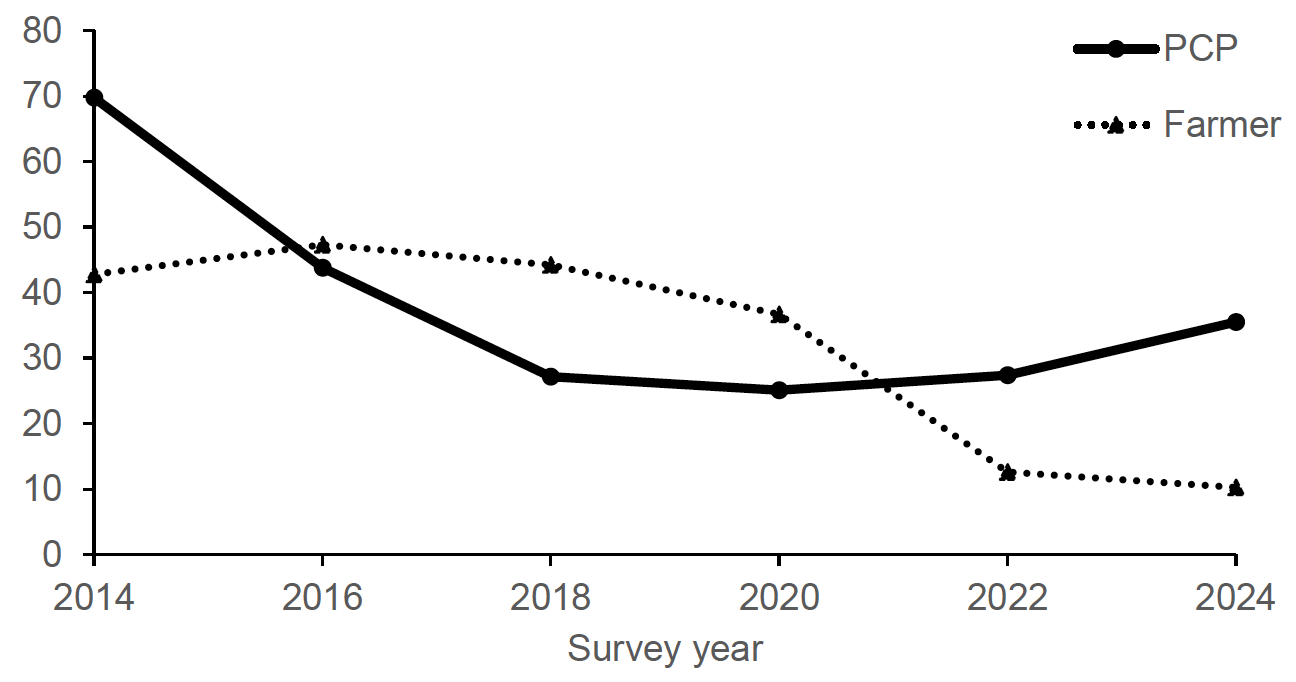
A line chart showing weight (tonnes) of dominant rodenticide products applied by PCPs and farmers on arable farms – 2014 to 2024. Farmers applied more rodenticide in 2016, 2018 and 2020, while PCPs applied more in 2014, 2022 and 2024. There was an overall downward trend in the amount applied.
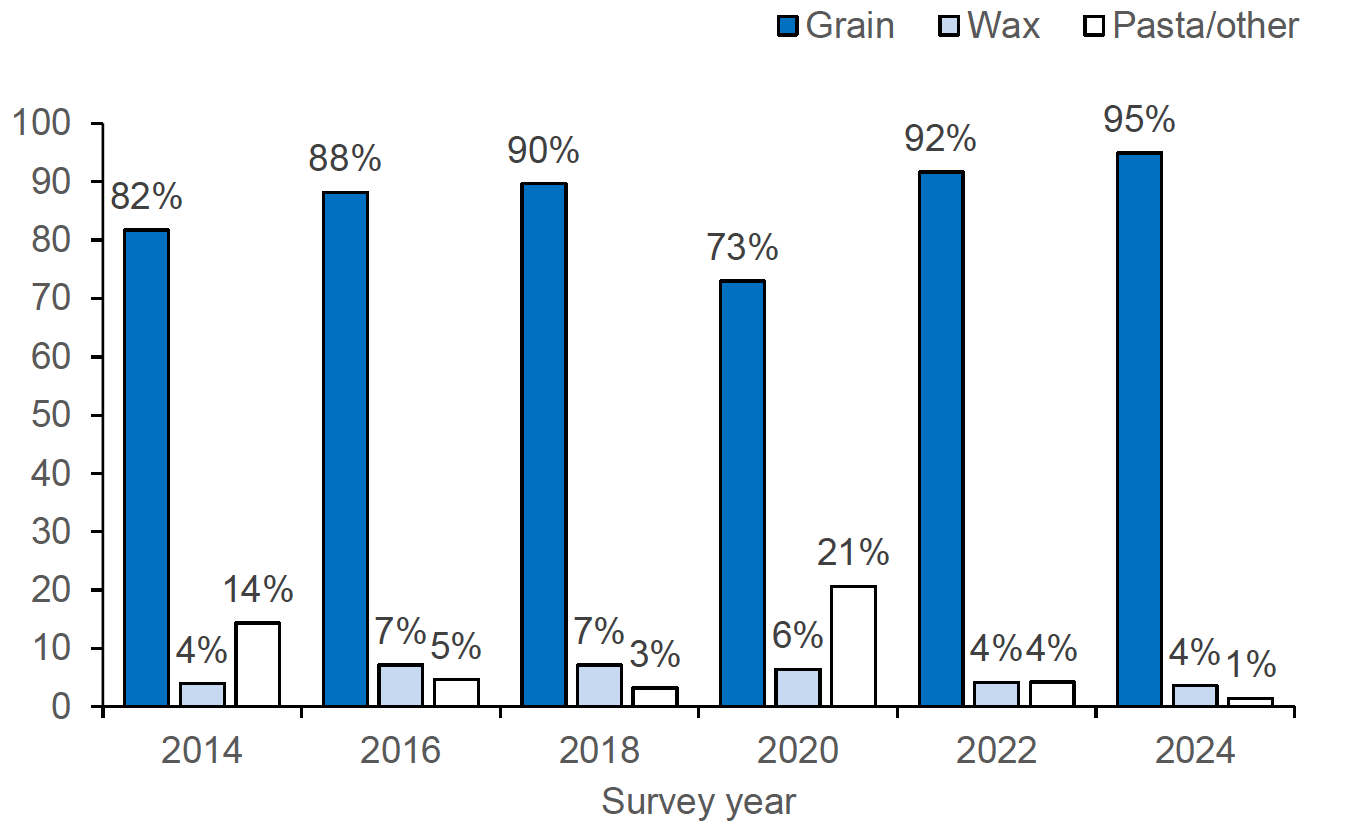
A column chart showing percentage by weight of different bait types containing bromadiolone applied to arable farms between 2014-2024. Grain-based baits dominated in all survey years.
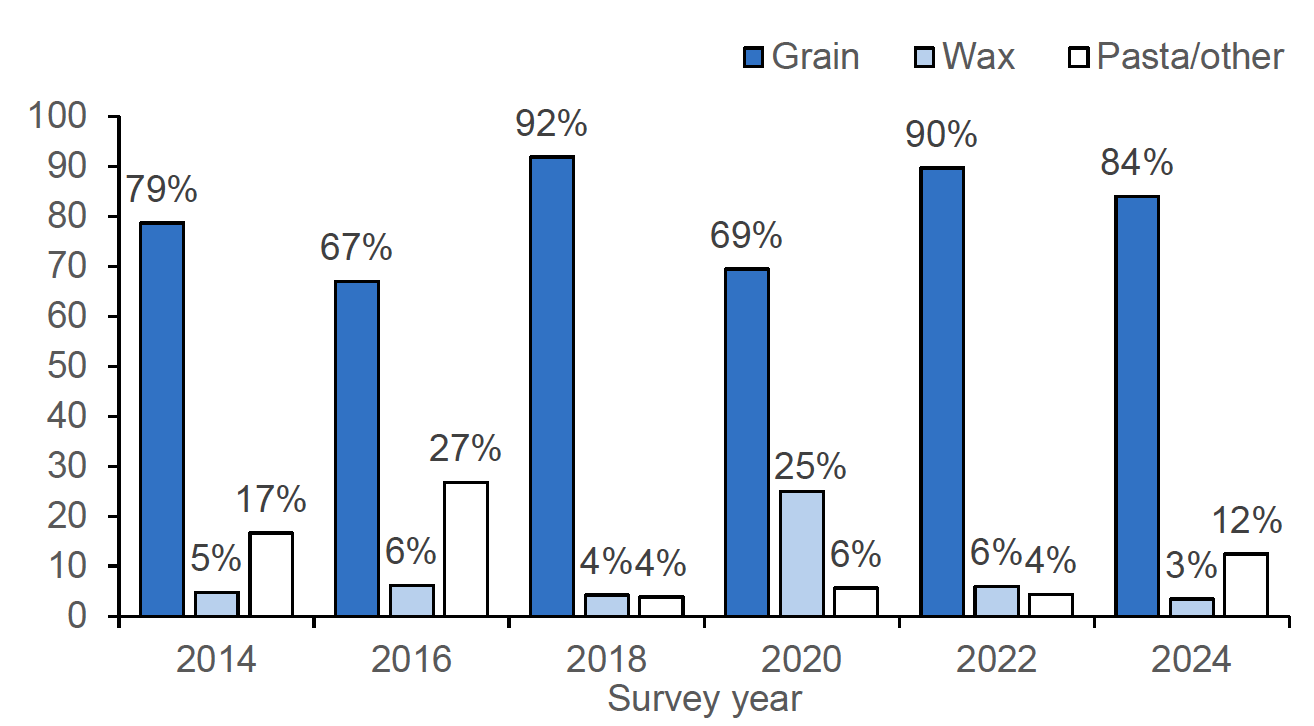
A column chart showing percentage by weight of different bait types containing difenacoum applied to arable farms between 2014-2024. Grain-based baits dominated in all survey years.
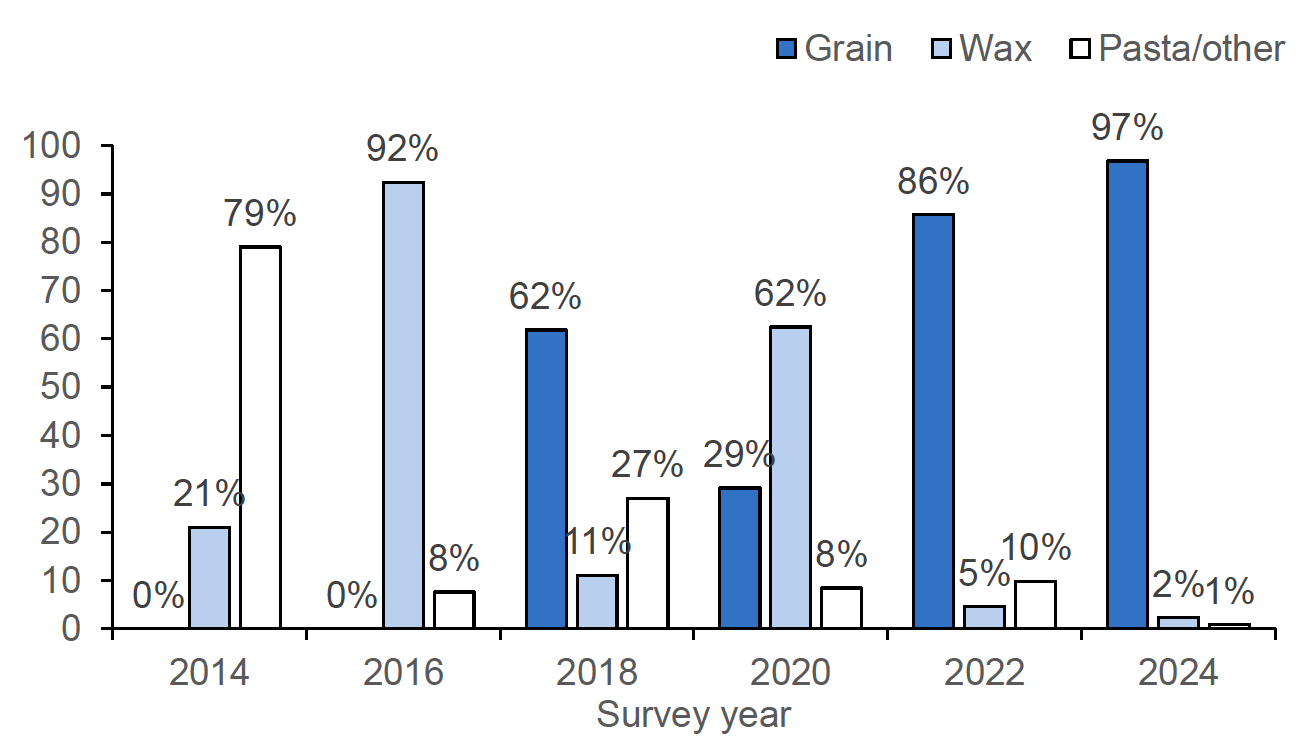
A column chart showing percentage by weight of different bait types containing brodifacoum applied to arable farms between 2014-2024. Pasta dominated in 2014 and wax-based based baits dominated in 2016. Grain-based baits became more dominant from 2018 onwards but a preference for wax blocks was evident again in 2020.
Contact
Email: wildlifeunit@sasa.gov.scot