Pesticide Usage in Scotland: Rodenticides on Arable Farms 2024
This report presents survey results of rodenticide use on arable farms in Scotland in 2024. Almost 46 tonnes of rodenticides were applied on an estimated 39% of all arable farms in 2024. Rodenticide use in 2024 shows a significant downward trend compared to the previous ten years.
Rodenticide Use Data
Rodenticide use data were collected from 272 arable holdings in Scotland in 2024. The farms surveyed represented 3% of the total arable holdings in Scotland. These holdings collectively grew 8% of the 2024 arable crop area. The data collected from this sample were used to estimate rodenticide use on all Scottish arable farms in 2024.
Percentage of farms using rodenticides and type of user
Approximately 61% of Scottish arable farms used no rodenticide (Figure 1). This represents the highest percentage of arable farms not using rodenticide across all survey years. Farmers applied rodenticide on 15% of all holdings and Pest Control Professionals (PCPs) conducted baiting on almost a quarter of all holdings (24%). Farmers were responsible for 22% of the total rodenticide use by weight of product, indicating higher average use by weight per farm by farmers than PCPs.
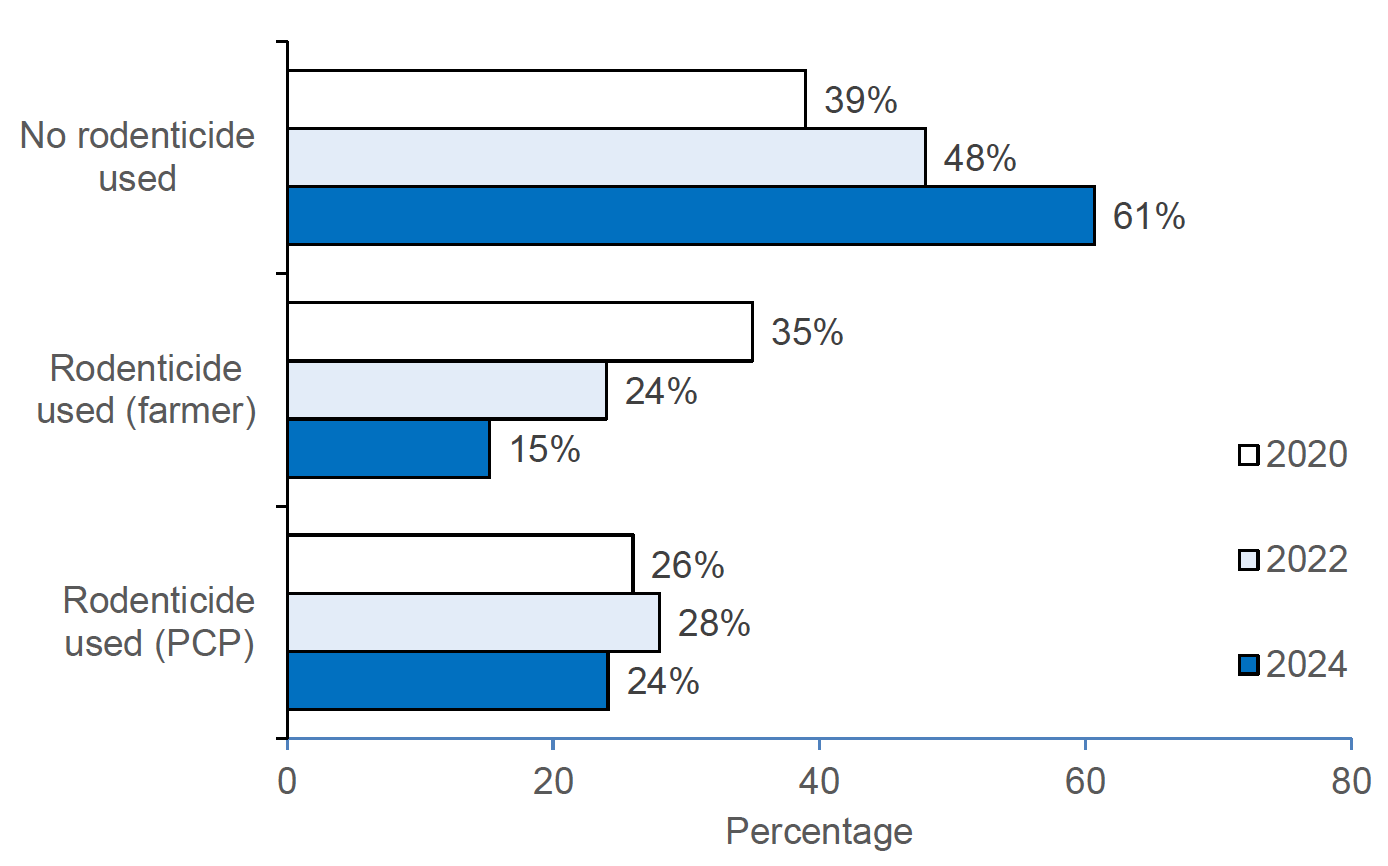
A bar chart showing the estimated percentage of all arable farms using no rodenticide, those where rodenticides were applied by farmers and those where rodenticides were applied by pest control professionals in 2020 to 2024.
Farmers applied rodenticide on 39% of those holdings that used rodenticide (Figure 2). The percentage of arable farms using rodenticides in 2024 was significantly lower (p-value 0.002) than in 2022 (52%) but there was no significant change between 2020, 2022 and 2024 when compared together (p-value 0.447).
In 2024, on holdings where rodenticides were used, the proportion applied by PCPs (61%) was higher than in 2022 (54%) and 2020 (43%) but these differences were not statistically significant between 2022 to 2024 (p-value 0.180) or when compared across 2020, 2022 and 2024 (p-value 0.294). Recent surveys, since the introduction of the Rodenticide Stewardship Scheme (see Rodenticide approval and stewardship section for more details), have shown a trend of an increased deployment of PCPs to conduct baiting on arable farms using rodenticides. The trend in 2020 was an exception, when farmer-conducted baiting rose possibly due to the influence of COVID-19. Although pest management was classed as an essential sector during the pandemic some farmers may have preferred to conduct their own baiting rather than using external contractors.
Long-term data shows that the percentage of farms undertaking rodenticide baiting has declined since the introduction of stewardship; in 2014, pre stewardship, 71% of farms were estimated to have used rodenticide, falling to 39% in 2024 (Appendix 3 Figure 11). Over the same period the percentage of farms where the farmer undertakes rodenticide baiting has fallen from 39% of farms to 15%. While the percentage where PCPs undertake control has also fallen, the change is less pronounced, declining from 33% to 24% over the period. The data suggests that an important component in the long-term decline of rodenticide use on arable farms may be farmers ending their own baiting activities.
A bar chart showing the estimated percentage of arable holdings using rodenticide and the percentage of those holdings for which farmers were responsiblle for rodenticide application in 2020-2024
Rodenticides encountered and their estimated occurrence
During this survey, product information was recorded for 89% of all occurrences of rodenticide use, compared to 95% in 2022 and 78% in 2020.
Rodenticide occurrence is defined as the number of holdings on which a formulation (the combination of active substances formulated together in a product) is encountered. Multiple uses of the same formulation at the same holding are counted as a single occurrence (refer to Appendix 4 for further explanation of these definitions).
Seven active substances were recorded on arable farms in 2024; alphachloralose, brodifacoum, bromadiolone, cholecalciferol, difenacoum, difethialone and flocoumafen, this includes products which contained a combination of both bromadiolone and difenacoum (Figure 3, Table 1). Two of the active substances reported, alphachloralose and cholecalciferol, are non-anticoagulant rodenticides, with alphachloralose being approved for use indoors against mouse infestations only. The remaining five rodenticides encountered were anticoagulants, which prevent the synthesis of blood clotting factors and cause rodent death by haemorrhage.
All five anticoagulants were second generation anticoagulant rodenticides (SGARs). No first-generation anticoagulant rodenticides (FGARs) were reported for 2024; this is only the second time in this survey series that no FGAR use has been found (the first being in 2014) (3), most likely reflecting the diminished number of products available (during the time period covered by this survey only a single FGAR product had approval).
SGARs collectively accounted for 97% of all occurrences of specified rodenticide use in 2024. This is similar to 2022 (96%), and slightly lower than recorded in 2020 where rodenticide use was almost exclusively composed of SGARs (>99%). The difference between the proportion of SGARs used in 2022 and 2024 was not significant (p-value 0.634), but there was evidence of a significant downward trend when 2020, 2022 and 2024 were considered (p-value 0.018). The most commonly encountered formulations contained bromadiolone and difenacoum (54% and 29% of occurrences respectively). Other formulations recorded contained brodifacoum (12% of occurrences), cholecalciferol (2%), flocoumafen, difethialone, alphachloralose and bromadiolone/difenacoum (all 1% or less).
In past surveys, bromadiolone and difenacoum were the most commonly available rodenticides in terms of products available (4, 5). However, as noted in the 2022 report (2), this situation has changed; the number of products containing brodifacoum has increased post-stewardship and they now exceed bromadiolone products. In mid-2024, bromadiolone, difenacoum and brodifacoum containing products accounted for 20%, 37% and 32% respectively of all authorised rodenticide products (6). Bromadiolone and difenacoum accounted for all but one product authorised for use in open areas during 2024 (the other being cholecalciferol) (6). However, at the end of 2024 this changed with open area approval being withdrawn for the two SGAR compounds leaving only a cholecalciferol bait available for open area use (7).
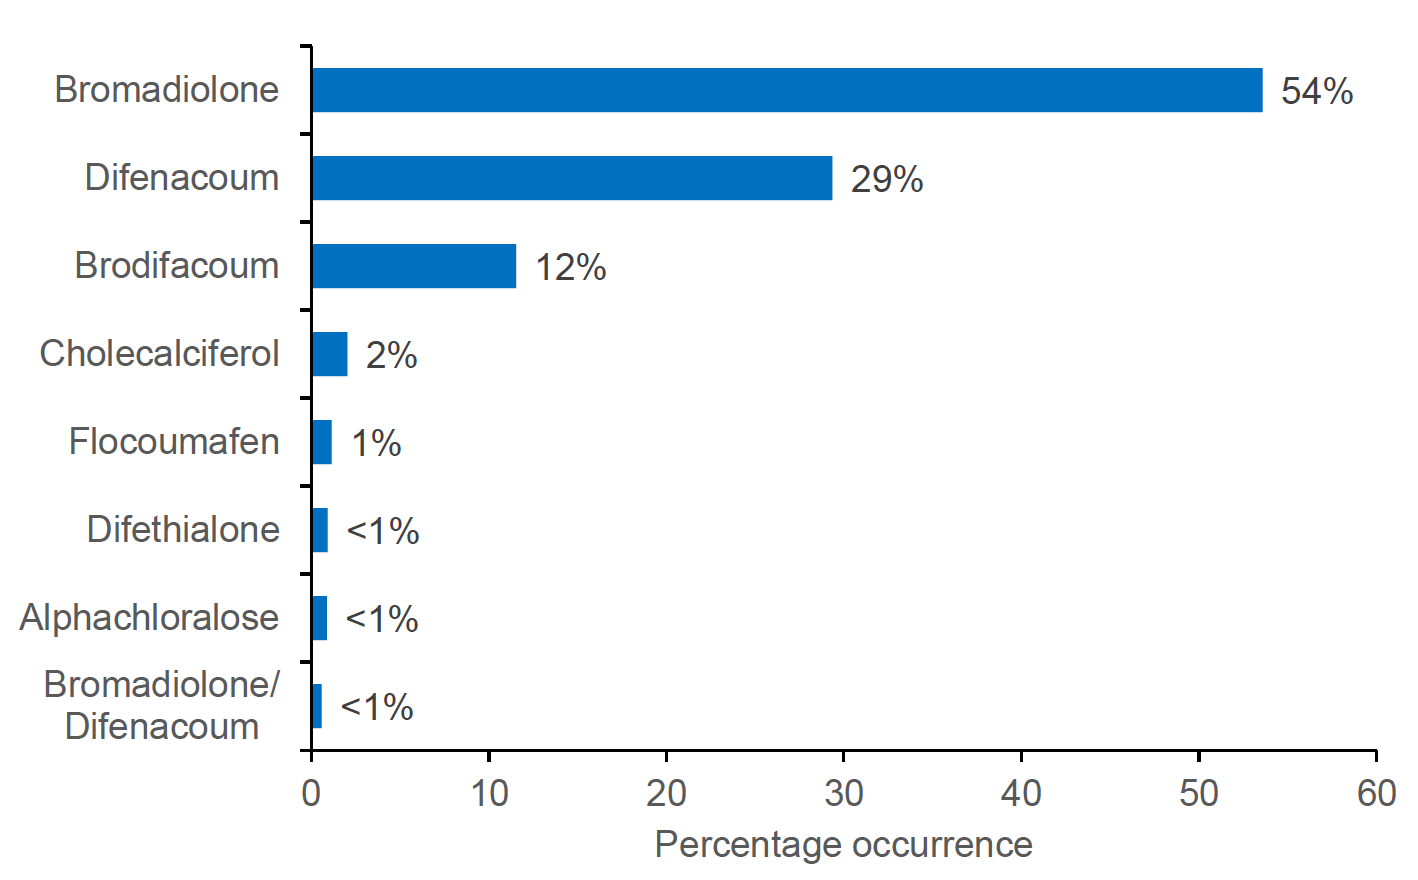
A bar chart showing the estimated percentage occurrence of each rodenticide active substance on arable farms in 2024. Bromadiolone was the most prevalent active substance by occurrence, accounting for over half of the total number of farms using rodenticide.
The combined use of bromadiolone and difenacoum increased to 83% in 2024, slightly up on the 79% found in 2022 but still below the 92% of rodenticide occurrences in 2020. This change might partly be due to a decrease in the occurrence of brodifacoum use (from 16% of farms in 2022 to 12% in 2024) and coumatetralyl (from 3% in 2022 to not being reported at all in 2024). The combined use of bromadiolone, difenacoum and brodifacoum accounted for 94% of rodenticide occurrences in 2024, the same as in 2022. In 2024, the number of farms using bromadiolone increased significantly compared to 2022 (p-value 0.004) and there was evidence of an overall increase across the years 2020, 2022 and 2024 (p-value 0.012). There was weak evidence of a decrease in difenacoum use between 2022 and 2024 (p-value 0.048) and stronger evidence of a downward trend considering 2020, 2022 and 2024 together (p-value 0.003).
Although occurrence of brodifacoum fell between 2022 and 2024, this change was not significant (p-value 0.198) but there was evidence of an increase across the last three surveys (p-value 0.005) (Figure 4). The mixed formulation bromadiolone/difenacoum was found at very low levels of use, accounting for less than 1% of all specified occurrences in 2024. The relative proportions of these three main compounds vary between years. There are a number of factors that could have an influence but it is not clear what the drivers for these variations are. For example, product efficacy can be impacted by resistance to both difenacoum and bromadiolone, which has been reported in Scotland (8). It may also represent a response to differences in the range of approved products available for each active substance and their marketing strategies over time.
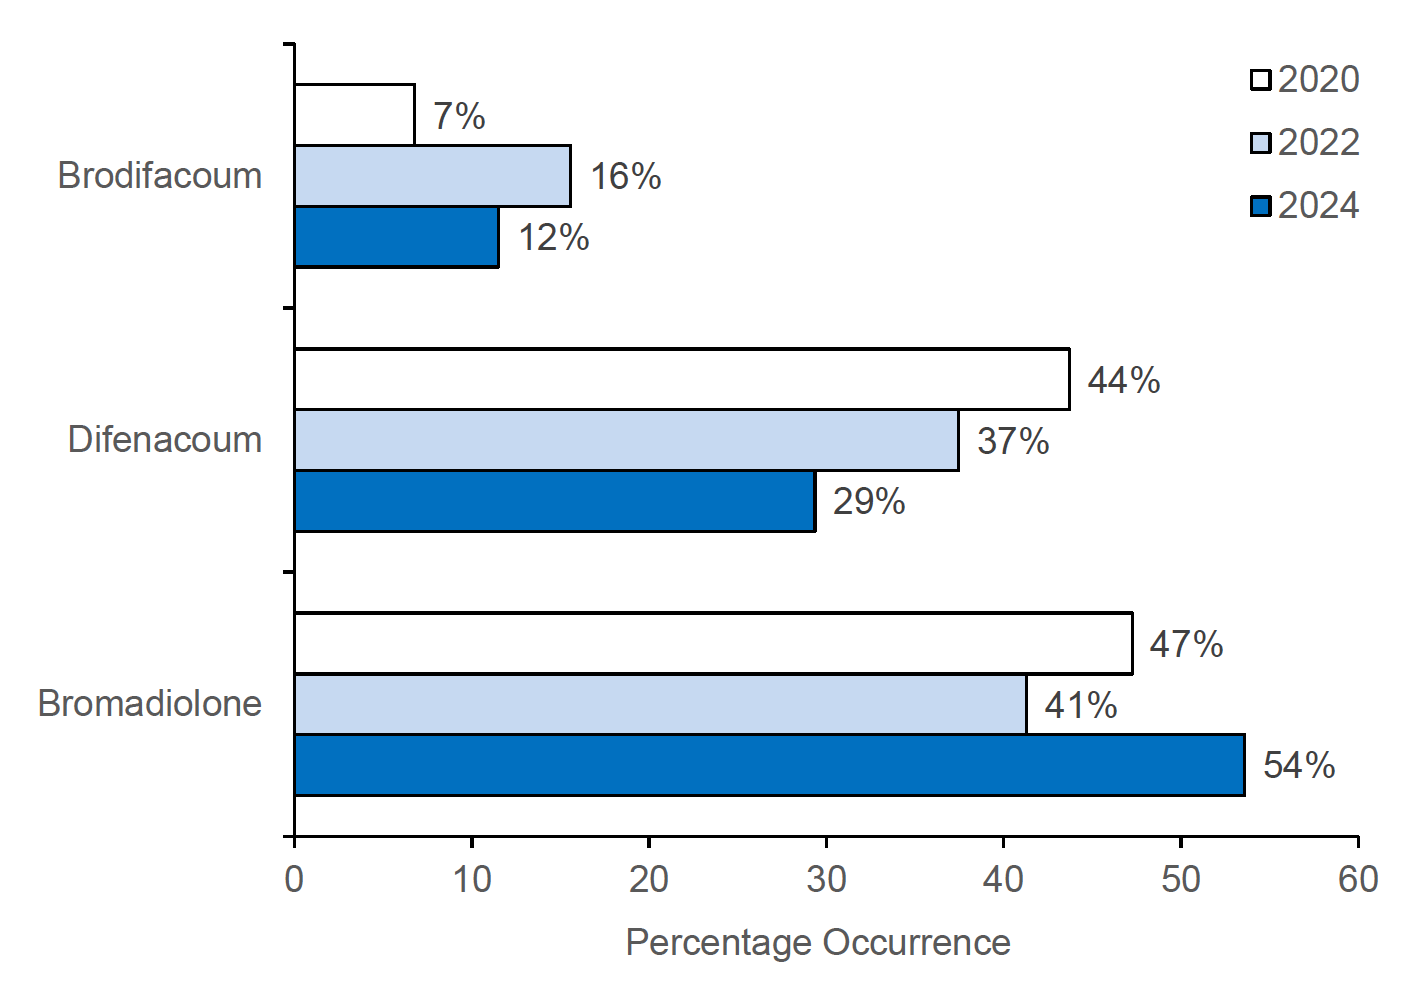
A bar chart comparing percentage occurrence of bait products with the three most frequently used active substances between 2020-2024.
Weight of rodenticides used
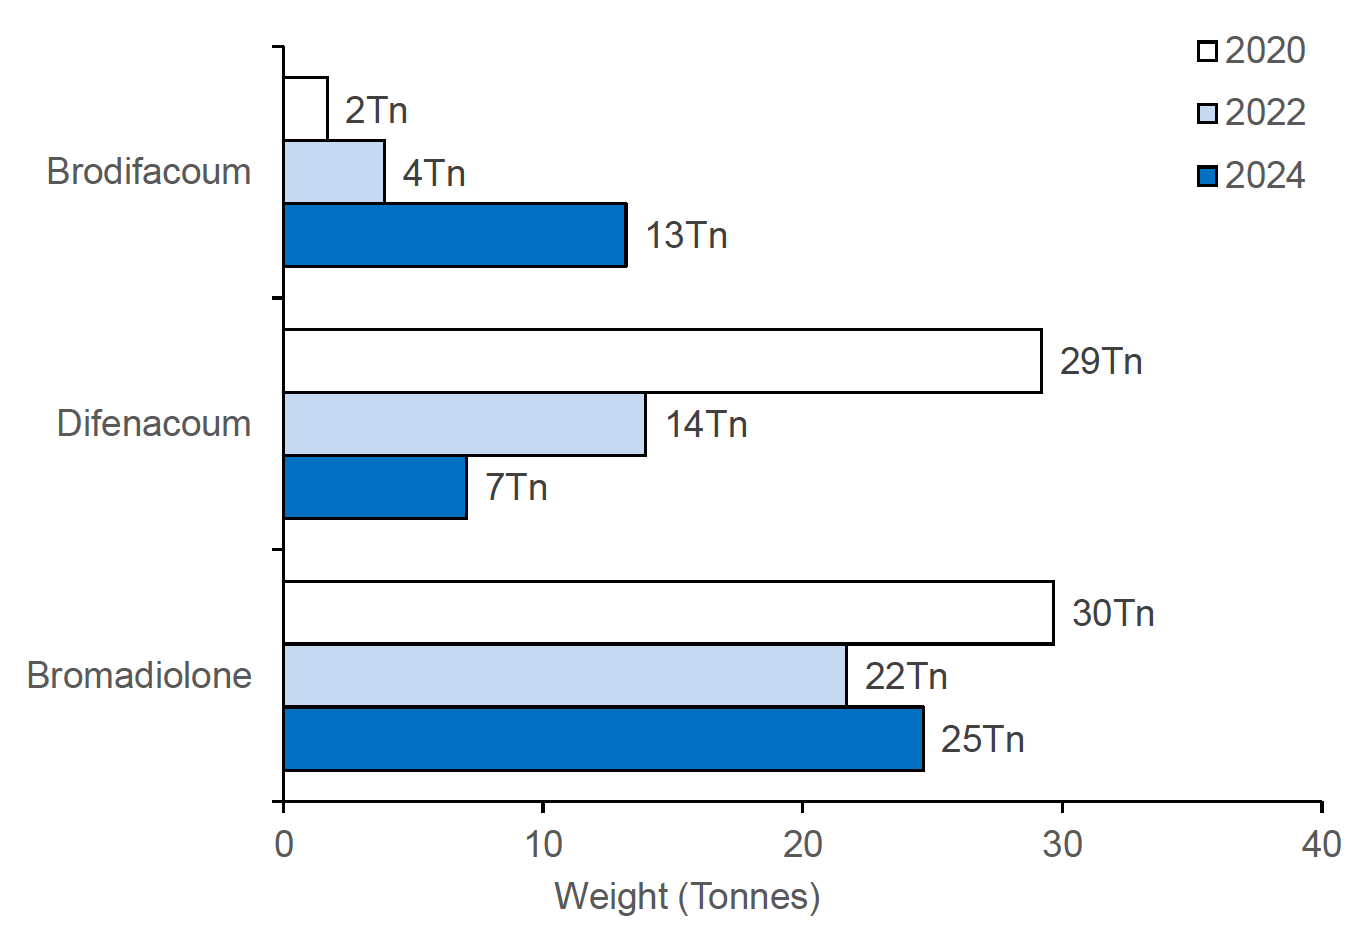
Almost 46 tonnes of rodenticidal products are estimated to have been used on Scottish arable farms in 2024, compared to around 40 tonnes in 2022. More than 99% of the total weight used was SGAR products (Figure 5, Table 2), Products containing bromadiolone were the most frequently used (ca.25 tonnes), accounting for 54% of total rodenticide use by weight. This was followed by products containing brodifacoum (ca. 13 tonnes), use of which more than tripled compared to 2022 (ca. 4 tonnes). Brodifacoum accounted for almost 29% of rodenticide product used by weight in 2024 compared to almost 10% in 2022. Use of difenacoum products (ca. 7 tonnes and 15% of total rodenticide by weight)) more than halved compared to 2022 (14 tonnes and 35%). The use of alphachloralose, bromadiolone/difenacoum, difethialone and flocoumafen combined accounted for less than 1 tonne of product. The large increase in the weight of brodifacoum product used in 2024 contrasts with the number of farms it was used on, which was broadly similar to 2022. This suggests that the increase was driven by individual users utilising greater amounts of brodifacoum, rather than by more people using it.
Formulation weights (the weight of active substances present in the product not including baits) are also presented in Table 2. Anticoagulant rodenticide products contain very small amounts of active substance, ranging from 0.0025% to 0.005% weight/weight (w/w). The ca. 46 tonnes of rodenticide product used on arable farms in 2024 contained only ca. 2.9 kg of active substance, the remainder of the product weight is almost exclusively food bait used to attract rodents. This figure is similar to the estimated weight of active substance reported in 2022 (2.8 kg), despite an approximate 15% increase in estimated the weight of rodenticide product used. This is likely to have been influenced by the occurrence of both alphachloralose and cholecalciferol products in the survey sample. These both have concentrations of active that are much greater than those of the anticoagulants and therefore even a small amount of additional use can strongly influence the overall weight of active substance. Anticoagulant products contain between 0.0025% and 0.005% w/w of active substance. By comparison alphachloralose products contain 4% active substance w/w, (between 80 to 160 times the weight of active substance in anticoagulant products) and cholecalciferol has an active substance concentration of 0.75%, (between 15 and 30 times the weight of active substance in anticoagulant products). Despite accounting for an estimated 0.5% of product use by weight these two non-ARs comprised almost 21% of use by weight of active substance.
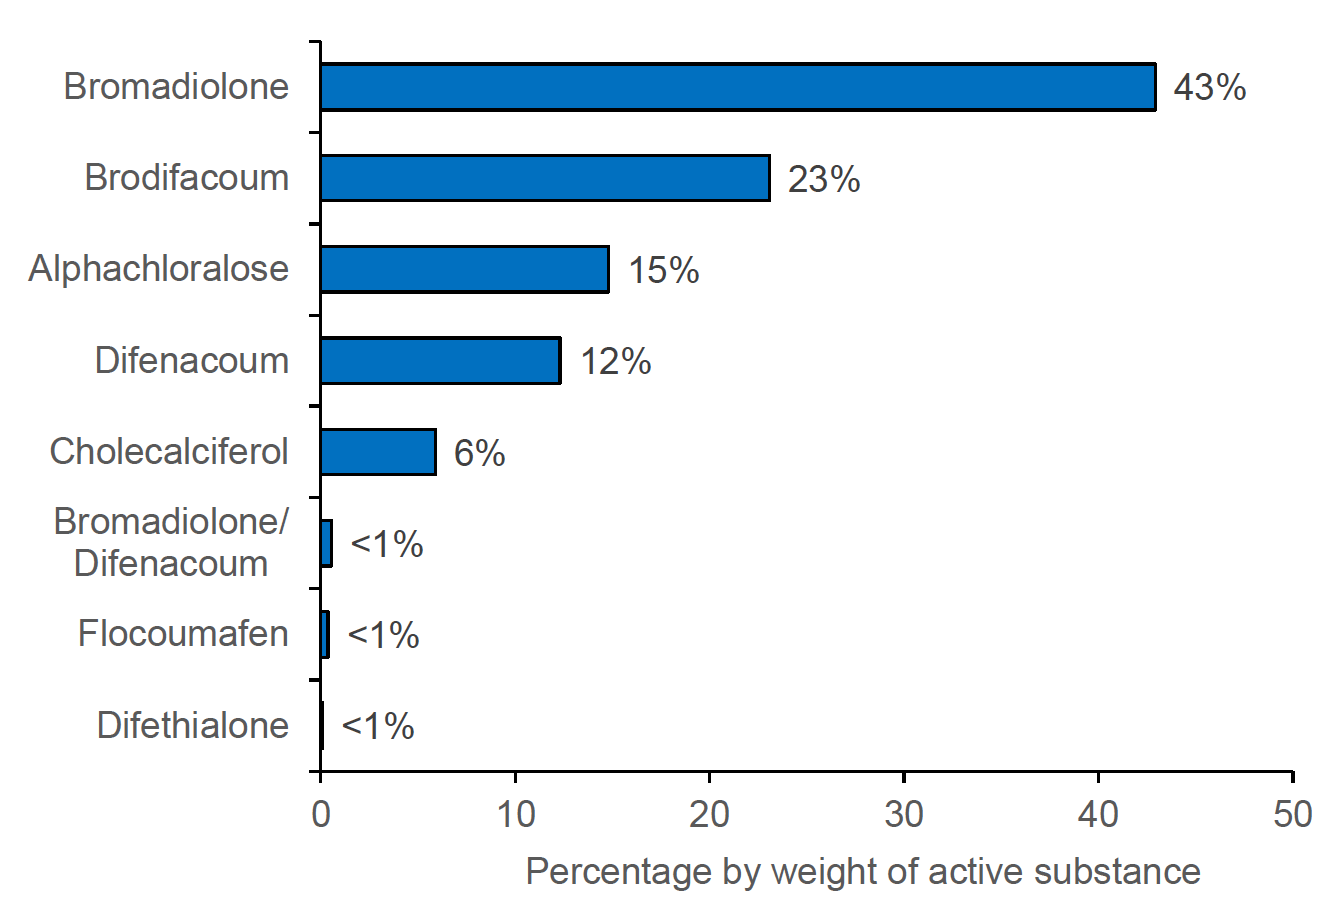
A bar chart showing the percentage by weight of each rodenticide active substance used on arable farms in 2024. Bromadiolone is the most prevalent active substance by weight.
The estimated weights of the three main rodenticides recorded in the 2020, 2022 and 2024 arable crop surveys are presented in Figure 6. Overall rodenticide use in 2024 (ca. 46 tonnes) was around 15% greater than in 2022 (ca. 40 tonnes), but still well below the estimated use in 2020 (ca. 62 tonnes). However, the 2020 figure was itself an increase in use, possibly influenced by a change in baiting patterns due to the Covid 19 pandemic. Rodenticide use on arable farms was in decline before the introduction of stewardship and has continued to decline. Since the introduction of stewardship the estimated total weight of rodenticide products used has fallen. Looking only at the three main products (bromadiolone, brodifacoum and difenacoum) in 2014 112 tonnes of these products were estimated to have been used (3), falling to 45 tonnes in 2024, a 60% decline. This has been driven mainly by a decrease in bromadiolone use (declining 72% across the same period). Difenacoum use has declined by a similar percentage (71%) over the same period but was proportionally much less to begin with and has also shown much greater fluctuation between surveys. The increase in rodenticide use that was detected during 2020 and possibly related to the Covid-19 lockdowns appears to have been mainly due to an increase in difenacoum use that year (Appendix 3, Figure 12)
At active substance level, there was a 49% decrease in the use of difenacoum in 2022 compared with 2020. Following on from a 53% decrease between 2022 and 2018. Bromadiolone use by weight of active substance increased slightly, by 14% in 2024 compared with 2022 but was still 17% lower than 2020. In contrast, the use of brodifacoum in 2024 was more than three times that recorded in 2022, this follows on from a 165% increase between 2020 and 2022. Over the last three surveys there has been a clear downward trend in difenacoum use, and a clear upward trend in brodifacoum use. The trend for bromadiolone is less clear when only looking at the most recent surveys. It should be noted that rodent populations, and thus rodenticide use, fluctuate over time so even within a long-term trend there may be variation year to year. Long term data for weight of active substance appears to show greater variation year to year variation than data for weight of product, while still following a similar trend, a likely factor in this is variation in active substance concentration between different bait formulations/ Many professional SGAR products have an active concentration of 0.005% but all amateur, and some professional products have a concentrations between 0.0025% and 0.0029%; variations in the proportional use of these products from year to year could explain the difference between the weights of product and active substance used.
The longer term declines in rodenticide use (Appendix 3, Figure 12) and increased proportional use of PCPs on farms using rodenticides (Appendix 3, Figure 13), which were detected in both arable and grass and fodder crop systems, are likely to have been influenced by the Campaign for Responsible Rodenticide Usage (CRRU) guidance for best practice (9) and the 2015 launch of the UK industry led rodenticide stewardship scheme (10). The CRRU Code of Best Practice was revised and published in 2021 and again in 2024 following a number of changes relating to the regulation and permitted practical uses of professional rodenticides (9). At the beginning of 2025, further changes regarding the use of baits in open areas came into effect (7) (see rodenticide approval and stewardship section for further details). Further changes in training requirements for professional users will come into force in 2026. These changes could (and are intended to) influence future rodenticide use.
A bar chart comparing weight (tonnes) of the most frequently used bait products between 2020-2024.
Seasonal use of rodenticides
The season in which rodenticides were used was specified for all of the rodenticides encountered in this survey. An estimated 78% of use was reported to occur throughout the year. This included farms practicing permanent baiting and those conducting multiple separate baiting operations. This is higher than all year round use reported in 2022 and 2020 (46% and 45% respectively).
When the weight of product used, including year-round use, is separated into constituent seasons, the greatest use was in winter (34%) and autumn (25%), with lower use in spring (21%) and lowest use in summer (20%) (Figure 7). Summer use was slightly down compared to 2022 (25%) but it has been recorded as lower in previous surveys (ranging from 13% to 18% from 2014 to 2020). Note that for this report the weight of product has been used to compare seasons rather than weight of active substance used in previous reports; this change has been made to avoid the use of non-anticoagulants with much higher active substance concentrations from disproportionately influencing the seasonal totals.
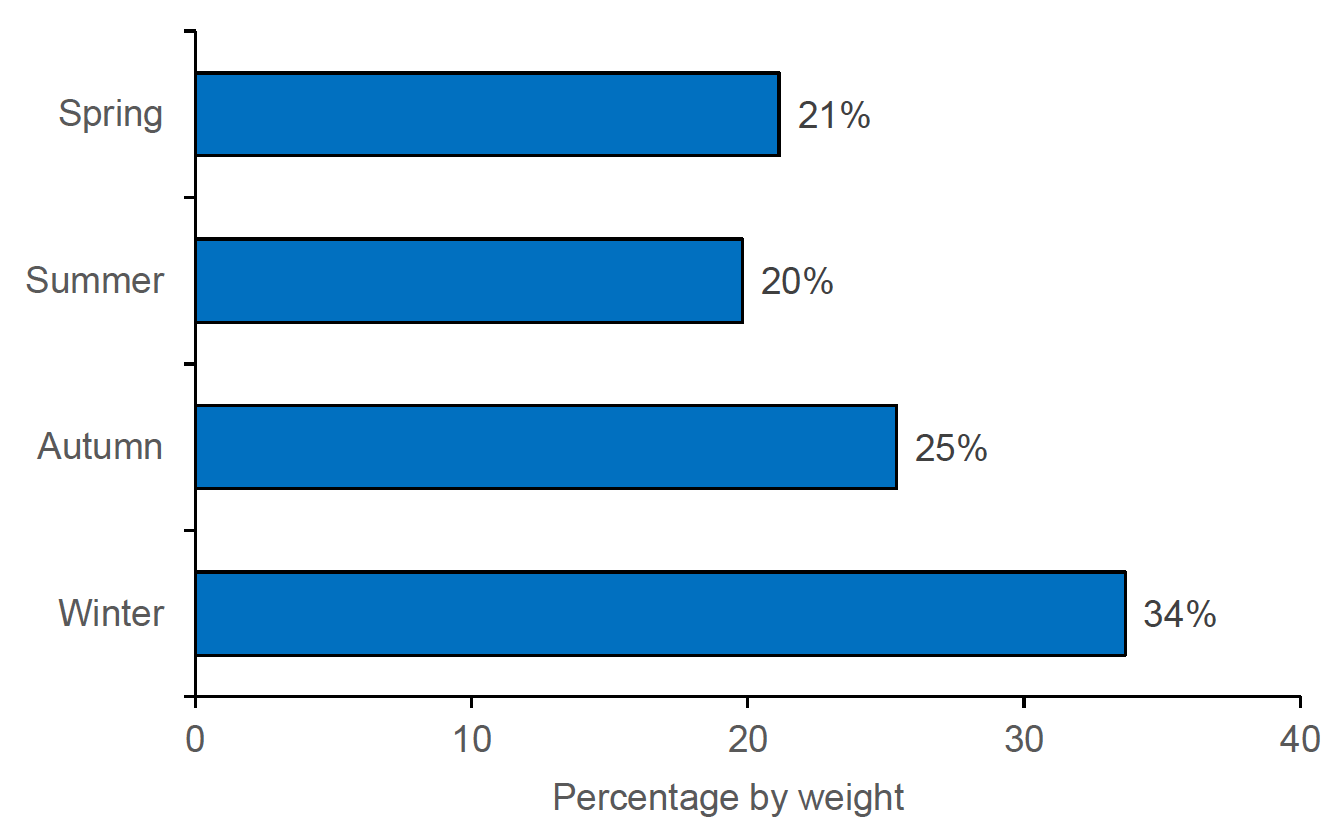
A bar chart showing percentage by weight of anticoagulant rodenticide product applied on arable farms in 2024 by season. Just over one third (34%) of rodenticides were applied in winter.
Rodenticide bait type and target
Baits formulated with grain were the most commonly encountered in this survey, accounting for 92% of use by weight (Figure 8), this is very similar to the 2022 survey (93%) and higher than in the 2020 survey (82%). These baits were primarily loose grain and place packs containing grain but also included a small amount of grain-based paste (<1% of total grain baits).
The other types of rodenticide products encountered included wax-based baits, which accounted for 4% of use. Wax baits comprised 89% solid wax and 11% were soft waxes. Pasta based bait contributed just over 1% of total use, and other paste baits (for which the type of bait was not specified) were estimated to account for just over 2%. No gel or foam rodenticides were encountered in 2024.
Since the introduction of stewardship, data on products containing the three most used active substances (bromadiolone, difenacoum and brodifacoum) shows that grain-based bait has always been the dominant type used on arable farms for both bromadiolone and difenacoum. The percentage (by product weight) of bromadiolone products used from 2014 to 2024 that were grain-based varied between 73% and 95% of the total weight of product used, with a mean of 87% across six surveys (Appendix 3 Figure 14). The figures for difenacoum were similar, varying from 67% to 92% with a mean of 80% (Appendix 3 Figure 15). However, for brodifacoum baits the pattern is very different, with grain-based bait varying from 0% in both 2014, just prior to stewardship, and 2016, at the beginning of stewardship, to 97% in 2024 (Appendix 3 Figure 16). The much greater variation might be partially explained by the very low levels of brodifacoum use in the earlier years when bait choices on individual farms may have had greater influence on totals, but it may also be reflective of a change in the range of brodifacoum products available. As previously discussed, there has been an increase in the number of brodifacoum products available in the years since stewardship was introduced and that includes grain-based baits. Farmers and PCPs may preferentially use grain-based baits on arable farms as it is more reflective of the type of food many rodents may be exploiting (spilled and stored grains). Therefore, the increased availability of this format for brodifacoum baits in recent years may explain why it has now become the dominant format of brodifacoum bait in these surveys.
Survey respondents were asked to state the target of their rodenticide baiting regimes (Figure 9) and this information was supplied for all estimated use by product weight. The most common target was stated as a combination of rats and mice (66%), followed by rats (33%) then mice (1%). Note that for this report the weight of product has been used to compare target rather than weight of active substance used in previous reports; this change has been made to avoid the use of non-anticoagulants with much higher active substance concentrations from disproportionately influencing the totals. This could particularly affect the data for mice as alphachloralose can only be used for mice and has between 90 and 180 times the concentration of active substance compared to anticoagulant baits.
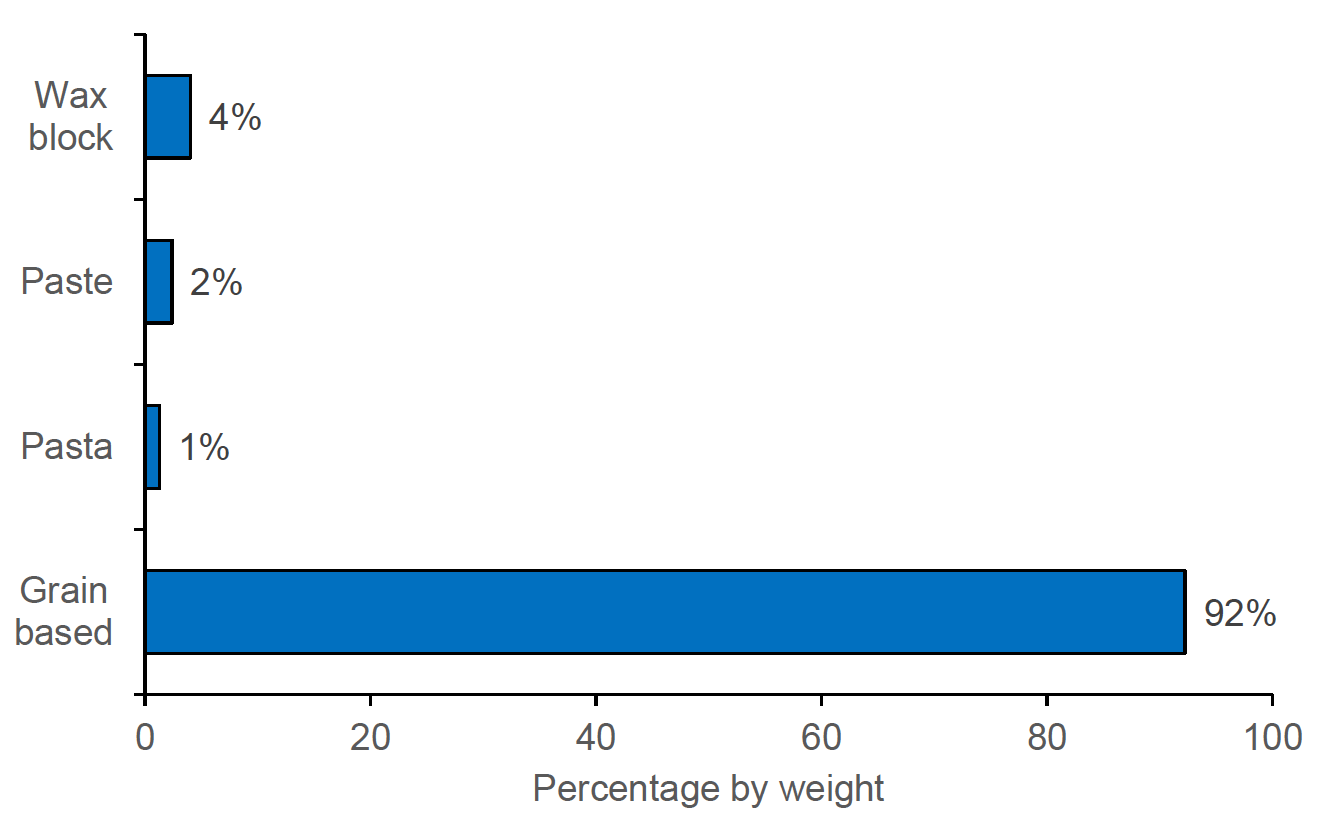
A bar chart showing the percentage by weight of different bait types applied on arable farms in 2024. Grain-based baits dominated, accounting for 92% of baits applied. Totals may not add up to 100% due to rounding.
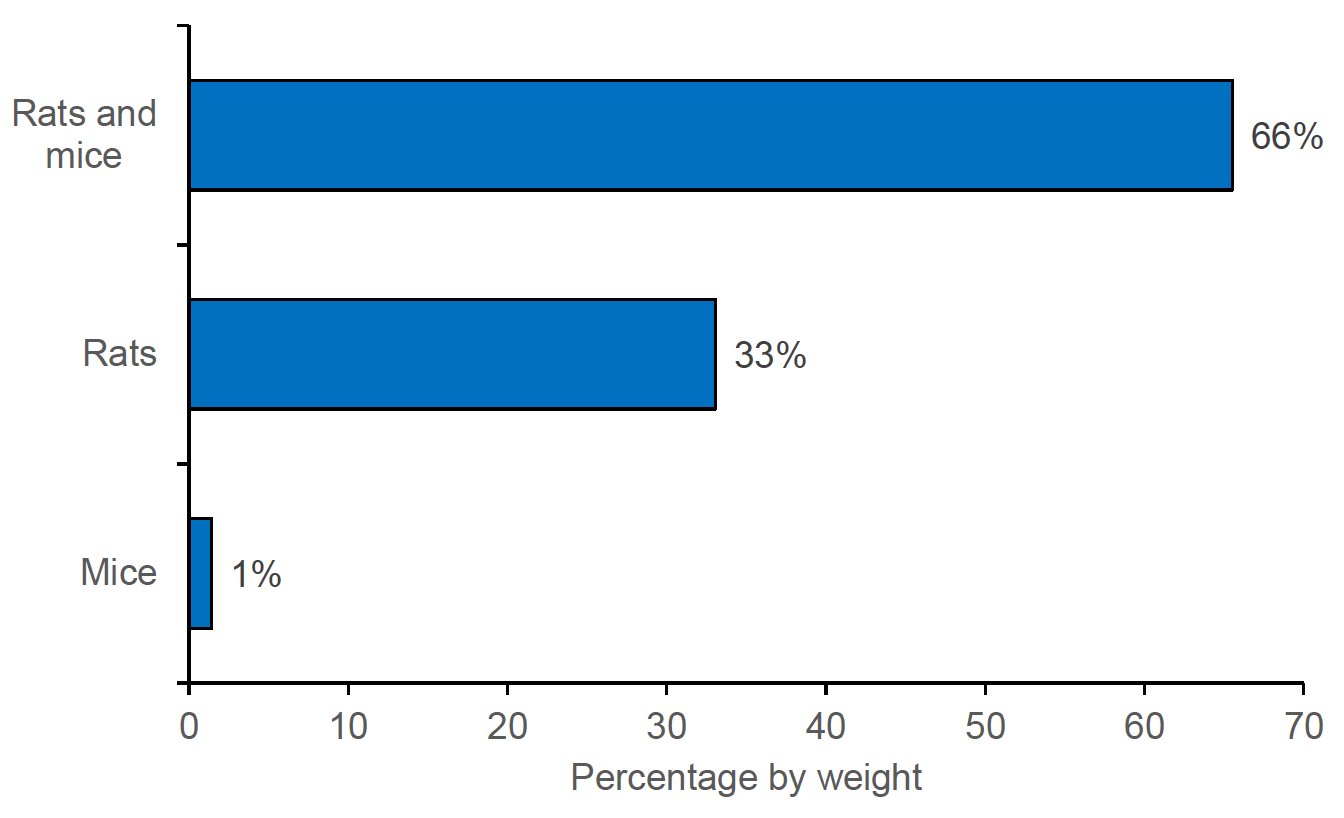
A bar chart showing the percentage by weight of rodenticide products applied to treat mice, rats or a combination of rats and mice on arable farms in 2024. A combination of rats and mice was the most common reason for treatment, accounting for two thirds of cases.
Contact
Email: wildlifeunit@sasa.gov.scot