
Pesticide usage in Scotland: Outdoor Vegetable Crops 2025
This publication presents information from a survey of pesticide use on Outdoor Vegetable crops in Scotland in 2025.
Estimated pesticide usage
Vining peas
- 10,420 hectares were grown in Scotland in 2025. This represents a 13% increase from 2023
- All of the crop was treated with a pesticide
- Pesticide formulations were applied to 45,135 treated hectares with 20,368 kilograms of pesticides applied in total
- Vining pea crops received on average 2.6 pesticide applications (supporting document Table 1). These applications included 1.5 herbicide, 1.3 insecticide and 1.0 fungicide applications (applied to 100%, 75% and 84% of the crop area respectively)
- The majority of fungicides and insecticides were applied in July. Herbicides were predominantly applied in May and June (Figure 10)
- Reasons for herbicide application were specified for 20% of total use; 11% for general weed control and 9% for annual broad-leaved weeds. No reasons were provided for fungicide and insecticide use
- The most common varieties encountered were Corus and Romance accounting for 29 and 23% of the sampled area respectively
| Pesticide group | Formulation area treated (ha) | Weight of pesticides applied (kg) | Percentage of crop treated (%) | Top three most used formulations (ha) |
|---|---|---|---|---|
| Herbicides | 16,732 | 14,502 | 100 | Imazamox/pendimethalin (10,420), Bentazone (3,341), Glyphosate (2,488) |
| Insecticides | 10,406 | 1,251 | 75 | Pirimicarb (7,794), Flonicamid (2,613) |
| Fungicides | 8,871 | 2,594 | 84 | Boscalid/pyraclostrobin (5,361), Azoxystrobin (3,510) |
| Seed treatments | 8,225 | 163 | 79 | Fludioxonil (8,225) |
| Sulphur | 901 | 1,858 | 9 | [z] |
| All pesticides | 45,135 | 20,368 | 100 | Imazamox/pendimethalin (10,420), Fludioxonil (8,225), Pirimicarb (7,794) |
Some shorthand is used in this table: [z] = not applicable. For details of all pesticide use on vining peas, please refer to the supporting document.
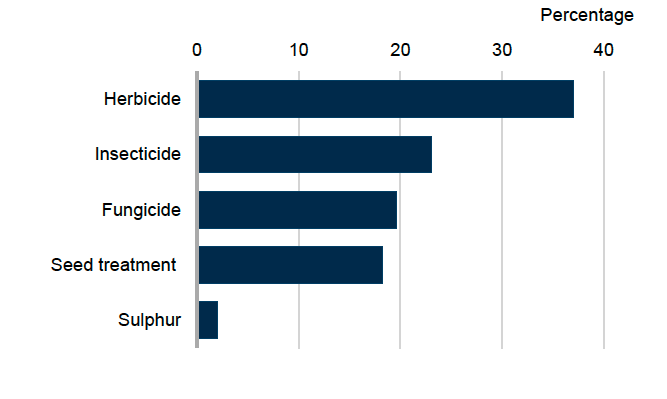
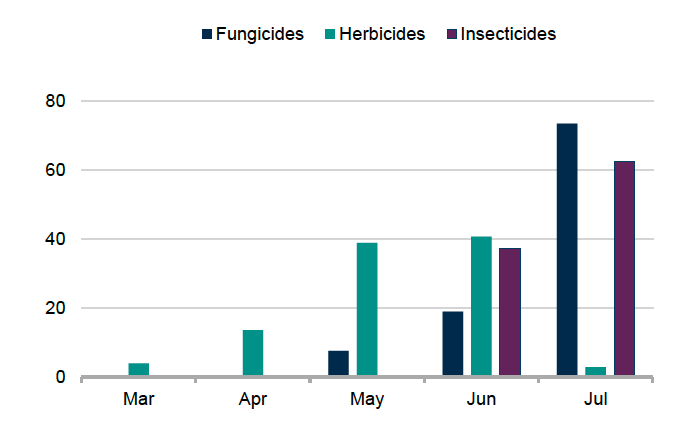
Figure 10 footnote: All sulphur was applied in July.
Carrots
- An estimated area of 3,531 hectares were grown in Scotland in 2025. This represents a 6% increase since 2023. This includes 16 hectares recorded under the ‘other vegetable’ category in the census
- 84% of the crop was treated with a pesticide
- Pesticide formulations were applied to 63,957 treated hectares with 18,993 kilograms of pesticide applied in total
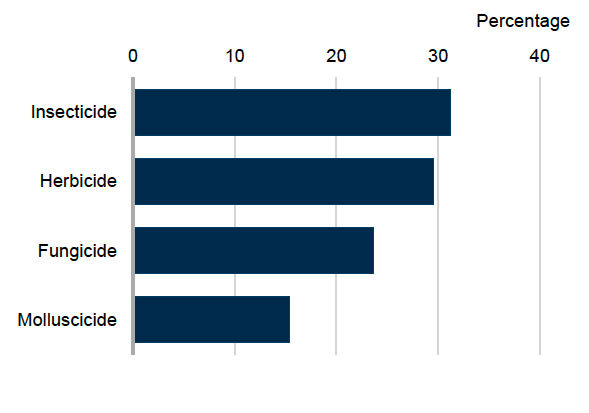
- The carrot crop received on average 11.2 pesticide applications (supporting document Table 1). These applications included 7.2 fungicide, 5.2 insecticide and 3.8 herbicide applications (each applied to 84% of the crop area)
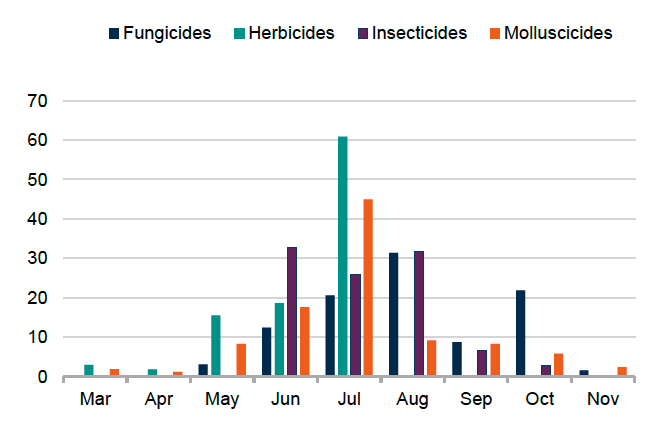
- The majority of herbicide applications were in April and May, and the majority of fungicides and insecticides were applied in July and August, and the majority of molluscicides in October (Figure 12)
- Reasons for fungicide applications were specified for 39% of total use; sclerotinia (15%), crown rot (10%), alternaria (6%), disease control (4%) and botrytis and cavity spot (both 2%)
- Reasons were supplied for 37% of total herbicide use; general weed control (16%), annual broad-leaved weeds (14%), grass weeds control (4%) and annual grass weeds (3%)
- Reasons were specified for 36% of total insecticide/nematicide use; carrot fly (20%), aphids (15%) and nematodes (1%). No reasons were provided for the use of biopesticides
- The most common variety encountered was Nairobi which accounted for 83% of the sample area surveyed
| Pesticide group | Formulation area treated (ha) | Weight of pesticides applied (kg) | Percentage of crop treated (%) | Top three most used formulations (ha) |
|---|---|---|---|---|
| Fungicides | 26,479 | 6,794 | 84 | Prothioconazole (4,647), Cyprodinil/fludioxonil (3,910), Boscalid/pyraclostrobin (3,564) |
| Herbicides | 18,788 | 8,950 | 84 | Metribuzin (5,062), Aclonifen (3,581), Pendimethalin (3,233) |
| Insecticides/ nematicides | 16,061 | 2,765 | 84 | Lambda-cyhalothrin (9,812), Flonicamid (1,637), Deltamethrin (1,220) |
| Seed treatments | 2,369 | 2 | 65 | Fludioxonil (2,068), Metalaxyl-M (300) |
| Molluscicides | 125 | 13 | 4 | Ferric phosphate (125) |
| Sulphur | 114 | 452 | 3 | [z] |
| Biopesticides | 22 | 16 | 1 | Aureobasidium pullulans (22) |
| All pesticides | 63,957 | 18,993 | 84 | Lambda-cyhalothrin (9,812), Metribuzin (5,062), Prothioconazole (4,647) |
Some shorthand is used in this table: [z] = not applicable. For details of all pesticide use on carrots, please refer to the supporting document.
Table B footnote: Fluopyram and garlic (applied to 291 and 261 treated hectares respectively) were the only active substances used as nematicides on carrots in 2025. In reports prior to 2023 garlic was classified as a physical control.
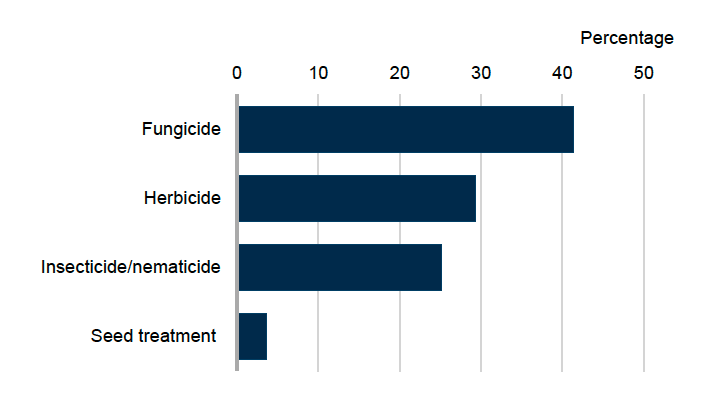
Figure 11 footnote: Molluscicides, sulphur and biopesticides have been excluded as their use represents < 0.5% of the crop treated.
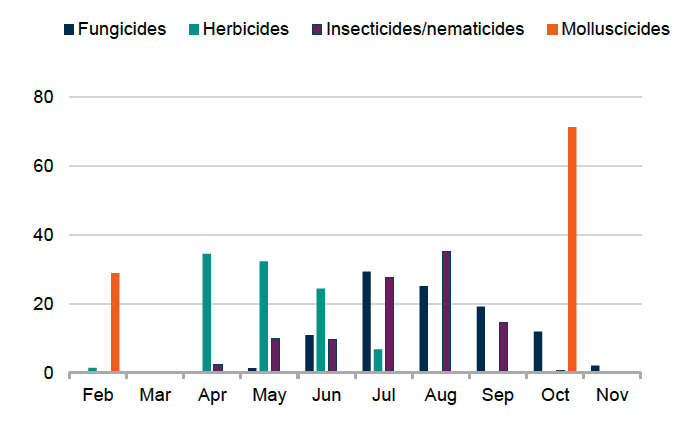
Figure 12 footnote: there were small amounts (<1%) of herbicide applications on carrots in January 2025 which are not shown on this figure. Biopesticides and sulphur have been excluded from this figure. All sulphur was applied in August and all biopesticides were applied in October.
Turnips and swedes
- 1,556 hectares were grown in Scotland in 2025. This represents a 4% decrease since 2023. 1,524 hectares were recorded in the ‘turnips and swede’ census category and 32 hectares in the ‘other vegetable’ census category
- 91% of the crop was treated with a pesticide
- Pesticide formulations were applied to 7,175 treated hectares and 1,583 kilograms of pesticides applied in total
- On average, turnips and swedes received 3.1 pesticide applications (supporting document Table 1). These applications included 1.8 insecticides, 1.2 herbicides and 1.1 fungicides (applied to 91, 91 and 89% of the crop area respectively)
- The majority of herbicides were applied in March. The majority of fungicides, insecticide and molluscicides were applied in July (Figure 14)
- General weed control (4%) was the only reason specified for herbicide use. Caterpillars (30%) and diamond back moth (23%) were specified for insecticide use. No reasons were provided for fungicide use
- The most common variety encountered was the swede Magres accounting for 72% of the sampled area
| Pesticide group | Formulation area treated (ha) | Weight of pesticides applied (kg) | Percentage of crop treated (%) | Top three most used formulations (ha) |
|---|---|---|---|---|
| Herbicides | 2,913 | 907 | 91 | Clomazone (1,338), Metazachlor (1,316), Glyphosate (164) |
| Insecticides | 2,550 | 99 | 91 | Deltamethrin (1,268), Cyantraniliprole (1,216), Spirotetramat (50) |
| Fungicides | 1,642 | 401 | 89 | Azoxystrobin (1,404), Prothioconazole (176), Difenoconazole/fluxapyroxad (39) |
| Molluscicides | 43 | 6 | 3 | Ferric phosphate (43) |
| Sulphur | 27 | 170 | 2 | [z] |
| All pesticides | 7,175 | 1,583 | 91 | Azoxystrobin (1,404), Clomazone (1,338), Metazachlor (1,316) |
Some shorthand is used in this table: [z] = not applicable. For details of all pesticide use on turnips and swedes, please refer to the supporting document.
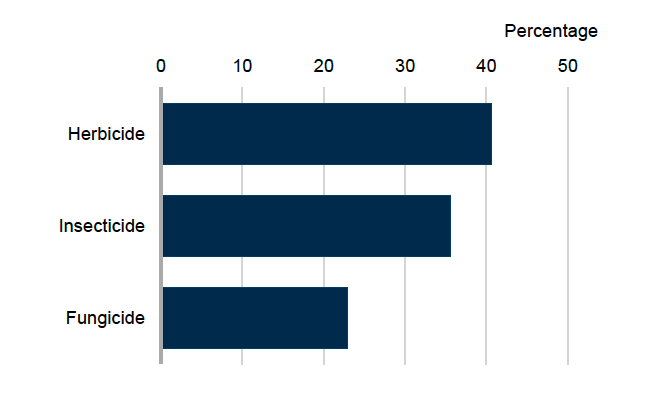
Figure 13 footnote: Molluscicides and sulphur have been excluded as their use represents <1% of the crop treated.
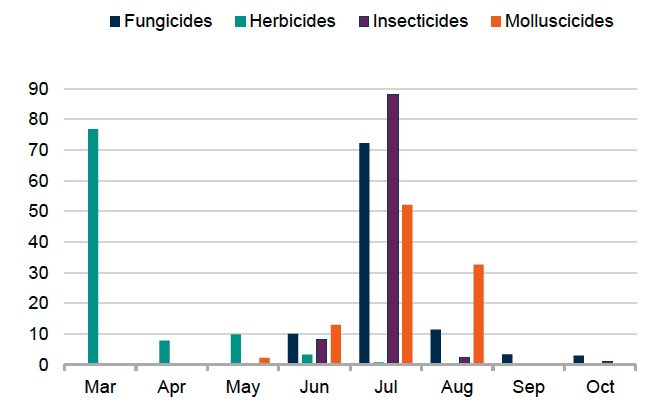
Figure 14 footnote: there were small amounts (<1%) of herbicide applications on turnips and swedes in February 2025 which are not shown in this figure. Sulphur applications are not shown in this figure. All sulphur was applied in July.
Calabrese
- An estimated area of 1,430 hectares were grown in Scotland in 2025. This represents a 5% decrease since 2023. The census area for calabrese in 2025 was 1,790 hectares. However, during the survey it was estimated that 360 hectares of this area was cauliflower. This has been reported in this survey as cauliflower
- 96% of the crop was treated with a pesticide
- All of the calabrese crop was grown from transplants
- Pesticide formulations were applied to 9,271 treated hectares with 4,867 kilograms of pesticide applied in total
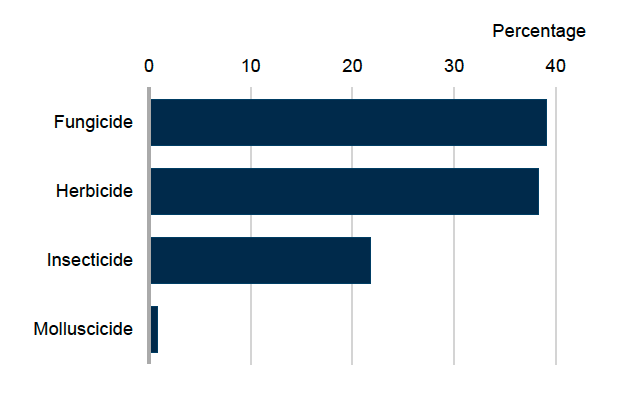
- The calabrese crops received on average 5.4 pesticide applications (supporting document Table 1). These applications included 2.6 fungicide, 2.2 herbicide and 1.7 insecticide applications (applied to 96%, 96% and 82% of the crop area respectively)
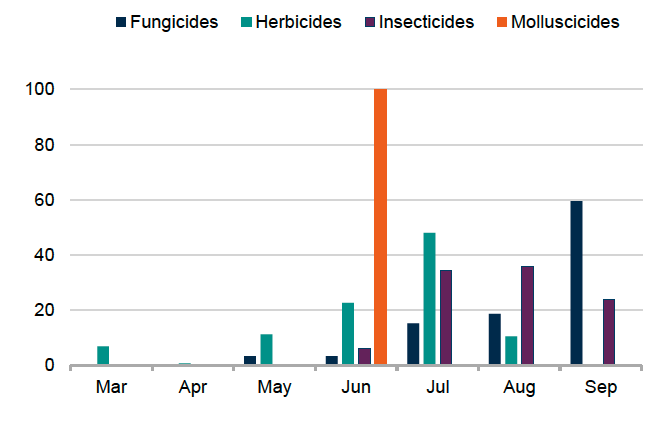
- All molluscicides were applied in June and the majority of fungicides in September. Herbicides were predominantly applied in July and insecticides predominantly applied in July and August. (Figure 16)
- There were no reasons specified for fungicide, herbicide and insecticide use
- The most common varieties encountered were Beany, Parthenon and Titanium accounting for 40%, 25% and 13% of the sample area respectively
| Pesticide group | Formulation area treated (ha) | Weight of pesticides applied (kg) | Percentage of crop treated (%) | Top three most used formulations (ha) |
|---|---|---|---|---|
| Fungicides | 3,626 | 1,483 | 96 | Mandipropamid (1,376), Copper oxychloride (1,302), Fluopicolide/propamocarb hydrochloride (648) |
| Herbicides | 3,552 | 3,270 | 96 | Metazachlor (1,143), Dimethenamid-P/pendimethalin (817), Glyphosate (586) |
| Insecticides | 2,019 | 103 | 82 | Spirotetramat (1,155), Indoxacarb (538), Lambda-cyhalothrin (326) |
| Molluscicides | 75 | 11 | 5 | Ferric phosphate (75) |
| All pesticides | 9,271 | 4,867 | 96 | Mandipropamid (1,376), Copper oxychloride (1,302), Spirotetramat (1,155) |
For details of all pesticide use on calabrese, please refer to the supporting document.
Cauliflower
- An estimated area of 967 hectares were grown in Scotland in 2025. This included 584 hectares recorded in the cauliflower census category, 360 hectares recorded in the calabrese category and 22 hectares in the ‘other vegetable’ category
- All of the cauliflower crop was grown from transplants
- 90% of the crop was treated with a pesticide
- Pesticide formulations were applied to 7,471 treated hectares with 3,536 kilograms of pesticide applied in total
- The cauliflower crops received on average 6.3 pesticide applications (supporting document Table 1). These applications included 2.3 herbicide, 2.1 insecticide, 2.0 fungicide and 1.5 molluscicide (applied to 90%, 54%, 90%, and 90% of the crop area respectively)
- The majority of insecticides were applied in June. Fungicides and molluscicides were predominantly applied in June and herbicides predominantly in July (Figure 18)
- Downy mildew was the only reason given for the use of fungicides (3%). No reasons were provided for herbicide and insecticide use
- The most common varieties encountered were Clarina, Cleozil and Giewont accounting for 56, 16 and 11% of the sample area respectively
| Pesticide group | Formulation area treated (ha) | Weight of pesticides applied (kg) | Percentage of crop treated (%) | Top three most used formulations (ha) |
|---|---|---|---|---|
| Herbicides | 2,915 | 2,483 | 90 | Metazachlor (841), Dimethenamid-P/pendimethalin (808), Clomazone (543) |
| Fungicides | 1,912 | 831 | 90 | Mandipropamid (564), Fluopicolide/propamocarb hydrochloride (481), Azoxystrobin (422) |
| Insecticides | 1,380 | 69 | 54 | Spirotetramat (711), Indoxacarb (524), Lambda-cyhalothrin (112) |
| Molluscicides | 1,264 | 153 | 90 | Ferric phosphate (1,264) |
| All pesticides | 7,471 | 3,536 | 90 | Ferric phosphate (1,264), Metazachlor (841), Dimethenamid-P/pendimethalin (808) |
For details of all pesticide use on cauliflower, please refer to the supporting document.
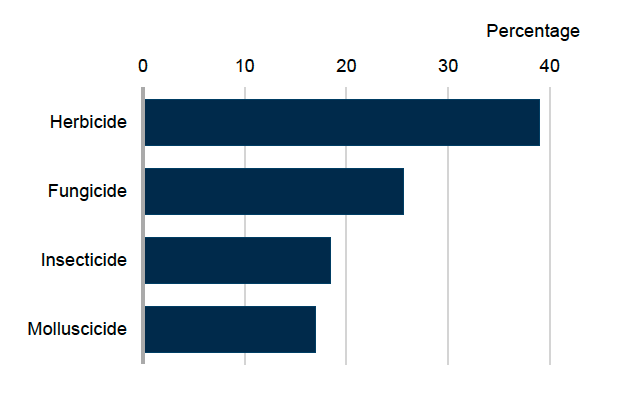
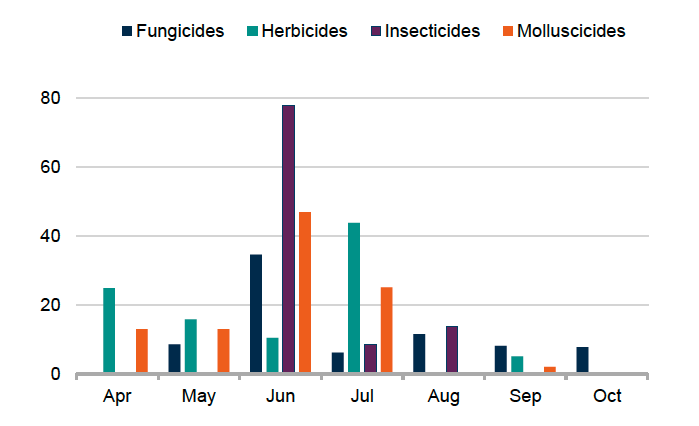
Figure 18 footnote: 23% of fungicides were applied to cauliflower in March 2026 which is not shown on this figure.
Brussels sprouts
- An estimated area of 917 hectares were grown in Scotland in 2025. This represents a 10% decrease since 2023. The census area of Brussels sprouts in 2025 was 966 hectares. During the survey it was estimated that 58 hectares of this area was grown as cabbage. This has been reported under ‘other brassica’ crops in this report. An estimated 10 hectares of Brussels sprouts were recorded in the ‘other vegetable’ census category
- All of the Brussels sprouts crop was grown from transplants
- 99% of the crop was treated with a pesticide
- Pesticide formulations were applied to 25,054 treated hectares with 6,094 kilograms of pesticide applied in total
- The Brussels sprouts crop received on average 17.2 pesticide applications (supporting document Table 1). These applications included 6.7 fungicide, 6.4 molluscicide, 5.5 insecticide and 3.4 herbicide (each applied to 99% of the crop area)
- Herbicides were predominantly applied in May. Fungicides and insecticides were predominantly applied in July and molluscicides predominantly applied in August (Figure 20)
- The only reason specified for herbicide use was general weed control (18%). Reasons for insecticide use were specified for 11% of total use; 7% for aphids and 4% for caterpillars. There were no reasons specified for fungicide use
- The most common varieties encountered were Martinus, Gladius and Steadia accounting for 19%, 18% and 14% of the sample area respectively
| Pesticide group | Formulation area treated (ha) | Weight of pesticides applied (kg) | Percentage of crop treated (%) | Top three most used formulations (ha) |
|---|---|---|---|---|
| Fungicides | 8,542 | 1,921 | 99 | Prothioconazole (2,360), Boscalid/pyraclostrobin (1,938), Difenoconazole/ fluxapyroxad (1,386) |
| Insecticides | 6,684 | 301 | 99 | Indoxacarb (1,879), Flonicamid (1,333), spirotetramat (1,323) |
| Molluscicides | 5,807 | 725 | 99 | Ferric phosphate (5,807) |
| Herbicides | 4,022 | 3,146 | 99 | Clomazone (907), Metazachlor (907), Dimethenamid-P/ pendimethalin (598) |
| All pesticides | 25,054 | 6,094 | 99 | Ferric phosphate (5,807), Prothioconazole (2,360), Boscalid (1,938) |
For details of all pesticide use on brussels sprouts, please refer to the supporting document.
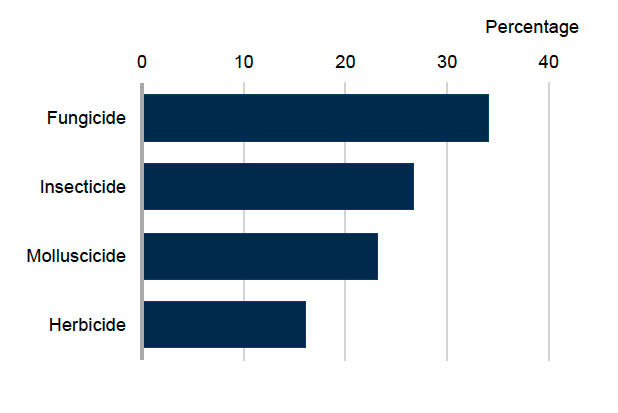
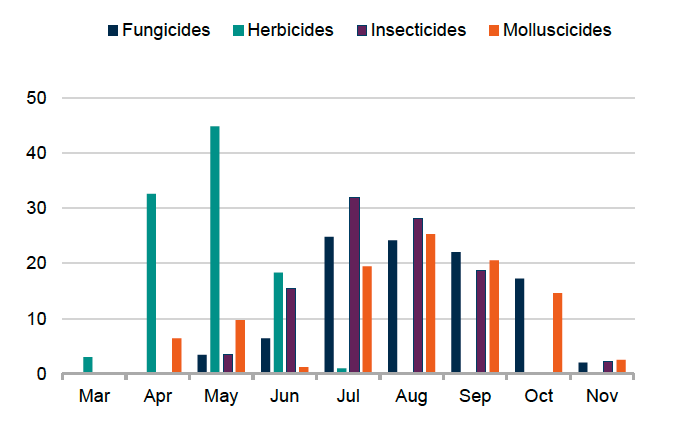
Figure 20 footnote: there were small amounts (<1%) of herbicide applications on Brussels sprouts in February 2025 which are not shown on this figure.
Other brassica crops
- Other brassica crops encountered in the 2025 survey were red, white, spring and summer/autumn cabbage, savoy, as well as broccoli, purple sprouting broccoli, kale and romanesco (some of which were recorded in the ‘other vegetable’ census category)
- An estimated area of 961 hectares were grown in Scotland in 2025
- 98% of the crop was grown from transplants
- 95% of the crop was treated with a pesticide
- Pesticide formulations were applied to 11,207 treated hectares with 4,052 kilograms of pesticide applied in total
- Other brassica crops received on average 6.0 pesticide applications (supporting document Table 1). These applications included 2.6 insecticide, 2.3 fungicide, 2.2 molluscicide and 2.0 herbicide (applied to 65, 82, 82, 95% of the total crop area respectively)
- The majority of herbicides were applied in July. Fungicides were predominantly applied in July and insecticides in June (Figure 22)
- Reasons were specified for 22% of total fungicide use; downy mildew (14%) and disease control (8%). Reasons were specified for 32% of herbicide use; general weed control (32%) and annual broad-leaved weeds (less than 1%). Aphid control (11%) was the only reason specified for insecticide use
| Pesticide group | Formulation area treated (ha) | Weight of pesticides applied (kg) | Percentage of crop treated (%) | Top three most used formulations (ha) |
|---|---|---|---|---|
| Insecticides | 3,505 | 159 | 65 | Spirotetramat (800), Lambda-cyhalothrin (768), Indoxacarb (549) |
| Herbicides | 3,317 | 2,779 | 95 | Pendimethalin (911), Metazachlor (792), Clomazone (789) |
| Fungicides | 2,655 | 1,012 | 82 | Azoxystrobin (917), Prothioconazole (448), Fluopicolide/propamocarb hydrochloride (379) |
| Molluscicides | 1,731 | 101 | 82 | Ferric phosphate (1,731) |
| All pesticides | 11,207 | 4,052 | 95 | Ferric phosphate (1,731), Azoxystrobin (917), Pendimethalin (911) |
For details of all pesticide use on other brassica crops, please refer to the supporting document.
Other vegetable crops
- Other vegetable crops encountered in the 2025 survey were beetroot, broad beans, leeks, lettuce, onions, parsnips, pumpkin, rhubarb and squash (some of which were recorded in the ‘other vegetables’ census category)
- 2,890 hectares were grown in Scotland in 2025. No multi-cropping was encountered during the 2025 survey
- Broad beans were reported separately in the previous survey in 2023, but a lower sample number in 2025 meant it had to be combined with other vegetables for reporting
- 9% of other vegetable crops were grown from transplants
- 78% of other vegetable crops were treated with a pesticide
- Pesticide formulations were applied to 19,245 treated hectares with 5,446 kilograms of pesticide applied in total
- The 78% of the other vegetable crops treated with a pesticide received on average 4.1 pesticide applications (supporting document Table 1). These applications included 2.6 fungicides, 1.6 herbicides and 1.3 insecticides (applied to 76%, 78% and 74% of the crop respectively)
- Reasons were specified for 12% of total fungicide use, sclerotinia and canker (6% each). Reasons for herbicide applications were supplied for 41% of total use, including annual broad-leaved weeds (25%), general weed control (11%) and annual grass weeds (5%). Aphid control (16%) was the only specified reason for insecticide use
- The majority of herbicides were applied in May and the majority of fungicides and insecticides were applied in July. The majority of molluscicides were applied in April (Figure 24)
| Pesticide group | Formulation area treated (ha) | Weight of pesticides applied (kg) | Percentage of crop treated (%) | Top three most used formulations (ha) |
|---|---|---|---|---|
| Fungicides | 8,135 | 1,764 | 76 | Azoxystrobin (2,164), Boscalid/pyraclostrobin (1,988), Metconazole (1,833) |
| Insecticides | 4,669 | 286 | 74 | Deltamethrin (1,833), Pirimicarb (1,833), Lambda-cyhalothrin (922), |
| Herbicides | 4,392 | 2,988 | 78 | Imazamox/pendimethalin (1,833), Aclonifen (911), metamitron (396) |
| Seed treatments | 1,843 | 27 | 64 | Fludioxonil (1,843) |
| Growth regulators | 123 | 368 | 4 | Maleic hydrazide (123) |
| Molluscicides | 84 | 12 | 3 | Ferric phosphate (84) |
| All pesticides | 19,245 | 5,446 | 78 | Azoxystrobin (2,164), Boscalid/pyraclostrobin (1,988), Fludioxonil (1,843) |
For details of all pesticide use on other vegetable crops, please refer to the supporting document.
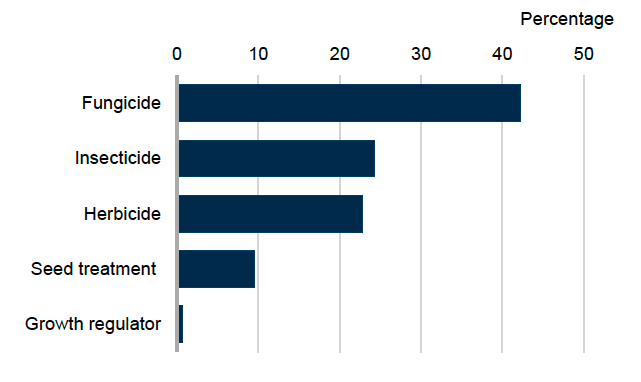
Figure 23 footnote: Molluscicides have been excluded as their use represents <0.5% of the crop area.
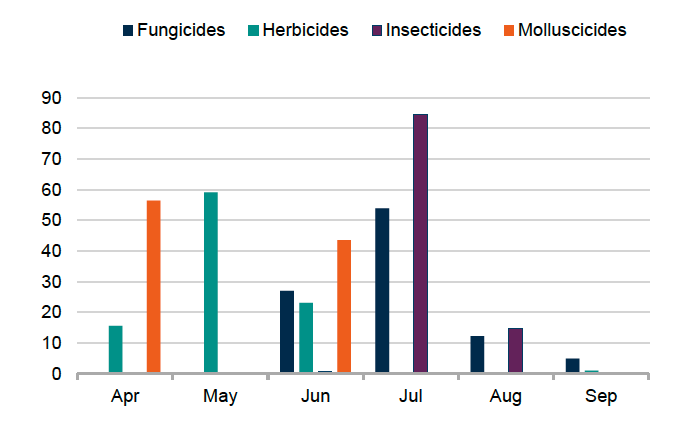
Figure 24 footnote: there were small amounts of herbicide application to other vegetable crops in March (<1%) and fungicide application in October (<2%) which are not shown in this figure. Growth regulator applications are not shown in this figure. All growth regulators were applied in October.
Contact
Email: psu@sasa.gov.scot