Our Path Ahead: Chief Medical Officer for Scotland Annual Report 2025–2026
This report frames our path ahead for Scotland’s health and care: supporting careful and kind care, responding to disruption and creating the conditions for health. By designing systems around people, we can achieve a more humane, sustainable and fair system focused on the outcomes that matter.
Chapter 5: Health of the Nation
Here, I set out important challenges for Scotland’s health and wellbeing. These challenges have informed the preceding chapters of my report.
Two pressures stand out. First, rising need and complexity are increasing demand and stretching the capacity of health and care services. Second, impactful inequity continues to shape who lives longer, who lives well and who bears the greatest burden of preventable illness.
These challenges are deeply connected. Rising need is not evenly distributed across the population, and socioeconomic inequity itself drives complexity through earlier onset of disease, greater multimorbidity and higher exposure to avoidable risk. Together, they show why improving health cannot rely on healthcare alone and why prevention, equity and system design sit at the heart of this report.
Rising need and complexity
Rising need and complexity are central to the pressures the health and care system is experiencing. The burden of disease is forecast to increase as a result of demographic change, with much of this growth concentrated in cardiovascular diseases, cancers and neurological conditions. This is translating into growing demand for services alongside greater clinical and social complexity among those we serve.
Rising burden of disease
While the population is projected to decline over the next two decades, Scotland’s annual disease burden is forecast to increase 21% between 2019 and 2043. This forecast is primarily driven by population ageing, assuming disease prevalence rates remain the same with no changes in risk factors, access to services or future advances in prevention and treatment.
The largest growth in total disease burden is forecast in those aged 65 to 84 years, reflecting both the expansion of this age group and the higher levels of ill health experienced at older ages. While both males and females are projected to experience rising burden, around 55% of the overall increase is forecast to occur among males.
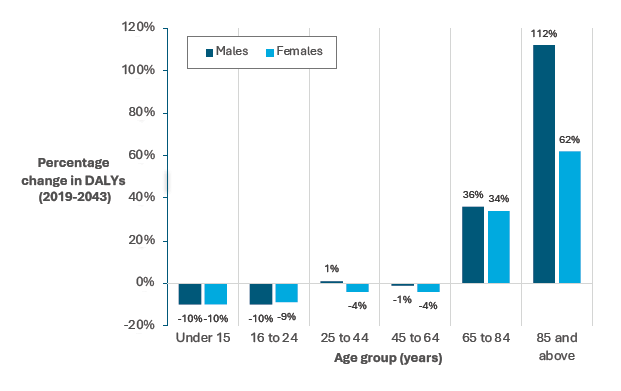
Source: Scottish Burden of Disease Forecasting Briefing
Burden of disease projections can be further broken down for specific conditions. These account for historic trends as well as demographic change and estimate that the number of people living with several long-term conditions is likely to increase substantially. For example, between 2019 and 2044, the number of people living with diabetes is projected to increase by over 110,000 (36%), chronic obstructive pulmonary disease (COPD) by around 85,000 (63%) and cerebrovascular disease by nearly 38,000 (36%). The number of people with dementia is estimated to increase by between 52–58%, with notable increases also projected in the number of people with colorectal (44%) and lung cancers (58%) and females with breast cancer (59%). The largest absolute increases are forecast for cardiovascular diseases, cancers and neurological conditions, which together account for more than two-thirds of the overall rise.
Disease burden is not equally distributed. Disability adjusted life years (combining years of life lost due to early death and years lived in ill health), before the pandemic, were around 2.4 times higher in the most deprived areas compared with the least deprived. This gap was largely driven by inequalities in premature mortality. The same underlying diseases were key drivers for these inequalities and the disease burden at the time: heart disease, drug use, lung cancer and COPD.
All the above underlines both the scale of the challenge ahead and the opportunity to alter future trajectories through prevention and earlier intervention.
Rising demand
Rising disease burden will translate into increased demand for services. Between 2024 and 2034, unplanned acute inpatient hospital admissions are projected to rise by 11.8%, from around 586,000 to 656,000 admissions per year. Demographic change, particularly population ageing, appears to be the primary driver of increased demand among adults aged 65 and over. At the same time, although the child population is shrinking, paediatric specialty admissions are projected to rise, with overall admissions among children remaining stable.
Increasing complexity
Many people are now living with multiple long-term conditions. The Scottish Health Survey 2024 shows 28% of adults aged 16 and over had two or more long term conditions. Of those with at least one condition, 51% had two or more conditions.

Source: Scottish Health Survey 2024
Living with multiple conditions is linked to higher mortality, reduced functional ability and increased use of health and care services. Importantly, multimorbidity develops earlier in more deprived communities. All of this reinforces the need for care that is joined up, holistic and centred on the person, rather than focused on single conditions in isolation.
Impactful Inequalities
Alongside rising need, impactful inequalities remain a defining feature of Scotland’s health. Disadvantage continues to shape both how long people live and how many of those years are spent in good health. Persistent gaps in life expectancy and healthy life expectancy show that years of life lost and years lived with illness accumulate with socioeconomic disadvantage across the life course.
Life expectancy and healthy life expectancy
People living in the most deprived communities experience fewer years in good health than those in the least deprived —26.7 fewer years for women and 25.6 fewer years for men. While overall life expectancy increased in 2022–24 and has recovered to around pre-pandemic levels, healthy life expectancy for the same period has continued to fall, meaning across Scotland, more years are being lived in poor health.
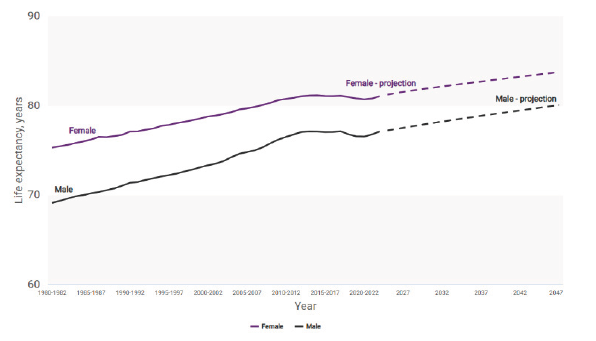
Source: Life Expectancy in Scotland, 2022-2024 - National Records of Scotland (NRS)
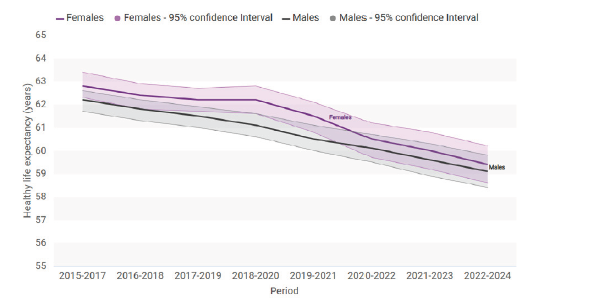
Source: Healthy Life Expectancy, 2022-2024 - National Records of Scotland (NRS)
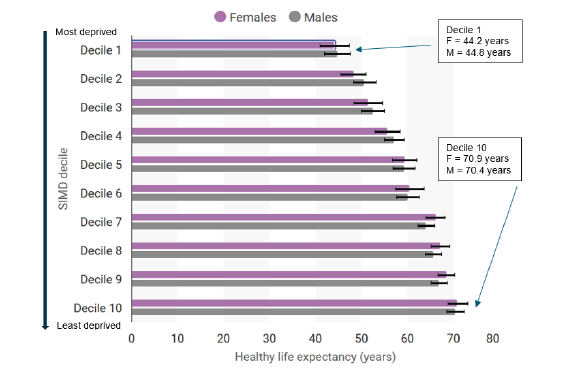
Source: Healthy Life Expectancy, 2022-2024 - National Records of Scotland (NRS)
Premature mortality
Premature mortality — deaths before age 75 — declined steadily from the late 1990s until around 2014. Since then, progress has stalled or reversed, particularly in the most deprived communities. Key contributors include cancer, circulatory system diseases (including ischaemic/coronary heart disease), respiratory conditions and accidents.
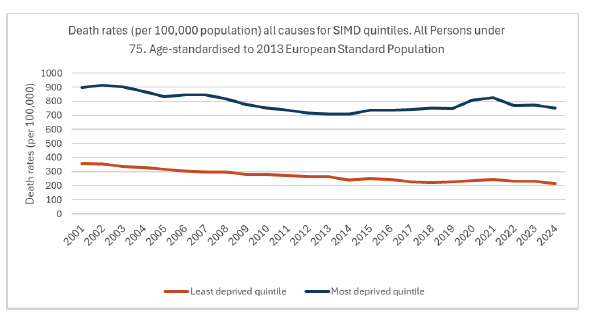
Source: National Records of Scotland
Mortality from cancer and circulatory system disease
Cancer and circulatory system diseases (including ischaemic/coronary heart disease) mortality continues to show marked socioeconomic differences. Cancer incidence (all cancers combined, excluding non-melanoma skin cancer) is 24% higher in the most deprived areas than in the least deprived, and mortality rates are also higher with deprivation. The avoidable mortality rate for cancer in the most deprived fifth of the population has been at least double that of the least deprived fifth since 2001 with the gap widening steadily over time. The latest PHS analysis showed mortality rates for all cancers combined were 78% higher in the most deprived areas compared with the least deprived. These patterns reflect both higher exposure to risk factors — including smoking, obesity and lower vaccination uptake including Human Papilloma Virus vaccination) — and poorer survival from cancer in more deprived areas.
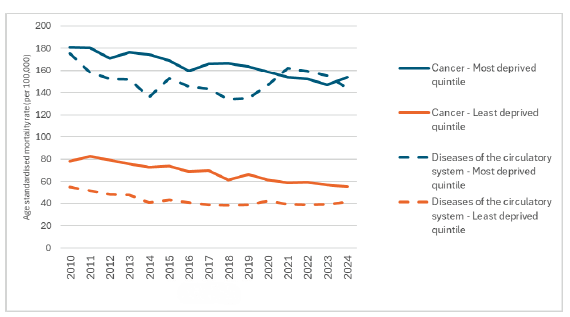
Source: Avoidable Mortality, 2024 - National Records of Scotland (NRS)
Similar gradients persist for circulatory system diseases (which include ischaemic/coronary heart disease), where higher mortality rates among people experiencing more deprivation sit alongside greater prevalence of modifiable risk factors such as hypertension, diabetes, smoking and obesity. Differences in rates of improvement — and in some cases deterioration — show that overall progress cannot be assumed to benefit all groups equally.
Smoking
Smoking and obesity continue to play a major role in shaping these outcomes and it is critical that we continue to address both of these in tandem. Smoking remains a leading cause of preventable disease and premature death, accounting for an estimated 7,085 deaths in those aged 35 and over in 2024. The Tobacco and Vapes Act represents a major step toward reducing and ending smoking by introducing a smokefree generation, strengthening regulation and protecting children and young people.
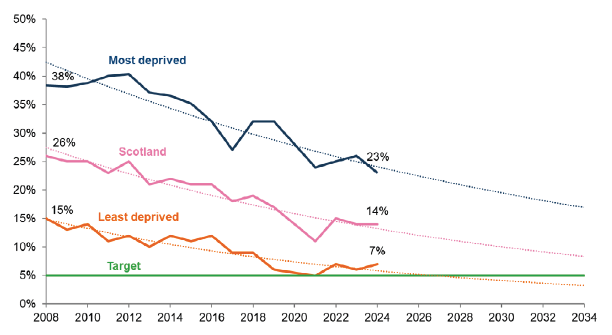
Source: Scottish Health Survey
Obesity
Obesity is another major contributor to ill health across the life course, increasing the risk of cardiovascular disease, diabetes, cancer and musculoskeletal conditions. Like smoking, obesity is socially patterned. It is a complex condition shaped by powerful social, economic and commercial determinants. It is not a failure of individual will or choice. Addressing obesity therefore requires sustained action on upstream drivers, alongside accessible, evidence-based support and active efforts to challenge weight-related stigma, which undermines trust and creates barriers to care.
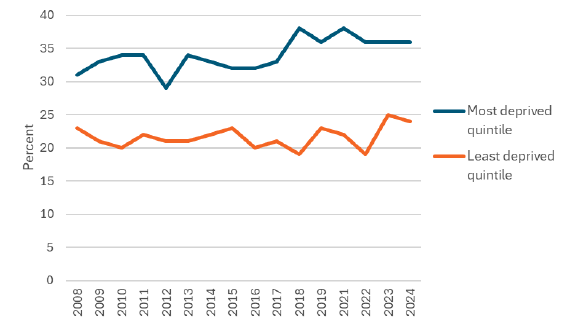
Source: Scottish Health Survey
Young people’s mental health
Inequity is also visible early in life. Mental health and wellbeing among children and young people show clear differences by sex and deprivation, with wellbeing declining across stages of schooling and girls reporting poorer mental health across many measures. Children and young people in the most deprived areas consistently report lower wellbeing, higher levels of difficulty and lower life satisfaction. These patterns matter because they shape future health, educational attainment and economic participation, reinforcing the importance of early, preventative action across the places where young people live, learn and grow.
Contact
Email: RealisticMedicine@gov.scot