Non-Domestic Rates Relief Statistics 2022
This publication provides statistics on the numbers of recipients and values of Non-Domestic Rates reliefs in Scotland, including breakdowns by relief, property type and local authority area, and additional information on SBBS.
Non-domestic rates reliefs as at 1 July 2022
The number and proportion of properties in receipt of relief
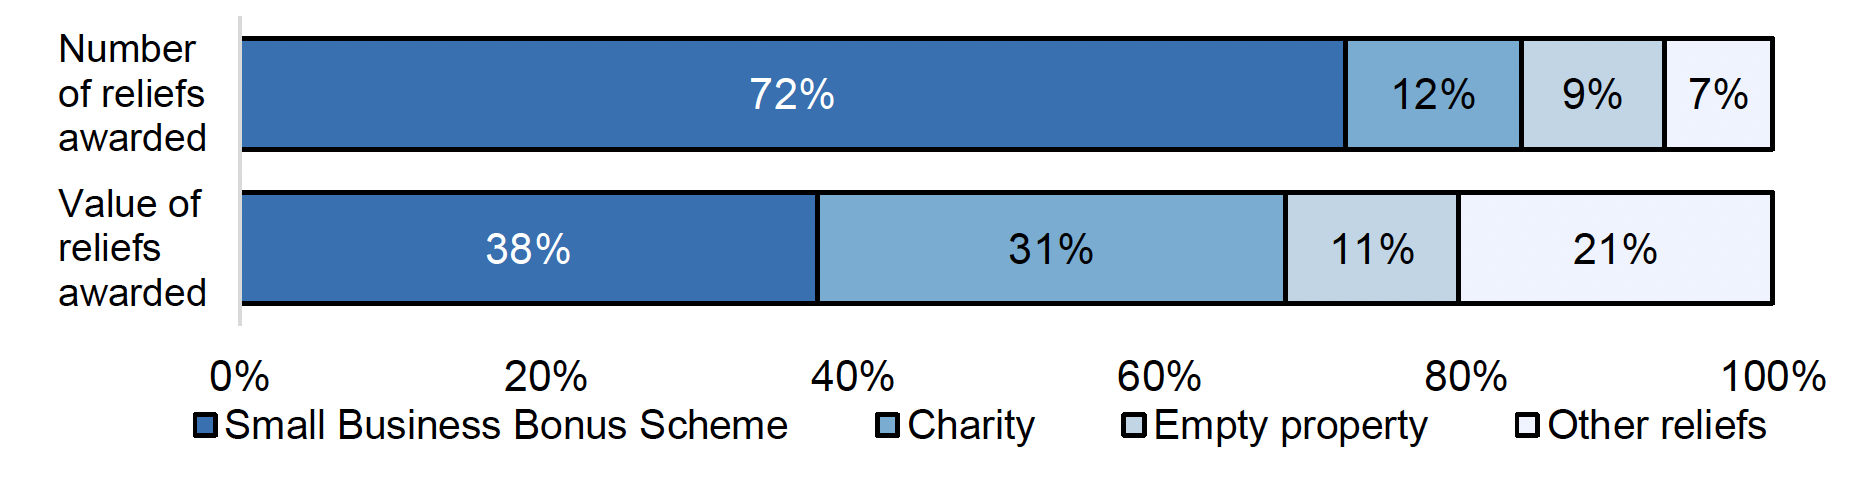
Table 1 and Figure 1 show the most commonly awarded reliefs. These are SBBS, Charity, and reliefs and exemptions for unoccupied properties. The figures are presented as a proportion of all awards, and the value of those reliefs as a proportion of the value of all reliefs.
Together, these three reliefs accounted for 93% of all relief awards and 79% of the value of all reliefs.
| Relief proportion | Small Business Bonus Scheme | Charity | Empty property | Other reliefs |
|---|---|---|---|---|
| Number of reliefs awarded | 72% | 12% | 9% | 7% |
| Value of reliefs awarded | 38% | 31% | 11% | 21% |
Please note:
Charity relief includes both mandatory and discretionary elements.
Empty property relief includes relief for unoccupied properties, exemptions for unoccupied listed properties, and exemptions for other unoccupied properties.
The number of properties in receipt of relief
Table 2a shows the number of properties in receipt of relief, and the number of reliefs awarded, as at 1 June 2021 and 1 July 2022.
The number of properties receiving relief has decreased from 172,290 in 2021 to 161,390 in 2022, primarily due to the expiration of the RHL relief. The number of properties receiving 100% relief has similarly decreased, from 158,790 to 145,370.
The number of properties receiving 100% SBBS has increased from 111,180 in 2021 to 114,880 in 2022. The lower number in 2021 is likely due to reviews of SBBS which several local authorities ran in 2021. These reviews may involve cancelling reliefs and inviting ratepayers to reapply, which reduced the number of properties reported with SBBS in the 2021 snapshot, even though many of the awards were expected to be reinstated later in the year.
| Number of properties in receipt of relief | 2021 (as at 1 June) | 2022 (as at 1 July) |
|---|---|---|
| Number of properties on Valuation Roll, including zero-rated properties; | 259,010 | 260,840 |
| Of which non-zero-rated [note 1] | 252,430 | 254,170 |
| Number of properties receiving one or more reliefs | 172,290 | 161,390 |
| Number of properties receiving 100% relief; | 158,790 | 145,370 |
| of which 100% Small Business Bonus Scheme (SBBS) relief [note 4] | 111,180 | 114,880 |
| of which 100% Retail Hospitality and Leisure (RHLA) relief [note 5] | 15,510 | [d] |
| of which 100% other relief | 28,150 | 29,340 |
| of which a combination of SBBS and RHLA relief [note 4, 5] | 1,970 | [d] |
| of which a combination of SBBS and other relief [note 4] | 1,180 | 1,140 |
| of which a combination of RHLA and other relief [note 5] | 800 | [d] |
| Total number of reliefs awarded | 184,250 | 170,620 |
For numbered notes, see the notes to tables section of this publication.
In addition, please note:
- The Retail, Hospitality, Leisure and Aviation (RHLA) was available in 2020-21 and 2021-22. For the first three months of 2022-23, it was replaced by the Retail, Hospitality and Leisure (RHL) relief.
- 'Other relief' includes all reliefs except SBBS and RHLA relief.
- 'Of which a combination of SBBS and RHLA' relief also includes properties receiving SBBS, RHLA and one or more other reliefs.
The proportion of properties in receipt of relief
Overall, 63% of all properties were in receipt of at least one relief, compared to 68% in 2021. 57% of all properties received 100% relief, compared to 63% in 2021. The proportion of properties receiving 100% SBBS relief increased by one percentage point to 45%.
| Relief proportions | 2021 (as at 1 June) | 2022 (as at 1 July) |
|---|---|---|
| Proportion of properties receiving one or more reliefs | 68% | 63% |
| Proportion of properties receiving 100% relief; | 63% | 57% |
| of which 100% Small Business Bonus (SBBS) relief [note 4] | 44% | 45% |
| of which 100% Retail Hospitality and Leisure (RHLA) relief [note 5] | 6% | [d] |
| of which 100% other relief | 11% | 12% |
| of which a combination of SBBS and RHLA relief [note 4, 5] | 1% | [d] |
| of which a combination of SBBS and other relief [note 4] | 0% | 0% |
| of which a combination of RHLA and other relief [note 5] | 0% | [d] |
For numbered notes, see the notes to tables section of this publication.
In addition, please note:
- The RHLA was available in 2020-21 and 2021-22. For the first three months of 2022-23, it was replaced by the RHL relief.
- 'Other relief' includes all reliefs except SBBS and RHLA relief.
- 'Of which a combination of SBBS and RHLA' relief also includes properties receiving SBBS, RHLA and one or more other reliefs.
Number, proportion and value of reliefs by relief
Table 3 shows the number, proportion and value of reliefs awarded by relief type at the snapshot date in 2022.
Tables 3a to 3d are available in the publication tables workbook, and contain comparisons of figures presented in Table 3 for previous years (2018 to 2021).
The most frequently awarded relief was SBBS relief, followed by Charity relief, and the reliefs and rates exemptions awarded to unoccupied properties. Combined these reliefs accounted for 93% of all reliefs awarded as at 1 July 2022, and for 79% of the value of all reliefs. Almost four in five properties receiving relief were awarded one of these four reliefs.
Table 3a compares the numbers of reliefs awarded in every year since 2018. Across the years, the number of recipients for most reliefs remained broadly consistent, although policy changes and periodic reviews of certain reliefs (most notably SBBS) have resulted in some fluctuations. Note that, due to software issues, some reliefs were not reported at all in 2018, while others were not reported separately and are instead listed as 'unknown'.
The total value of all reliefs awarded at 1 July 2022 was £730m, a decrease of £506m compared to the value of reliefs as at 1 June 2021, when the total was £1,236m (see Table 3d). This is primarily due to the RHL relief no longer being available from 1 July 2022.
| Relief type | Number of reliefs awarded | Reliefs awarded by type as a proportion of all reliefs awarded | Proportion of all properties on the Valuation Roll that receive relief | Relief value (£ millions) [note 6] |
|---|---|---|---|---|
| Small Business Bonus Scheme relief | 123,010 | 72% | 48% | 274.8 |
| Charity relief [note 7] | 19,630 | 12% | 5% | 223.5 |
| Empty Property relief and exemptions | 15,860 | 9% | 6% | 82.0 |
| Religious exemptions | 4,550 | 3% | 2% | 27.8 |
| Rural relief [note 7] | 2,120 | 1% | 1% | 3.9 |
| Disabled Rates relief | 1,860 | 1% | 1% | 63.8 |
| Sports Club relief [note 7] | 1,450 | 1% | 1% | 12.8 |
| Day Nursery relief | 750 | 0% | 0% | 9.9 |
| Renewable Energy relief | 310 | 0% | 0% | 7.8 |
| Business Growth Accelerator (BGA) relief | 450 | 0% | 0% | 17.6 |
| Fresh Start relief | 320 | 0% | 0% | 4.3 |
| Lighthouse relief | 140 | 0% | 0% | 0.4 |
| Enterprise Areas relief | 110 | 0% | 0% | 0.9 |
| District Heating relief | 20 | 0% | 0% | 0.4 |
| Transitional relief | 30 | 0% | 0% | 0.1 |
| Mobile Masts relief | [low] | 0% | 0% | 0.0 |
| Hardship relief [note 7] | 10 | 0% | 0% | 0.1 |
| Community Empowerment Act relief | [low] | 0% | 0% | 0.0 |
| New Fibre relief | 0 | 0% | 0% | 0.0 |
| Stud Farms relief [note 7] | 0 | 0% | 0% | 0.0 |
| All reliefs | 170,620 | 100% | 63% | 730.0 |
For numbered notes, see the notes to tables section of this publication.
In addition, please note:
- The figures for Charity, Rural, and Sports reliefs include both the mandatory and discretionary reliefs.
Reliefs awarded by local authority
Table 4 shows the number and proportion of properties in receipt of relief, the relief value and the proportion of gross bills accounted for, by local authority, at the snapshot date in 2022. Comparable figures for previous years (2018-2021) can be found in Tables 4a – 4d in the publication tables workbook.
Nearly two thirds (64%) of all properties on the Valuation Roll (excluding designated utilities) were receiving a relief as at 1 July 2022 – this compares with 68% as at 1 June 2021. In seventeen local authorities, more than two thirds of all properties were in receipt of a relief; the highest proportions of properties receiving relief were in Orkney (82%) and the Scottish Borders (78%), while the lowest could be found in Aberdeen City (39%) and Renfrewshire (46%).
Compared to the last snapshot, the value of reliefs has decreased in all local authorities, and the number of properties receiving relief, have decreased in most. This is due to the RHL relief no longer being available from 30 June 2022, and the reviews of SBBS relief conducted in some areas at the last snapshot.
Across Scotland, reliefs accounted for just over a fifth of the total gross bill (excluding designated utilities), which is a decrease of 16 percentage point compared to 2021, but comparable to the figures for 2018 and 2019. This is largely due to the withdrawal of the RHL relief, which at the 2021 snapshot had a value of £536m.
A detailed breakdown of the number of awards of each relief within each local authority is available in table A in the additional tables workbook.
| Local authority | Number of properties receiving one or more reliefs | Proportion of properties in each local authority receiving one or more reliefs | Relief value (£ millions) [note 6] | Total value of reliefs as a proportion of total gross bill for all properties on the Valuation Roll [note 6] |
|---|---|---|---|---|
| Aberdeen City | 3,852 | 39% | 41.3 | 14% |
| Aberdeenshire | 9,759 | 74% | 29.9 | 19% |
| Angus | 4,094 | 76% | 12.9 | 32% |
| Argyll & Bute | 6,660 | 70% | 16.4 | 29% |
| City of Edinburgh | 11,816 | 51% | 95.0 | 20% |
| Clackmannanshire | 1,142 | 67% | 4.3 | 20% |
| Dumfries & Galloway | 7,217 | 71% | 15.9 | 21% |
| Dundee City | 3,775 | 62% | 26.8 | 28% |
| East Ayrshire | 3,048 | 66% | 11.7 | 28% |
| East Dunbartonshire | 1,498 | 63% | 9.3 | 27% |
| East Lothian | 2,787 | 73% | 12.2 | 30% |
| East Renfrewshire | 1,223 | 68% | 6.2 | 29% |
| Falkirk | 3,299 | 62% | 14.0 | 15% |
| Fife | 9,788 | 70% | 39.8 | 25% |
| Glasgow City | 16,690 | 61% | 125.8 | 25% |
| Highland | 14,937 | 74% | 44.7 | 26% |
| Inverclyde | 1,510 | 62% | 7.0 | 25% |
| Midlothian | 1,699 | 56% | 9.9 | 22% |
| Moray | 3,842 | 72% | 9.9 | 15% |
| Na h-Eileanan Siar | 2,191 | 77% | 4.8 | 35% |
| North Ayrshire | 4,026 | 74% | 14.9 | 26% |
| North Lanarkshire | 5,836 | 56% | 25.7 | 17% |
| Orkney Islands | 2,141 | 82% | 4.0 | 27% |
| Perth & Kinross | 6,992 | 72% | 23.1 | 28% |
| Renfrewshire | 4,565 | 46% | 20.6 | 19% |
| Scottish Borders | 6,904 | 78% | 16.2 | 31% |
| Shetland Islands | 1,696 | 72% | 4.9 | 17% |
| South Ayrshire | 2,748 | 51% | 10.9 | 19% |
| South Lanarkshire | 6,218 | 56% | 29.8 | 17% |
| Stirling | 3,826 | 64% | 15.8 | 25% |
| West Dunbartonshire | 1,578 | 52% | 7.8 | 20% |
| West Lothian | 4,034 | 60% | 18.6 | 18% |
| Scotland | 161,391 | 64% | 730.0 | 22% |
For numbered notes, see the notes to tables section of this publication.
In addition, please note that this table excludes designated utilities not receiving relief as at the snapshot dates, as these would distort the proportions presented for local authorities with responsibility for designated utilities. In addition, Torness Nuclear Power Station in East Lothian is excluded from the 2022 figures. It was previously part of a designated utility entry, until 7 January 2022. Due to this, the totals presented in these tables may not correspond with other tables in this publication.
Reliefs awarded by property class
Table 5 shows the proportion of properties within each property class receiving a relief, and the value of those reliefs.
In addition Table 5a shows the proportion of properties in each class receiving one or more reliefs since 2018, and Table 5b shows the value of reliefs awarded by property class since 2018. These tables are available in the publication tables workbook.
The highest proportions of properties receiving relief can be found among religious properties, care facilities, cultural properties, and leisure properties, with more than four out of five properties in each of those classes receiving relief.
Conversely, the lowest proportions of properties receiving relief are among petrochemicals (5%), and advertising properties (8%).
Table B in the additional tables workbook shows the breakdown of the number of reliefs by property class and relief, while Table E in the same workbook shows the values of those reliefs.
| Property class | Proportion of properties in each class receiving one or more reliefs | Relief value (£ millions) [note 6] |
|---|---|---|
| Advertising | 8% | 0.1 |
| Care Facilities | 83% | 54.5 |
| Communications | 16% | 0.1 |
| Cultural | 85% | 21.8 |
| Education and Training | 33% | 74.6 |
| Garages and Petrol Stations | 66% | 6.6 |
| Health and Medical | 50% | 20.4 |
| Hotels | 61% | 16.0 |
| Industrial Subjects | 61% | 92.4 |
| Leisure, Entertainment, Caravans, etc. | 85% | 84.5 |
| Offices | 60% | 114.5 |
| Other | 45% | 14.7 |
| Petrochemical | 5% | 0.2 |
| Public Houses | 38% | 7.1 |
| Public Service Subjects | 56% | 42.2 |
| Quarries, Mines, etc. | 31% | 0.3 |
| Religious | 86% | 26.0 |
| Shops | 65% | 134.8 |
| Sporting Subjects | 76% | 8.0 |
| Statutory Undertaking | 33% | 11.2 |
| All | 63% | 730.0 |
For numbered notes, see the notes to tables section of this publication.
In addition, please note that property class is a classification used by the Scottish Assessors to describe the type of a property, and may not accurately reflect its use. For example, a property classified as a 'shop' may in fact be used to offer financial services.
Properties receiving 100% relief
Most of the properties (90%) receiving relief on 1 July 2022 were receiving 100% relief, meaning they paid no rates.
There were 145,370 properties receiving 100% relief (57% of all properties), most of which (114,880; 45% of all properties) received 100% SBBS relief.
The value of reliefs awarded to properties receiving 100% relief was £593m, which is 81% of the value of all reliefs.
Table 6 shows the number of properties receiving 100% relief, and the value of all reliefs awarded to those properties, in each local authority. In addition, Table 6a shows the number of properties receiving 100% relief in each year since 2018, and Table 6b the value of reliefs awarded to some properties, in each local authority since 2018. These tables can be found in the publication tables workbook.
| Local authority | Number of properties receiving 100% relief | Value of reliefs awarded to properties receiving 100% relief (£ millions) [note 6] |
|---|---|---|
| Aberdeen City | 3,090 | 30.5 |
| Aberdeenshire | 8,790 | 26.1 |
| Angus | 3,790 | 12.1 |
| Argyll and Bute | 6,230 | 14.0 |
| City of Edinburgh | 9,810 | 63.6 |
| Clackmannanshire | 960 | 3.7 |
| Dumfries & Galloway | 6,760 | 14.3 |
| Dundee City | 3,320 | 21.4 |
| East Ayrshire | 2,870 | 10.8 |
| East Dunbartonshire | 1,370 | 8.2 |
| East Lothian | 2,560 | 10.5 |
| East Renfrewshire | 1,130 | 5.7 |
| Falkirk | 3,010 | 12.5 |
| Fife | 8,770 | 33.3 |
| Glasgow City | 14,560 | 92.4 |
| Highland | 13,740 | 38.0 |
| Inverclyde | 1,390 | 6.4 |
| Midlothian | 1,490 | 6.3 |
| Moray | 3,460 | 8.4 |
| Na h-Eileanan Siar | 2,100 | 4.5 |
| North Ayrshire | 3,680 | 13.4 |
| North Lanarkshire | 5,230 | 23.8 |
| Orkney Islands | 2,050 | 3.9 |
| Perth and Kinross | 6,400 | 19.1 |
| Renfrewshire | 4,120 | 18.0 |
| Scottish Borders | 6,470 | 14.9 |
| Shetland Islands | 1,590 | 4.7 |
| South Ayrshire | 2,480 | 9.1 |
| South Lanarkshire | 5,700 | 26.4 |
| Stirling | 3,540 | 13.0 |
| West Dunbartonshire | 1,450 | 6.9 |
| West Lothian | 3,460 | 16.7 |
| Scotland | 145,370 | 592.8 |
For numbered notes, see the notes to tables section of this publication.
Contact
Email: lgfstats@gov.scot