Non-Domestic Rates Relief Statistics 2021
This publication provides statistics on the numbers of recipients and values of Non-Domestic Rates reliefs in Scotland, including breakdowns by relief, property type and local authority area, and additional information on SBBS and reliefs introduced to support businesses through the pandemic.
COVID-19 Reliefs
In 2020-21, the Scottish Government introduced two new reliefs to help businesses impacted by the COVID-19 pandemic: a 1.6% universal relief, and a 100% relief for Retail, Hospitality, Leisure, and Aviation.
The 1.6% universal relief was introduced in 2020-21 to reverse the annual poundage increase – in 2020-21 the poundage was increased from 49p to 49.8p. In 2021-22, the poundage was decreased back to 49p, and the relief was no longer awarded.
As at 1 July 2020, the value of the 1.6% universal relief was £61m, although a part of this will have been due to displacement of other reliefs.
Retail, Hospitality, Leisure, and Aviation (RHLA) relief
RHLA relief awards up to 100% relief to properties in the retail, hospitality, and leisure sectors used for specific purposes, as well as airports and aviation-related subjects, as listed in legisl[ation.6]
As at 1 June 2021, RHLA relief was awarded to 18,280 properties, with a value of £536m. This was equivalent to 7% of properties on the Valuation Roll, and 43% of the value of all reliefs.
In 2020-21, this relief was awarded automatically to eligible premises identified by local authorities. While the eligibility criteria remain the same as at the 2020 snapshot, in 2021-22, the relief requires an application to be made to the local authority, which has had several effects on the figures presented in this publication:
- A number of relief recipients have repaid the value of relief awarded in 2020-21 to the Scottish Government, with a total value of £177m as at 3 September 2021.[7] Some of these ratepayers and/or others may decide not to apply for the relief in 2021-22.
- Any awards of RHLA relief for which applications were received or processed after 1 June were not reflected in the 2021 billing snapshot. It is expected that the number of properties receiving RHLA will increase compared to the figures presented in this publication.
- There is less displacement of other reliefs by RHLA relief than there was in 2020-21. In some cases, the automatic award in 2020-21 meant that some properties receiving 100% of another relief (e.g. SBBS relief), but eligible for RHLA, were awarded RHLA relief instead of the other relief. However, ratepayers of properties already receiving 100% relief are unlikely to apply for RHLA as they would see no additional benefit.
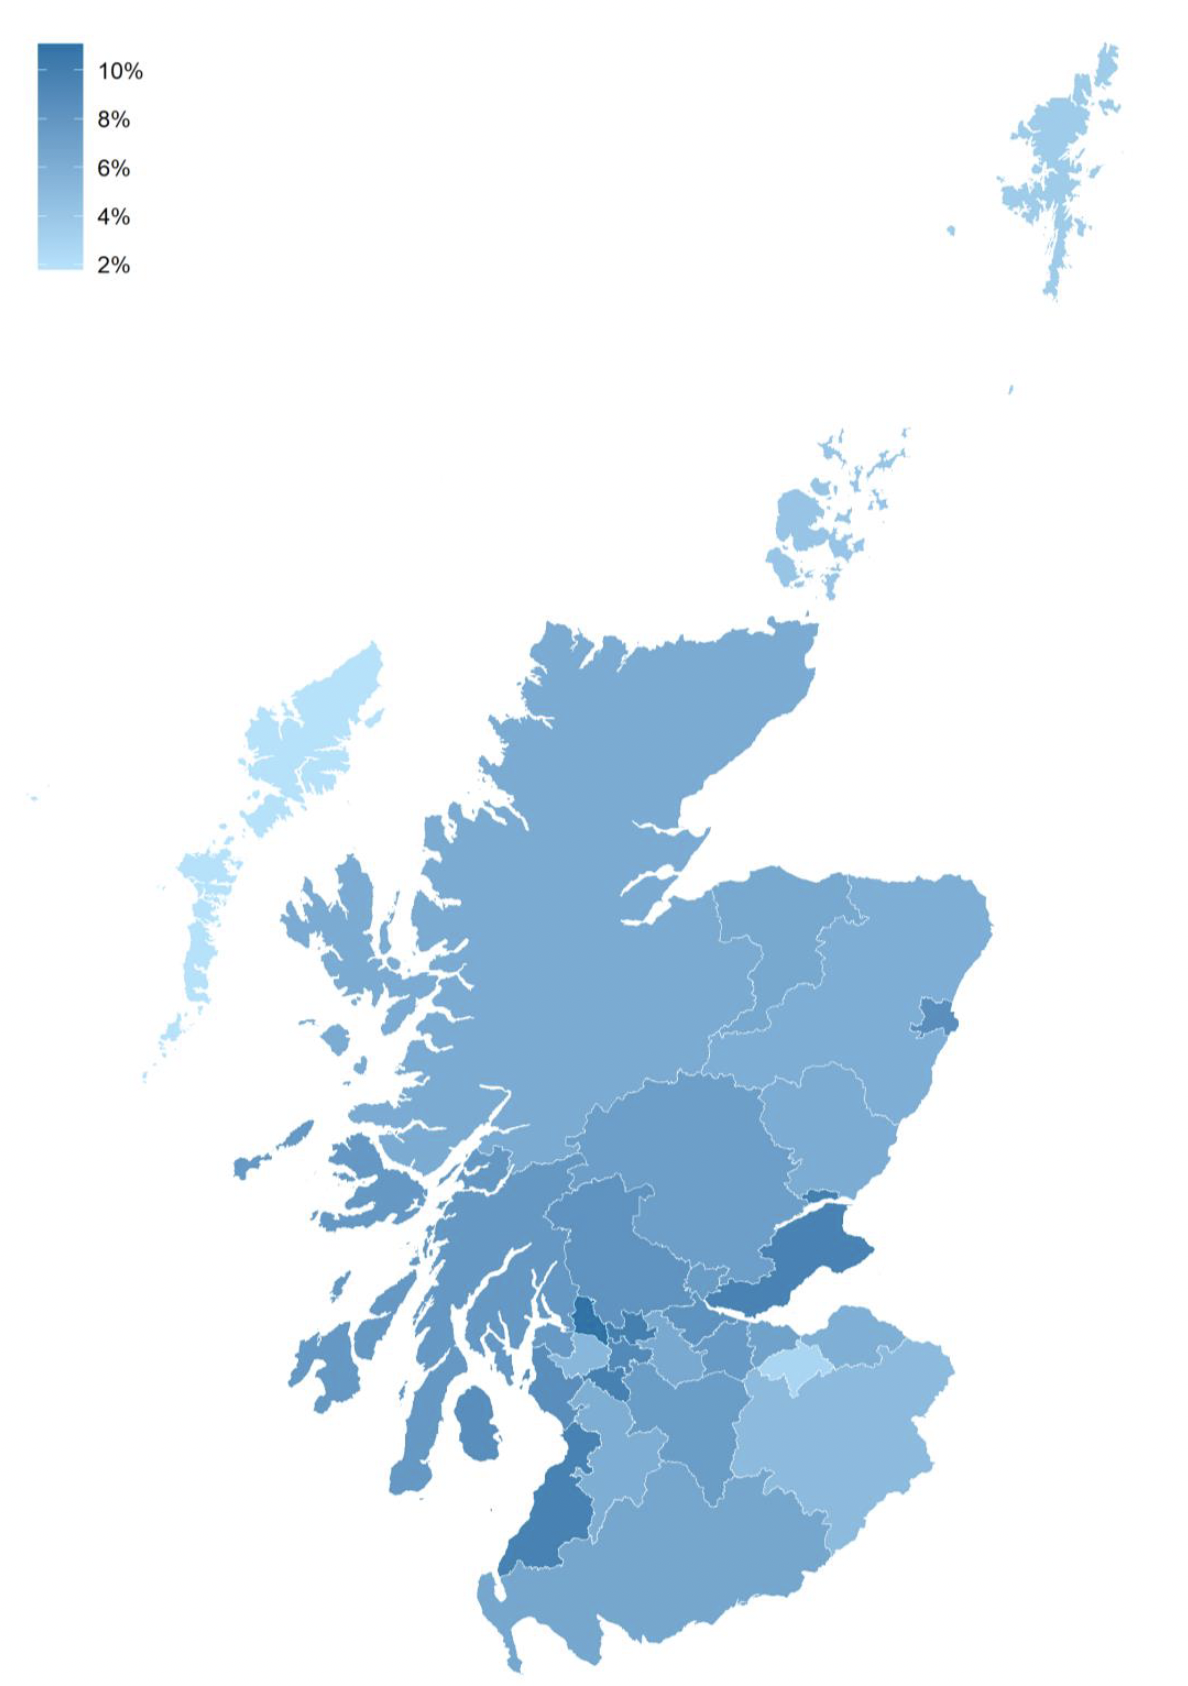
Table 9 shows the number of properties receiving RHLA relief, and its value, by local authority. The proportion of properties on the Valuation Roll receiving RHLA relief ranged from 2% in Na h-Eileanan Siar to 11% in West Dunbartonshire. RHLA relief accounted for more than 50% of the value of all reliefs in the City of Edinburgh (51%), Aberdeen City (55%), and Renfrewshire (57%). The proportion of properties within a local authority receiving RHLA relief is also presented in Map 3.
| Local Authority | Number of properties receiving RHLA relief |
Proportion of properties in each local authority receiving RHLA relief | Total value 1 (£m) of RHLA reliefs awarded | Total value 1 of RHLA reliefs as proportion of the value of all reliefs |
|---|---|---|---|---|
| Aberdeen City | 840 | 9% | 45.4 | 55% |
| Aberdeenshire | 780 | 6% | 12.6 | 32% |
| Angus | 330 | 6% | 4.6 | 27% |
| Argyll & Bute | 750 | 8% | 8.4 | 36% |
| City of Edinburgh | 1,590 | 7% | 92.7 | 51% |
| Clackmannanshire | 130 | 7% | 1.9 | 30% |
| Dumfries & Galloway | 660 | 7% | 10.3 | 39% |
| Dundee City | 590 | 10% | 17.3 | 40% |
| East Ayrshire | 280 | 6% | 6.0 | 37% |
| East Dunbartonshire | 240 | 10% | 5.4 | 42% |
| East Lothian | 220 | 6% | 4.0 | 25% |
| East Renfrewshire | 180 | 10% | 3.5 | 37% |
| Falkirk | 430 | 8% | 10.4 | 41% |
| Fife | 1,360 | 10% | 25.4 | 40% |
| Glasgow City | 2,460 | 9% | 100.9 | 46% |
| Highland | 1,240 | 6% | 26.2 | 38% |
| Inverclyde | 190 | 8% | 3.5 | 32% |
| Midlothian | 80 | 3% | 4.7 | 35% |
| Moray | 330 | 6% | 5.9 | 35% |
| Na h-Eileanan Siar | 50 | 2% | 1.0 | 17% |
| North Ayrshire | 460 | 9% | 7.9 | 35% |
| North Lanarkshire | 650 | 6% | 20.4 | 45% |
| Orkney Islands | 110 | 4% | 1.4 | 26% |
| Perth & Kinross | 690 | 7% | 16.4 | 42% |
| Renfrewshire | 520 | 5% | 25.5 | 57% |
| Scottish Borders | 420 | 5% | 6.3 | 29% |
| Shetland Islands | 80 | 4% | 1.4 | 23% |
| South Ayrshire | 520 | 10% | 13.4 | 50% |
| South Lanarkshire | 790 | 7% | 20.6 | 41% |
| Stirling | 480 | 8% | 13.6 | 47% |
| West Dunbartonshire | 330 | 11% | 5.5 | 40% |
| West Lothian | 510 | 8% | 13.5 | 44% |
| All | 18,280 | 7% | 535.7 | 43% |
Figures may not sum due to rounding. Numbers of properties or reliefs are rounded to the nearest 10. Values which are greater than zero but round down to zero are shown as "0", while actual zero values are shown as "–".
"Properties" refers to subjects listed as separate entries in the Valuation Roll, and includes shops, offices, warehouses, but also self-catering properties, properties that do not necessarily contain buildings, etc.
Reliefs reported as being awarded to zero-rated properties are excluded from this table.
The RHLA relief requires an application in 2021-22, having previously been awarded automatically.
1. The relief values are the awards given as at the snapshot date, and do not necessarily reflect the cost of a given award over the full year.
Reproduced by permission of Ordnance Survey on behalf of HMSO. © Crown copyright and database right 2021. All rights reserved. Ordnance Survey Licence number 100024655.
Contact
Email: lgfstats@gov.scot