Non-Domestic Rates Relief Statistics 2021
This publication provides statistics on the numbers of recipients and values of Non-Domestic Rates reliefs in Scotland, including breakdowns by relief, property type and local authority area, and additional information on SBBS and reliefs introduced to support businesses through the pandemic.
Non-Domestic Rates reliefs as at 1 June 2021
Numbers and types of reliefs awarded as at 1 June 2021, and comparison with 2020
A shown in Figure 1, Small Business Bonus Scheme (SBBS) relief accounted for nearly two thirds (65%) of all reliefs awarded, followed by Charity relief (11%) and Retail, Hospitality, Leisure, and Aviation (RHLA) relief (10%), and reliefs and exemptions for unoccupied properties (8%). RHLA relief however accounted for 43% of the value of all reliefs, followed by SBBS (21%) and Charity (19%) reliefs, and reliefs and exemptions for unoccupied properties (6%).
These four reliefs together accounted for 94% of all reliefs awarded, and 89% of the value of all reliefs awarded.
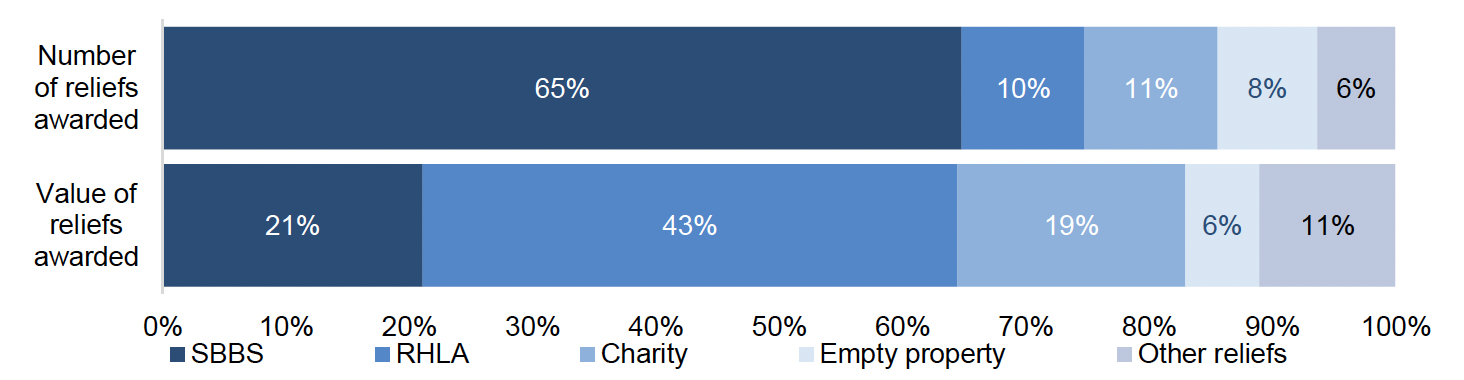
Figures may not sum due to rounding. Charity relief includes both the mandatory and discretionary elements. Empty property relief includes both reliefs and exemptions for unoccupied properties.
Table 1 shows the number of properties in receipt of relief, and the number of reliefs awarded as at the snapshot dates in both 2020 (1 July) and 2021 (1 June).
As at 1 June 2021, there were 184,250 reliefs awarded, with 172,290 properties receiving relief (some properties may be in receipt of more than one relief). More than two thirds (68%) of properties on the Valuation Roll were receiving relief.
A total of 158,790 properties (63% of properties on the Valuation Roll) were receiving 100% relief as at 1 June 2021. A majority of these (111,180, 44% of non-zero-rated properties on the Valuation Roll) were receiving SBBS relief.
The number and proportion of properties receiving relief, and the number and proportion of properties receiving 100% relief, have both decreased compared to the figures as at 1 July 2020. In 2020, 200,640 reliefs had been awarded to 186,600 properties, accounting for 74% of all properties on the Valuation Roll. 174,730 properties had been receiving 100% relief (70% of the Valuation Roll). However, the changes to SBBS and RHLA reliefs, mentioned above, will have directly affected the extent to which the 2020 and 2021 figures can be compared.
| 2020 (as at 1 July) |
2021 (as at 1 June) |
|
|---|---|---|
| Number of properties on Valuation Roll, including zero-rated properties; | 257,470 | 259,010 |
| of which non-zero-rated 1 | 250,940 | 252,430 |
| Number of properties receiving one or more reliefs 2 | 186,600 | 172,290 |
| Proportion of properties receiving one or more reliefs 2 | 74% | 68% |
| Number of properties receiving 100% relief; 3 | 174,730 | 158,790 |
| of which 100% Small Business Bonus Scheme (SBBS) relief 8 | 117,420 | 111,180 |
| of which 100% Retail Hospitality, Leisure, and Aviation (RHLA) relief 9 | 23,760 | 15,510 |
| of which 100% other relief 4 | 27,720 | 28,150 |
| of which a combination of SBBS and RHLA relief 5,8,9 | 3,290 | 1,970 |
| of which a combination of SBBS and other relief 4,8 | 1,190 | 1,180 |
| of which a combination of RHLA and other relief 4,9 | 1,360 | 800 |
| Proportion of properties receiving 100% relief; | 70% | 63% |
| of which 100% Small Business Bonus (SBBS) relief 8 | 47% | 44% |
| of which 100% RHLA relief 9 | 9% | 6% |
| of which 100% other relief 4 | 11% | 11% |
| of which a combination of SBBS and RHLA relief 5,8,9 | 1% | 1% |
| of which a combination of SBBS and other relief 4,8 | 0% | 0% |
| of which a combination of RHLA and other relief 4,9 | 1% | 0% |
| Total number of reliefs awarded 6, 7 | 200,640 | 184,250 |
Figures may not sum due to rounding. Numbers of properties or reliefs are rounded to the nearest 10. Values which are greater than zero but round down to zero are shown as "0", while actual zero values are shown as "–".
"Properties" refers to subjects listed as separate entries in the Valuation Roll, and includes shops, offices, warehouses, but also self-catering properties, properties that do not necessarily contain buildings, etc.
Reliefs reported as being awarded to zero-rated properties are excluded from this table. Except where noted otherwise.
1. Zero-rated properties are those which have their rateable values set to 0, e.g. properties under reconstruction.
2. For 2020, this excludes properties receiving only the 1.6% universal relief.
3. For 2020, '100% relief' is in effect a 98.4% relief, combined with the 1.6% universal relief awarded to every property.
4. Other reliefs include all reliefs except SBBS and RHLA relief.
5. Also includes properties receiving SBBS, RHLA, and another relief.
6. The total number of reliefs awarded is greater than the number of properties in receipt of relief as some properties receive more than one type of relief.
7. For 2020, this excludes the 1.6% universal relief.
8. Several councils undertook reviews of SBBS awards between the 2020 and 2021 awards, which may result in a lower number of recipients being reported at the 2021 snapshot.
9. The RHLA relief requires an application in 2021-22, having previously been awarded automatically.
Number, proportion and value of reliefs by relief
Table 2 shows the number, proportion and value of reliefs awarded by relief at the snapshot date in 2021. Comparable figures for 2018, 2019, and 2020 can be found in the expanded version of the table in the publication tables workbook.
The most frequently awarded relief was SBBS relief, followed by RHLA relief, Charity relief, and the reliefs and rates exemptions awarded to unoccupied properties. Combined, these reliefs accounted for 94% of all reliefs awarded as at 1 June 2021, and for 89% of the value of all reliefs. Almost seven out of ten properties on the Valuation Roll were awarded one of these four reliefs.
The total value of all reliefs awarded was £1,236m. This includes the reliefs funded both by the Scottish Government and by local authorities (which contribute 25% to the value of most discretionary reliefs they choose to award).
This is a decrease of £443m compared to the value of reliefs as at 1 July 2020, when the total was £1,679m. A significant factor in this decrease is the fact RHLA relief was made application-based in 2021-22, the value of which has decreased to £536m (a decrease of £368m compared to £904m as at 1 July 2020), so the comparability issues mentioned above should be taken into account when assessing these figures against each other.
The 2020 total also includes the 1.6% universal relief, which was awarded in 2020-21 to all properties to effectively reverse the poundage increase that year. This relief was valued at £61m as at 1 July 2020. In 2021-22, the poundage reverted to 2019-20 levels, so the universal relief was discontinued. This change did not result in higher net bills to ratepayers compared to either 2019-20 or 2020-21.
Table 2a shows the number of reliefs awarded by relief type on the snapshot dates in 2018, 2019, 2020, and 2021. It shows that in the period between 2018 and 2020, for most reliefs the number of recipients increased or remained broadly constant (note that for 2018 some reliefs are listed as 'unknown' as we are unable to determine the types from available data).
In 2021, Table 2a shows that some reliefs, notably SBBS and RHLA reliefs, have fewer recipients than they did in 2020. This is due to several reasons including fewer recipients of RHLA relief due to it being made application-based in 2021-22, and several local authorities running reviews of SBBS awards following the removal of eligibility for unoccupied properties on 1 April 2020, which may lead to reliefs being cancelled and ratepayers being required to submit a new application.
| Relief | Number of reliefs awarded | Reliefs awarded by type as a proportion of all reliefs | Proportion of all properties on the VR that receive relief | Relief value 1 (£m) |
|---|---|---|---|---|
| Small Business Bonus Scheme (SBBS) relief 2 | 119,490 | 64.8% | 47.3% | 260.8 |
| Retail, Hospitality, Leisure, and Aviation Relief (RHLA) relief 3 | 18,280 | 9.9% | 7.2% | 535.7 |
| Charity relief (mandatory and discretionary) 4 | 19,910 | 10.8% | 7.9% | 228.7 |
| Empty Property relief and exemptions | 14,920 | 8.1% | 5.9% | 74.3 |
| Religious exemptions | 4,580 | 2.5% | 1.8% | 27.2 |
| Rural relief (mandatory and discretionary) 4 | 2,170 | 1.2% | 0.9% | 3.9 |
| Disabled Rates relief | 1,930 | 1.0% | 0.8% | 64.0 |
| Sports Club relief (mandatory and discretionary) 4 | 1,380 | 0.7% | 0.5% | 13.0 |
| Day Nursery relief | 740 | 0.4% | 0.3% | 9.5 |
| Renewable Energy relief | 300 | 0.2% | 0.1% | 6.7 |
| Business Growth Accelerator (BGA) relief | 160 | 0.1% | 0.1% | 8.5 |
| Fresh Start relief | 160 | 0.1% | 0.1% | 1.9 |
| Lighthouse relief | 150 | 0.1% | 0.1% | 0.4 |
| Enterprise Areas relief | 100 | 0.1% | 0.0% | 0.7 |
| District Heating relief | 20 | 0.0% | 0.0% | 0.4 |
| Transitional relief 5 | 0 | 0.0% | 0.0% | 0.0 |
| Mobile Masts relief | 0 | 0.0% | 0.0% | 0.0 |
| Hardship relief 4 | - | - | - | - |
| Community Empowerment Act relief 4 | - | - | - | - |
| New Fibre relief | - | - | - | - |
| Stud Farms relief 4 | - | - | - | - |
| All reliefs | 184,250 | 100.0% | 73.4% | 1,235.5 |
Figures may not sum due to rounding. Numbers of properties or reliefs are rounded to the nearest 10. Values which are greater than zero but round down to zero are shown as "0", while actual zero values are shown as "–".
"Properties" refers to subjects listed as separate entries in the Valuation Roll, and includes shops, offices, warehouses, but also self-catering properties, properties that do not necessarily contain buildings, etc.
Reliefs reported as being awarded to zero-rated properties are excluded from this table.
1. The relief values are the awards given as at the snapshot date, and do not necessarily reflect the cost of a given award over the full year.
2. Several councils undertook reviews of SBBS awards between the 2020 and 2021 awards, which may result in a lower number of recipients being reported at the 2021 snapshot.
3. The RHLA relief requires an application in 2021-22, having previously been awarded automatically.
4. The value of discretionary reliefs includes both the Scottish Government's contribution and the councils' own contribution to the cost. Other published data on reliefs includes only the Scottish Government's contribution to the costs of reliefs.
5. In 2020 and 2021, hospitality properties are eligible for the RHLA relief, which cannot be combined with transitional relief. This has led to a significant decrease in the number of properties awarded transitional relief.
| Relief type | 1 June 2018 | 31 May 2019 | 1 July 2020 | 1 June 2021 |
|---|---|---|---|---|
| Small Business Bonus Scheme (SBBS) relief 1 | 113,940 | 120,420 | 125,980 | 119,490 |
| Retail, Hospitality, Leisure, and Aviation Relief (RHLA) relief 2 | 28,400 | 18,280 | ||
| Charity relief | 20,320 | 20,630 | 20,370 | 19,910 |
| Empty Property relief and exemptions | 15,380 | 15,340 | 14,060 | 14,920 |
| Religious exemptions | 4,810 | 4,760 | 4,570 | 4,580 |
| Rural relief | 2,280 | 2,280 | 2,210 | 2,170 |
| Disabled Rates relief | 2,040 | 2,000 | 1,930 | 1,930 |
| Sports Club relief | 1,560 | 1,760 | 1,510 | 1,380 |
| Day Nursery relief 3 | unknown | 700 | 730 | 740 |
| Renewable Energy relief | 110 | 290 | 230 | 300 |
| Business Growth Accelerator (BGA) relief 4 | unknown | 300 | 240 | 160 |
| Fresh Start relief | 40 | 210 | 160 | 160 |
| Lighthouse relief 5 | unknown | 60 | 150 | 150 |
| Enterprise Areas relief | 100 | 80 | 100 | 100 |
| District Heating relief | 10 | 10 | 10 | 20 |
| Transitional relief 3,6 | unknown | 850 | 0 | 0 |
| Mobile Masts relief 5 | unknown | - | 0 | 0 |
| Hardship relief | - | - | - | - |
| Community Empowerment Act relief 5 | unknown | 60 | - | - |
| New Fibre relief 7 | 20 | - | - | |
| Stud Farms relief | - | - | - | - |
| New Start relief | 10 | - | ||
| Unknown relief 8 | 650 | - | ||
| All reliefs (excluding 1.6% universal relief for 2020) | 161,220 | 169,760 | 200,640 | 184,250 |
Figures may not sum due to rounding. Numbers of properties or reliefs are rounded to the nearest 10. Values which are greater than zero but round down to zero are shown as "0", while actual zero values are shown as "–".
"Properties" refers to subjects listed as separate entries in the Valuation Roll, and includes shops, offices, warehouses, but also self-catering properties, properties that do not necessarily contain buildings, etc.
Reliefs reported as being awarded to zero-rated properties are excluded from this table.
1. Several councils undertook reviews of SBBS awards between the 2020 and 2021 awards, which may result in a lower number of recipients being reported at the 2021 snapshot.
2. The RHLA relief requires an application in 2021-22, having previously been awarded automatically.
3. The majority of councils were not able to report transitional relief and nursery relief recipients at the 2018 snapshot date, mainly due to software limitations. These figures have been excluded.
4. Although BGA relief was introduced on 1 April 2018, no BGA recipients were reported in the 2018 snapshot due to software issues and few applications having been received by 1 June 2018.
5. In the 2018 snapshot, Community Empowerment Act reliefs, lighthouse relief, and mobile mast reliefs were not separately identified and were all included within the unknown relief row.
6. In 2020 and 2021, hospitality properties are eligible for the RHLA relief, which cannot be combined with transitional relief. This has led to a significant decrease in the number of properties awarded transitional relief.
7. New Fibre relief was introduced on 1 April 2019.
8. In the 2018 snapshot some councils were unable to provide the required information to assign a relief type to some of the awards they reported, or the Scottish Government did not request these separately. "Unknown relief" includes Community Empowerment Act reliefs, lighthouse reliefs, mobile masts reliefs and any other relief award that was not recorded with a separate relief code.
Reliefs awarded by Local Authority
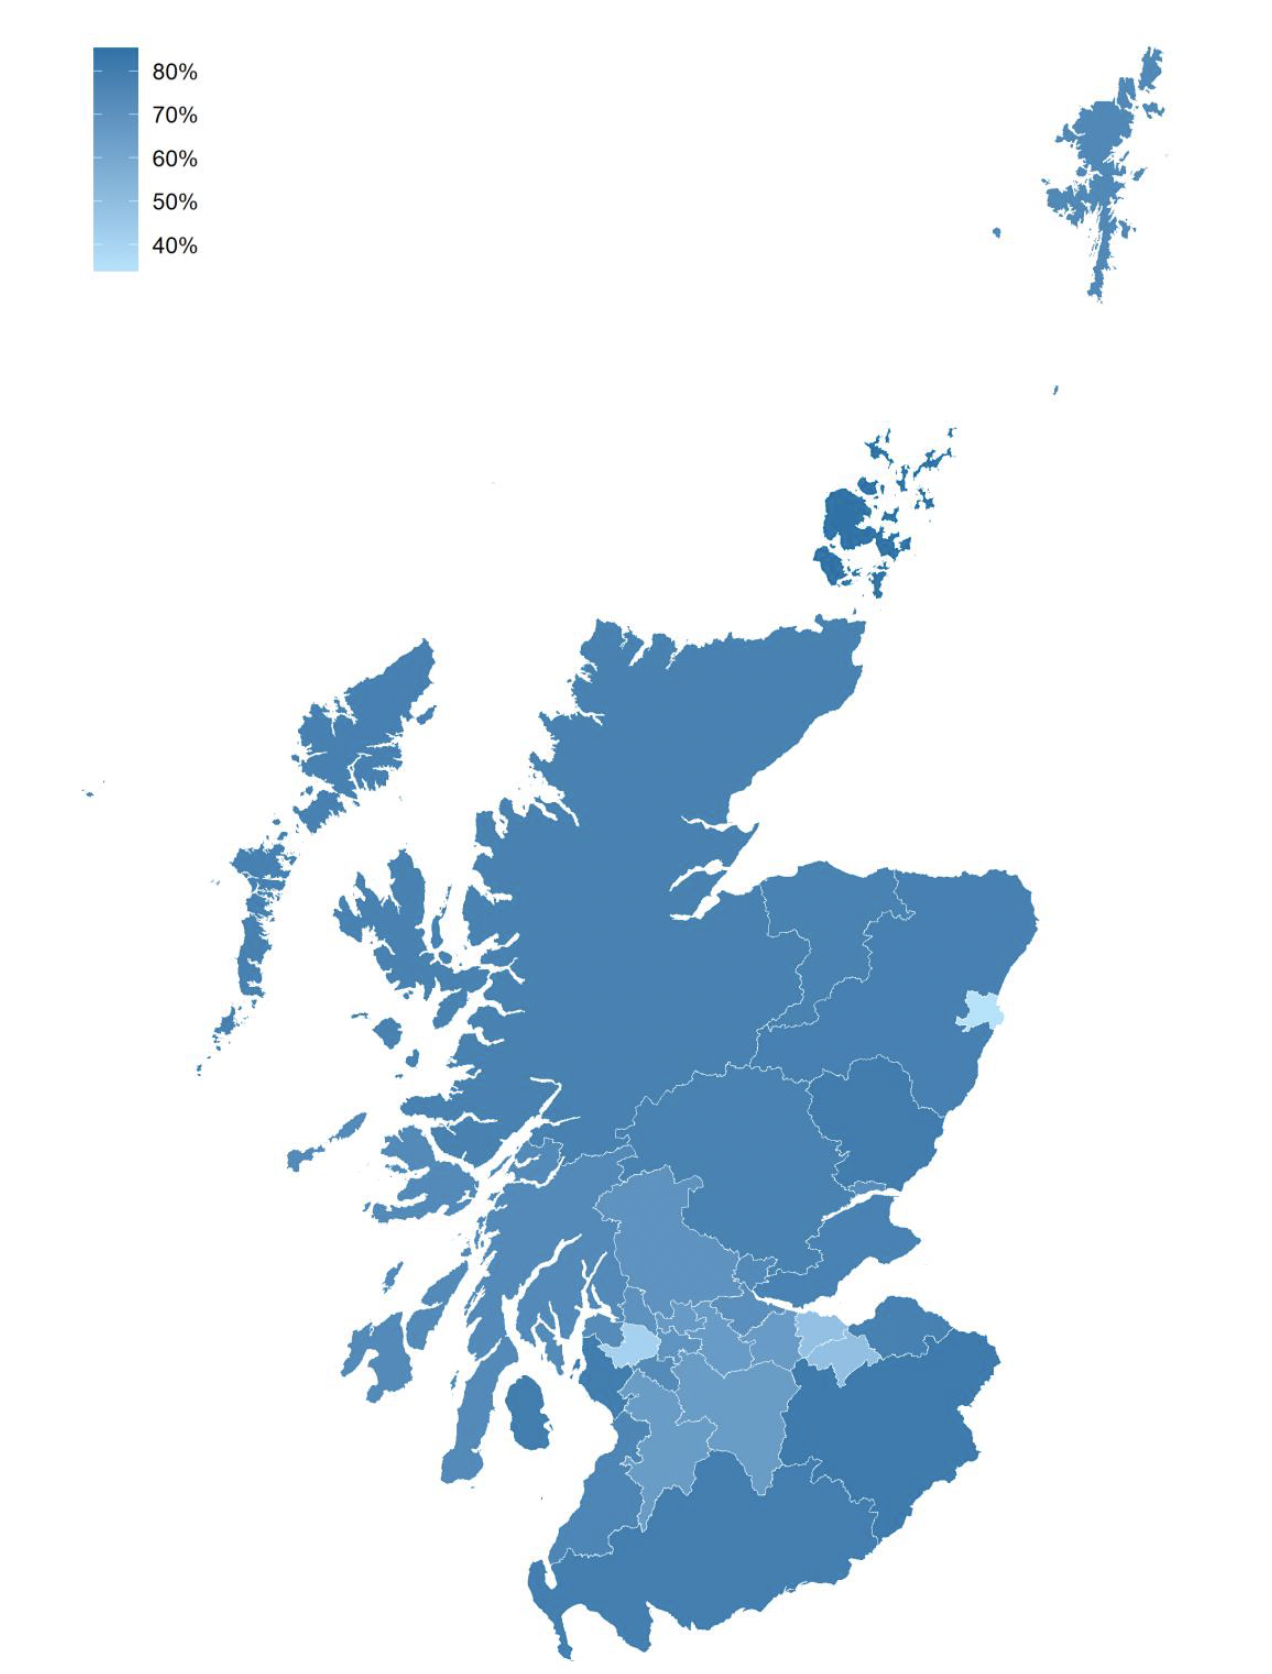
Table 3 shows the number and proportion of properties in receipt of relief, the relief value and the proportion of gross bills in receipt of relief, by local authority, at the snapshot date in 2021. Comparable figures for 2018, 2019, and 2020 can be found in the expanded version of the table in the publication tables workbook. Map 1 presents the proportion of properties in each local authority receiving relief.
More than two thirds (68%) of all properties on the Valuation Roll were receiving a relief as at 1 June 2021 – this compares with 74% as at 1 July 2020. In thirteen local authorities, more than three quarters of all properties were in receipt of a relief; the highest proportions of properties receiving relief were in Orkney (85%) and the Scottish Borders (81%), while the lowest could be found in Aberdeen City (34%) and Renfrewshire (41%).
The value of reliefs, and the number of properties receiving relief, have decreased in most local authorities. This is primarily due to fewer ratepayers claiming RHLA relief (as at 1 June 2021) than as at 1 July 2020, when it had been awarded automatically to a large majority of eligible properties, as well as due to the lower poundage, and in some local authorities due to reviews of SBBS awards.
Across Scotland, the value of reliefs decreased by 26%, and the number of properties receiving relief by 8%, compared to the figures as at 1 July 2020.[4]
The value of reliefs has decreased in all local authorities, primarily due to the £368m decrease in the value of RHLA relief. Most local authorities also saw a decrease in the number of properties receiving relief compared to 1 July 2020.
In total, reliefs accounted for more than two thirds (37%) of the total gross bill for all non-domestic properties excluding designated utilities. This is a decrease compared to 49% in 2020, but still significantly above the 22% as at 31 May 2019 (as shown in the expanded version of Table 3 in the publication tables workbook), the latter difference being largely as a result of RHLA relief in 2020-21 and 2021-22.
A detailed breakdown of the number of reliefs awarded for each relief and local authority is available in table A in the additional tables workbook.
| Local Authority | Number of properties receiving one or more reliefs | Proportion of properties receiving one or more reliefs | Value 1 (£m) of all reliefs | Total value of reliefs as a proportion of total gross bill 1, 2 for all properties on the Valuation Roll |
|---|---|---|---|---|
| Aberdeen City | 3,310 | 34% | 83.0 | 28% |
| Aberdeenshire | 10,280 | 78% | 39.2 | 26% |
| Angus | 4,300 | 80% | 17.1 | 42% |
| Argyll & Bute | 7,070 | 73% | 23.4 | 42% |
| City of Edinburgh | 11,060 | 48% | 181.8 | 38% |
| Clackmannanshire | 1,230 | 74% | 6.2 | 29% |
| Dumfries & Galloway | 7,980 | 79% | 26.4 | 37% |
| Dundee City | 4,220 | 72% | 42.8 | 45% |
| East Ayrshire | 2,990 | 65% | 16.2 | 39% |
| East Dunbartonshire | 1,590 | 66% | 13.0 | 39% |
| East Lothian | 2,950 | 78% | 16.2 | 40% |
| East Renfrewshire | 1,330 | 73% | 9.4 | 45% |
| Falkirk | 3,750 | 71% | 25.3 | 28% |
| Fife | 10,910 | 77% | 63.8 | 40% |
| Glasgow City | 18,970 | 69% | 221.7 | 44% |
| Highland | 15,640 | 78% | 68.7 | 41% |
| Inverclyde | 1,770 | 73% | 11.0 | 40% |
| Midlothian | 1,500 | 49% | 13.6 | 31% |
| Moray | 4,020 | 77% | 16.9 | 26% |
| Na h-Eileanan Siar | 2,190 | 78% | 5.7 | 42% |
| North Ayrshire | 4,290 | 80% | 22.3 | 39% |
| North Lanarkshire | 6,770 | 66% | 45.2 | 31% |
| Orkney Islands | 2,210 | 85% | 5.3 | 36% |
| Perth & Kinross | 7,470 | 77% | 39.3 | 48% |
| Renfrewshire | 4,100 | 41% | 44.5 | 42% |
| Scottish Borders | 7,030 | 81% | 22.1 | 42% |
| Shetland Islands | 1,760 | 75% | 6.1 | 20% |
| South Ayrshire | 4,080 | 76% | 26.9 | 46% |
| South Lanarkshire | 6,920 | 65% | 49.6 | 31% |
| Stirling | 4,130 | 69% | 28.6 | 46% |
| West Dunbartonshire | 2,110 | 70% | 13.6 | 36% |
| West Lothian | 4,360 | 66% | 30.6 | 30% |
| Scotland | 172,290 | 68% | 1,235.5 | 37% |
Figures may not sum due to rounding. Numbers of properties or reliefs are rounded to the nearest 10. Values which are greater than zero but round down to zero are shown as "0", while actual zero values are shown as "–". "Properties" refers to subjects listed as separate entries in the Valuation Roll, and includes shops, offices, warehouses, but also self-catering properties, properties that do not necessarily contain buildings, etc. Reliefs reported as being awarded to zero-rated properties are excluded from this table. The RHLA relief requires an application in 2021-22, having previously been awarded automatically. The total number of reliefs awarded is more than the number of relief recipients as some properties can receive more than one relief. Tables A and D in the additional tables workbook show the number and value of reliefs awarded by relief and local authority.
1. The relief values are the awards given as at the snapshot date, and do not necessarily reflect the cost of a given award over the full year. The value of discretionary reliefs includes both the Scottish Government's contribution and the councils' own contribution to the cost.
2. The gross bills exclude designated utility entries which were not in receipt of relief as at the snapshot dates, as these would distort the proportions for those local authorities that have responsibility for designated utilities.
Reproduced by permission of Ordnance Survey on behalf of HMSO. © Crown copyright and database right 2021. All rights reserved. Ordnance Survey Licence number 100024655.
Reliefs awarded by Property Class
Table 4 shows the proportion of properties within each property class receiving a relief, and the value of those reliefs.
Property classes closely linked to the RHLA sectors, such as hotels, public houses, shops, and leisure and entertainment properties continue to have high proportions of properties receiving relief, although the proportions are lower than they were as at 1 July 2020. The lowest proportions of properties receiving reliefs were in advertising properties, and those in the petrochemicals industry.
It should be noted that the eligibility for RHLA relief is defined by use of property,[5] whereas the property class is the Scottish Assessors' description of the type of property – it is therefore possible that, for example, a property listed as a 'shop' was used to provide financial services and was therefore not eligible for RHLA relief.
Table B in the additional tables workbook shows the breakdown of the number of reliefs by property class and relief, while Table E in the same workbook shows the values of those reliefs.
| Property Class | 1 June 2021 | |
|---|---|---|
| Proportion of properties in each class receiving one or more reliefs | Relief value 1 (£m) |
|
| Advertising | 7% | 0.1 |
| Care Facilities | 84% | 54.2 |
| Communications | 15% | 0.1 |
| Cultural | 90% | 25.5 |
| Education and Training | 34% | 84.4 |
| Garages and Petrol Stations | 77% | 18.5 |
| Health and Medical | 52% | 21.2 |
| Hotels | 80% | 115.3 |
| Industrial Subjects | 62% | 106.4 |
| Leisure, Entertainment, Caravans, etc. | 91% | 124.5 |
| Offices | 57% | 107.2 |
| Other | 44% | 16.2 |
| Petrochemical | 7% | 0.2 |
| Public Houses | 82% | 46.9 |
| Public Service Subjects | 58% | 60.0 |
| Quarries, Mines, etc. | 32% | 0.4 |
| Religious | 86% | 25.4 |
| Shops | 79% | 411.1 |
| Sporting Subjects | 76% | 11.6 |
| Statutory Undertaking | 33% | 6.4 |
| All | 68% | 1,235.5 |
Figures may not sum due to rounding. Numbers of properties or reliefs are rounded to the nearest 10. Values which are greater than zero but round down to zero are shown as "0", while actual zero values are shown as "–".
"Properties" refers to subjects listed as separate entries in the Valuation Roll, and includes shops, offices, warehouses, but also self-catering properties, properties that do not necessarily contain buildings, etc.
Reliefs reported as being awarded to zero-rated properties are excluded from this table.
Several councils undertook reviews of SBBS awards between the 2020 and 2021 awards, which may result in a lower number of recipients being reported at the 2021 snapshot.
The RHLA relief requires an application in 2021-22, having previously been awarded automatically.
Tables B and E in the additional tables workbook show the number and value of reliefs awarded by relief and property class.
Property class is a classification used by the Scottish Assessors to describe the type of a property, and may not accurately reflect its use. For example, a property classified as a 'shop' may in fact be used to offer financial services.
1. The relief values are the awards given as at the snapshot date, and do not necessarily reflect the cost of a given award over the full year. The value of discretionary reliefs includes both the Scottish Government's contribution and the councils' own contribution to the cost. Other published data on reliefs includes only the Scottish Government's contribution to the costs of reliefs.
Properties receiving 100% relief
Most properties receiving relief as at 1 June 2021 were in receipt of 100% relief: 158,790 properties received reliefs which either alone, or through a combination of several reliefs, amounted to 100% of the gross bill. This accounts for 92% of all properties receiving reliefs, or 63% of all non-zero-rated properties on the Valuation Roll.
The value of reliefs awarded to properties receiving 100% relief was £1,117m, which is 90% of the value of all reliefs.
Table 5 shows the number of properties receiving 100% relief, and the value of all reliefs awarded to those properties, as at 1 June 2021. Due to the need for applications where there was none last year (for RHLA relief, and for SBBS where reviews took place), and the timing of the billing snapshot, these figures are likely to underestimate the actual number of properties receiving 100% relief in 2021-22, and the value of those reliefs. Applications may be received after the snapshot date, and reliefs awarded and backdated to the start of eligibility.
| Local Authority | Number of properties receiving 100% relief | Value 1 of reliefs awarded to properties receiving 100% relief (£m) |
|---|---|---|
| Aberdeen City | 2,790 | 72.1 |
| Aberdeenshire | 9,490 | 36.8 |
| Angus | 4,030 | 16.4 |
| Argyll & Bute | 6,800 | 22.1 |
| City of Edinburgh | 9,250 | 150.7 |
| Clackmannanshire | 1,060 | 5.4 |
| Dumfries & Galloway | 7,630 | 25.0 |
| Dundee City | 3,850 | 38.0 |
| East Ayrshire | 2,850 | 15.6 |
| East Dunbartonshire | 1,510 | 12.5 |
| East Lothian | 2,760 | 14.3 |
| East Renfrewshire | 1,270 | 9.2 |
| Falkirk | 3,500 | 24.4 |
| Fife | 10,100 | 58.4 |
| Glasgow City | 16,920 | 199.6 |
| Highland | 14,730 | 63.5 |
| Inverclyde | 1,640 | 10.2 |
| Midlothian | 1,280 | 10.1 |
| Moray | 3,720 | 14.2 |
| Na h-Eileanan Siar | 2,110 | 5.4 |
| North Ayrshire | 3,980 | 20.8 |
| North Lanarkshire | 6,150 | 43.4 |
| Orkney Islands | 2,140 | 5.3 |
| Perth & Kinross | 6,990 | 35.3 |
| Renfrewshire | 3,760 | 42.3 |
| Scottish Borders | 6,640 | 20.9 |
| Shetland Islands | 1,680 | 5.9 |
| South Ayrshire | 3,840 | 25.2 |
| South Lanarkshire | 6,540 | 46.9 |
| Stirling | 3,960 | 25.9 |
| West Dunbartonshire | 1,980 | 12.8 |
| West Lothian | 3,830 | 28.9 |
| Scotland | 158,790 | 1,117.1 |
Figures may not sum due to rounding. Numbers of properties or reliefs are rounded to the nearest 10. Values which are greater than zero but round down to zero are shown as "0", while actual zero values are shown as "–".
"Properties" refers to subjects listed as separate entries in the Valuation Roll, and includes shops, offices, warehouses, but also self-catering properties, properties that do not necessarily contain buildings, etc.
Reliefs reported as being awarded to zero-rated properties are excluded from this table.
Several councils undertook reviews of SBBS awards between the 2020 and 2021 awards, which may result in a lower number of recipients being reported at the 2021 snapshot.
The RHLA relief requires an application in 2021-22, having previously been awarded automatically.
Table includes all non-zero-rated properties for which reliefs in any combination resulted in a 100% reduction in non-domestic rates bills.
1. The relief values are the awards given as at the snapshot date, and do not necessarily reflect the cost of a given award over the full year. 100% reliefs may include discretionary reliefs, the value of which reliefs includes both the Scottish Government's contribution and the councils' own contribution.
Contact
Email: lgfstats@gov.scot