National Islands Plan Survey: final report
This report presents the findings from the National Islands Plan Survey. The research explores perceptions of island life in relation to the strategic objectives set out in the National Islands Plan.
2. Methodology
A large proportion of the island population is situated in a small number of islands, and there are many islands with very low or zero population. Nine subregions were defined, and used to calculate the sample, based on the combination of subregion, gender and age group.
The final sample therefore covered the maximum number of islands possible, with clear consideration of representativeness based on age group, gender and subregion (18 to 75) population.
20,000 surveys were sent to 76 individual islands. 4,347 people responded to the survey, with an overall response rate of 22%.
Responses have been weighted based on population structure, to ensure representativeness.
An important aim of the survey was to gather responses from as many permanently inhabited islands as possible, and to reach a representative sample of adult residents (aged 18 and over) in terms of age, gender and island group. The survey only targeted island residents and excluded users of holiday or second homes who are resident elsewhere.
The survey was sent to 20,000 island residents in October 2020 and asked about their perceptions of aspects of island life, including population levels, economic development, transport, housing, fuel poverty, digital connectivity, health and social care, environmental wellbeing, community empowerment, and culture and education. Respondents could complete the survey by post, online or by phone, and in English or Gaelic. The survey was formally open until 23 November 2020 but responses continued to arrive throughout December. All responses received until 4 January 2021 have been included in the analysis.
4,347 people responded to the survey (4,147 or 95% by post, 3 or 0.1% by phone and 197 or 5% online including 7 in Gaelic). This report summarises the main findings. More detailed summary data will be available through a publicly accessible online tool, to be launched in July 2021.
2.1 The survey framework: subregions and sampling design
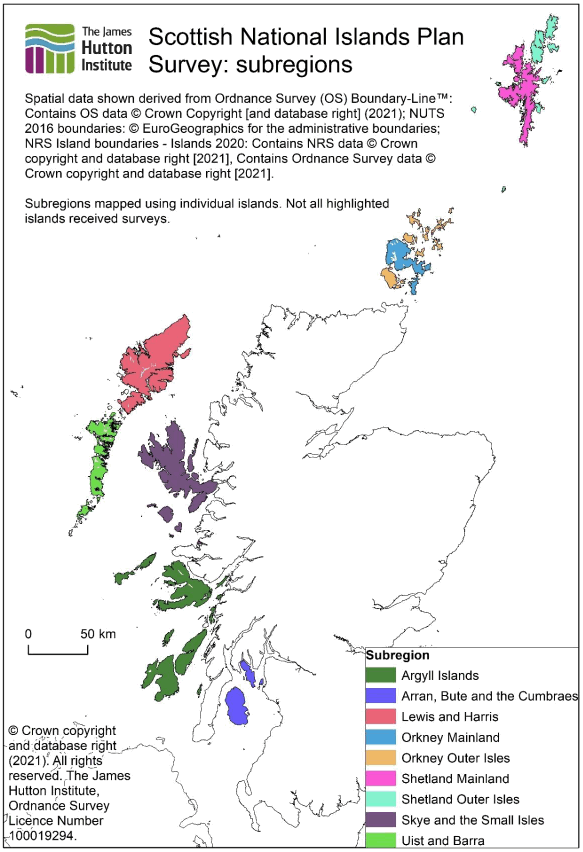
The geography of the Scottish islands is complex and presents challenges for conducting social research. A large proportion of the island population is situated in a small number of islands, and there are many islands with very low or zero population. Furthermore, the sparse population of the region creates issues in acquiring data on the location of people and demographic characteristics. An important part of the survey framework was the definition of a set of custom island-based subregions – appropriate geographical groupings of islands allowing for an understanding of spatial differences in characteristics and perceptions. The following is a simplified description of the sampling process.
1. The Scottish Postcode Directory, produced by National Records of Scotland (NRS), contains an index of information on 'small user' postcodes, and parts of split postcodes. This, and other NRS data (Census Indexes, Geography metadata from the postcode directory, and information on the recent 'Islands 2020' definition) were used to identify postcodes or parts of split postcodes which were a) in the six council areas of interest (that is, Argyll and Bute, Na h-Eileanan Siar, Highland, North Ayrshire, Orkney Islands and Shetland Islands), b) not located on the Scottish mainland, or on islands on mainland lochs, and c) active (not deleted) and either populated in the 2011 Census, or introduced in 2011 or after. The resulting list of postcodes provided a proxy for the location of people on islands in 2020. The lookups to and between other geographies (including NRS Island Groups, based on Output Areas and used for reporting 2011 Census data), and 'Islands 2020' - individual islands identified by NRS in 2020) formed the basis of the subregion definition and sampling.
2. A lookup between Census Output Areas and Island Groups was used to create draft subregions for consideration by the Research Advisory Group[1]. Suggested changes included the re-definition of the Orkney and Shetland subregions to group 'connected' islands with the Mainland islands.
3. The final series of subregions were then produced (Table 1 and Map 1, below). For local authorities outside of Orkney and Shetland, subregions were based on Island Groups which contained potentially populated postcodes. In Orkney and Shetland, to ensure an accurate division between the 'Mainland and connected' and outer islands, subregions were based on individual islands containing postcodes which may be populated. Spatial data - NRS Island boundaries and Ordnance Survey data - were used to define the Orkney and Shetland subregions.
4. A list of potentially populated postcodes was provided to Experian, who produced a list of over 24,000 names and addresses with accompanying gender and age group data for each person. Experian do not hold the names and addresses of people aged over 75, meaning that the 18 to 75 population was used for the survey sample.
5. Lookups, population totals and demographic characteristics were calculated for sampling, partly using Census 2011 data. For each individual island, a lookup to the appropriate subregion, the total population of the island (based on postcode-level data), and the estimated population aged 18 to 75 were produced. For each subregion, the total population and 18 to 75 population were calculated and adjusted, and the population structure (the proportions of the 18 to 75 population within eight cohorts defined by age group and gender) were calculated.
6. The total number of surveys required for each subregion was calculated, based on 20,000 surveys being distributed in proportion to the 18 to 75 population size within each subregion, and the number of surveys required for each demographic cohort was then calculated using the population structure information. The resulting 72 totals of surveys for combinations of subregion, gender and age group represent 'targets' for a representative, stratified sample.
| Island Group | Island |
|---|---|
| Argyll Islands | Coll, Colonsay, Easdale, Gometra, Iona, Islay, Isle of Gigha, Isle of Mull, Jura, Kerrera, Lismore, Luing, Oronsay, Seil, Tiree, Ulva |
| Arran, Bute and the Cumbraes | Bute, Great Cumbrae Island, Isle of Arran |
| Lewis and Harris | Great Bernera, Isle of Lewis and Harris, Scalpay |
| Orkney Mainland | Burray, Mainland of Orkney, South Ronaldsay |
| Orkney Outer Isles | Eday, Egilsay, Flotta, Graemsay, Hoy, North Ronaldsay, Papa Stronsay, Papa Westray, Rousay, Sanday, Shapinsay, Stronsay, Westray, Wyre |
| Shetland Mainland | East Burra, Mainland of Shetland, Muckle Roe, Trondra, West Burra |
| Shetland Outer Isles | Bressay, Bruray, Fair Isle, Fetlar, Foula, Housay, Papa Stour, Unst, Whalsay, Yell |
| Skye and the Small Isles | Canna, Eigg, Eilean Tioram, Isle of Ewe, Isle of Raasay, Isle of Skye, Muck, Rona, Rùm, Sanday, Soay |
| Uist and Barra | Baleshare, Barra, Benbecula, Berneray (North Uist), Eriskay, Grimsay (North), Grimsay (South), North Uist, South Uist, Sunamul, Vatersay |
7. The table of names, addresses and age group and gender data from Experian were joined to the individual island and subregions using the partially populated postcodes, following manual checks of some postcodes against OS and web mapping. Finally, 23,990 names, addresses and data were available for sampling.
8. Names and addresses were selected for sampling based on the individual island they were located on, and the combination of subregion, gender and age group noted above – before the sample selection, these combined cohorts were calculated for each name and address and the total number of names and addresses within each cohort was identified. However, to ensure that surveys reached all possible islands (76), and to increase the likelihood of responses from smaller/less populated islands, the individual islands were considered first. Firstly, for islands where less than 10 names and addresses were available, all names and addresses were included in the sample (based on the assumption of a 10% response rate). Secondly, we calculated the expected number of surveys that would be delivered to each island if surveys were distributed evenly, given that a sample size of 20,000 represents around 27% of the island population aged 18 to 75. Where this number was below 20 we sampled all available names and addresses as in these cases there was a significant risk that we would not receive any responses given that we expected the response rate may be as low as 10%. The subregion, gender and age group cohorts of names/addresses sampled in these first two steps were subtracted from the initial totals, and the third stage of the sampling process used these cohorts.
9. For each of the 72 cohorts, if the number of available names and addresses was below its 'target' for a representative, stratified sample in the sampling frame, all names and addresses associated with that cohort were sampled. If the number of names and addresses was above the target then a random sample of these was taken. The fourth and final stage of the sampling involved a comparison across the subregions of all names and addresses sampled in the first three stages, with the target number for each subregion (based on 20,000 surveys distributed to the nine subregions in proportion to the size of the 18 to 75 population). Names and addresses were randomly sampled from those remaining as a 'top up' based on the numbers required to meet the nine subregion targets and the subregions of the remaining names and addresses. These stages produced a sample of 20,009 names and addresses: nine within the Uists and southern islands were removed at random as that subregion was over-sampled relative to its target number of surveys.
The final sample of 20,000 names and addresses therefore covered the maximum number of islands possible, with clear consideration of representativeness based on age group, gender and subregion (18 to 75) population. A random, unique five-digit ID number was added to each name and address in the final sample. This was included on the cover of paper surveys, and online survey forms contained an input field for this value, which enabled survey responses to be joined to the individual island and subregion information.
2.2 Who responded to the survey?
The data sets containing returned paper questionnaires and online questionnaires were cleaned and combined. The cleaning task involved checking numeric responses and ID values, checking for duplicate IDs, flagging invalid survey responses, considering informed consent on online surveys and calculating new variables for 'tick all that apply' questions. The sampling information, including individual islands and subregions, was joined to the survey responses using the ID.
Following cleaning and combination of postal and online questionnaire survey data sets, the final data set contained 4,372 cases. Of these, 25 surveys contained no valid responses to any survey question (that is, questions 1 to 46, excluding the ID, consent information and comments). If these are excluded, the overall response rate is 22% from 20,000 distributed questionnaires. Response rates to the individual questions varied, and the full data available for each question is used to produce the summary statistics in this report.
The age and gender of survey respondents are summarised below, alongside the number of responses received from the nine subregions. Although the sample targeted people aged 18 to 75, 141 responses were received from people aged 76 or older. The mean age of a respondent was 56.1 years old (range: 18 to 98, n = 4,339). Compared with the characteristics of the survey sample, people aged 51 to 65 and 66 to 75 are over-represented in the survey responses, and younger people are under-represented: the estimated response rate increases with age. The survey respondents were relatively balanced in terms of gender, with a slightly higher proportion of women (54%). The response rates by subregion show some variation, with particularly high response rates in the Argyll Islands and Orkney and Shetland Outer Isles.
| Survey sample (20,000 surveys) | Survey responses (n = 4,347) | Estimated group response rate | ||||
|---|---|---|---|---|---|---|
| Variable | Group | n | % (1 d.p.) | n | % (1 d.p.) | % (1 d.p.) |
| Age | 18 to 35 | 4256 | 21.3 | 492 | 11.3 | 11.6 |
| 36 to 50 | 5688 | 28.4 | 893 | 20.6 | 15.7 | |
| 51 to 65 | 6519 | 32.6 | 1617 | 37.3 | 24.8 | |
| 66 to 75 | 3537 | 17.7 | 1196 | 27.6 | 33.8 | |
| 76 and over | 141 | 3.2 | ||||
| Gender* | Female | 10086 | 50.4 | 2341 | 54.0 | 23.2 |
| In another way | 2 | 0.0 | ||||
| Male | 9914 | 49.6 | 1978 | 45.6 | 20.0 | |
| Prefer not to say | 15 | 0.3 | ||||
| Island group | Argyll Islands | 1677 | 8.4 | 440 | 10.1 | 26.2 |
| Arran, Bute and the Cumbraes | 2409 | 12.0 | 585 | 13.5 | 24.3 | |
| Skye and the Small Isles | 2038 | 10.2 | 449 | 10.3 | 22.0 | |
| Lewis and Harris | 4117 | 20.6 | 830 | 19.1 | 20.2 | |
| Orkney Mainland | 3586 | 17.9 | 630 | 14.5 | 17.6 | |
| Orkney Outer Isles | 549 | 2.7 | 160 | 3.7 | 29.1 | |
| Shetland Mainland | 3799 | 19.0 | 805 | 18.5 | 21.2 | |
| Shetland Outer Isles | 632 | 3.2 | 179 | 4.1 | 28.3 | |
| Uist and Barra | 1193 | 6.0 | 269 | 6.2 | 22.5 | |
* For the survey sample, these are based on information provided by Experian. For the survey responses, these are the values given or responses selected in the survey.
In addition to the subregion-level response breakdown, surveys were posted to 76 individual islands, the highest number of islands possible from available names and addresses. Surveys with valid responses were received from 59 islands, showing success in survey distribution at this level. The largest four islands by total population (Lewis and Harris, the Mainland islands of Orkney and Shetland, and Skye and Highland Islands) had 65% of the population of all 76 sampled islands, received 65% of all surveys, and 60% of all returned surveys were from these four islands, collectively. Survey responses were received from the vast majority of islands (50 out of 54) with a population above 50, although the very small numbers of available names and addresses for the very small islands (with a population of 50 or less) limited survey returns from these islands.
| Total population* of each island | Number of sampled islands | Surveys in final sample | Survey responses | Islands providing survey responses |
|---|---|---|---|---|
| over 10,000 | 4 | 12,953 | 2,625 | 4 |
| 1,001-10,000 | 10 | 4,875 | 1,157 | 10 |
| 201-1,000 | 16 | 1,570 | 392 | 13 |
| 101-200 | 14 | 375 | 112 | 14 |
| 51-100 | 10 | 148 | 43 | 9 |
| 50 or less | 22 | 79 | 18 | 9 |
* Census 2011 – based on postcode-level data
A large number of individual islands had low numbers of responses: eight islands provided more than 100 survey responses each, but 28 islands returned less than 10 surveys. This emphasises the need to report data at the subregion level. It is notable that the three largest islands (by population) which were sampled but did not return any surveys were in the Orkney Islands (South Ronaldsay, Burray, Rousay). These three islands were allocated 270 surveys in the sample, between them, and this unusual spatial pattern suggests issues with postage or survey distribution in parts of Orkney.
2.3 Weighting of responses
The survey was designed to ensure that the sample was as representative as possible of the combined subregion, gender and age cohorts. However, response rates differed between cohorts with some cohorts (particularly older age groups) being over-represented compared with others (particularly younger age groups). Survey responses were therefore weighted. Weights for the individuals in a particular cohort were calculated by dividing the proportion of the target census population in the cohort by the proportion of the total responses in that cohort. Where possible the stated age and gender of respondents was used as this was considered more reliable than the information in the Experian database. The survey targeted the population aged between 18 and 75 but some respondents stated that their age was greater than 75; these were included with the responses for the 66-75 age group. To calculate the weighted proportion giving a particular answer to a survey question the responses were coded as 1 for those who gave that answer and 0 for those who responded to the question with an alternative answer. Each of these coded responses was then multiplied by the corresponding weight and the sum of the weighted responses was calculated and divided by the sum of the weights.
All percentages cited in this report are based on the weighted data and are rounded to the nearest whole number.
2.4 Analysis
All comparisons described in the text (between different age groups or between islands) are statistically significant at the 95% level or above, unless otherwise specified. This means that the probability of having found a difference of at least this size, if there was no actual difference in the population, is 5% or less. The term 'significant' is used in this report to refer to statistical significance and is not intended to imply substantive importance.
Contact
Email: socialresearch@gov.scot