National Care Service - health and demographic profile: evidence
Provides an overview of Scotland’s health and demographic profile and population projections. It is part of a collection of contextual evidence papers, setting out key sources of information about social care and related areas in Scotland.
4. Projections
This section briefly explores a number of projections which have been made, primarily by NRS, which are relevant to the development of a National Care Service. Population projections have limitations. A projection is a calculation showing what happens if particular assumptions are made. The population projections are trend-based. They are, therefore, not policy-based forecasts of what the government expects to happen. Many social and economic factors influence population change, including policies adopted by both central and local government. The relationships between the various factors are complex and largely unknown. Nonetheless, projections of the number of adults (particularly older people) are usually more reliable than those for children because they are based on people who are already living in Scotland.
4.1 Life Expectancy
As noted, life expectancy in Scotland had been increasing steadily for decades. However, since 2012-14, improvements in life expectancy have stalled. NRS projections show life expectancy increasing again, but at a slower rate than previous projections (Figure 9).
However, it is important to note that life expectancy and healthy life expectancy trends in Scotland have not improved since around 2012, with life expectancy having been decreasing for those living in the most deprived 40% of areas[36]. The best available evidence indicates that this is largely due to economic factors impacting on the whole population, but particularly on those living in the most deprived circumstances. These trends reflect the impact on health of an array of social determinants; socio-economic circumstances, including poverty, housing and education that together influence health throughout the life-course. The future course of life expectancy and healthy life expectancy are dependent on future decisions around these key social determinants.
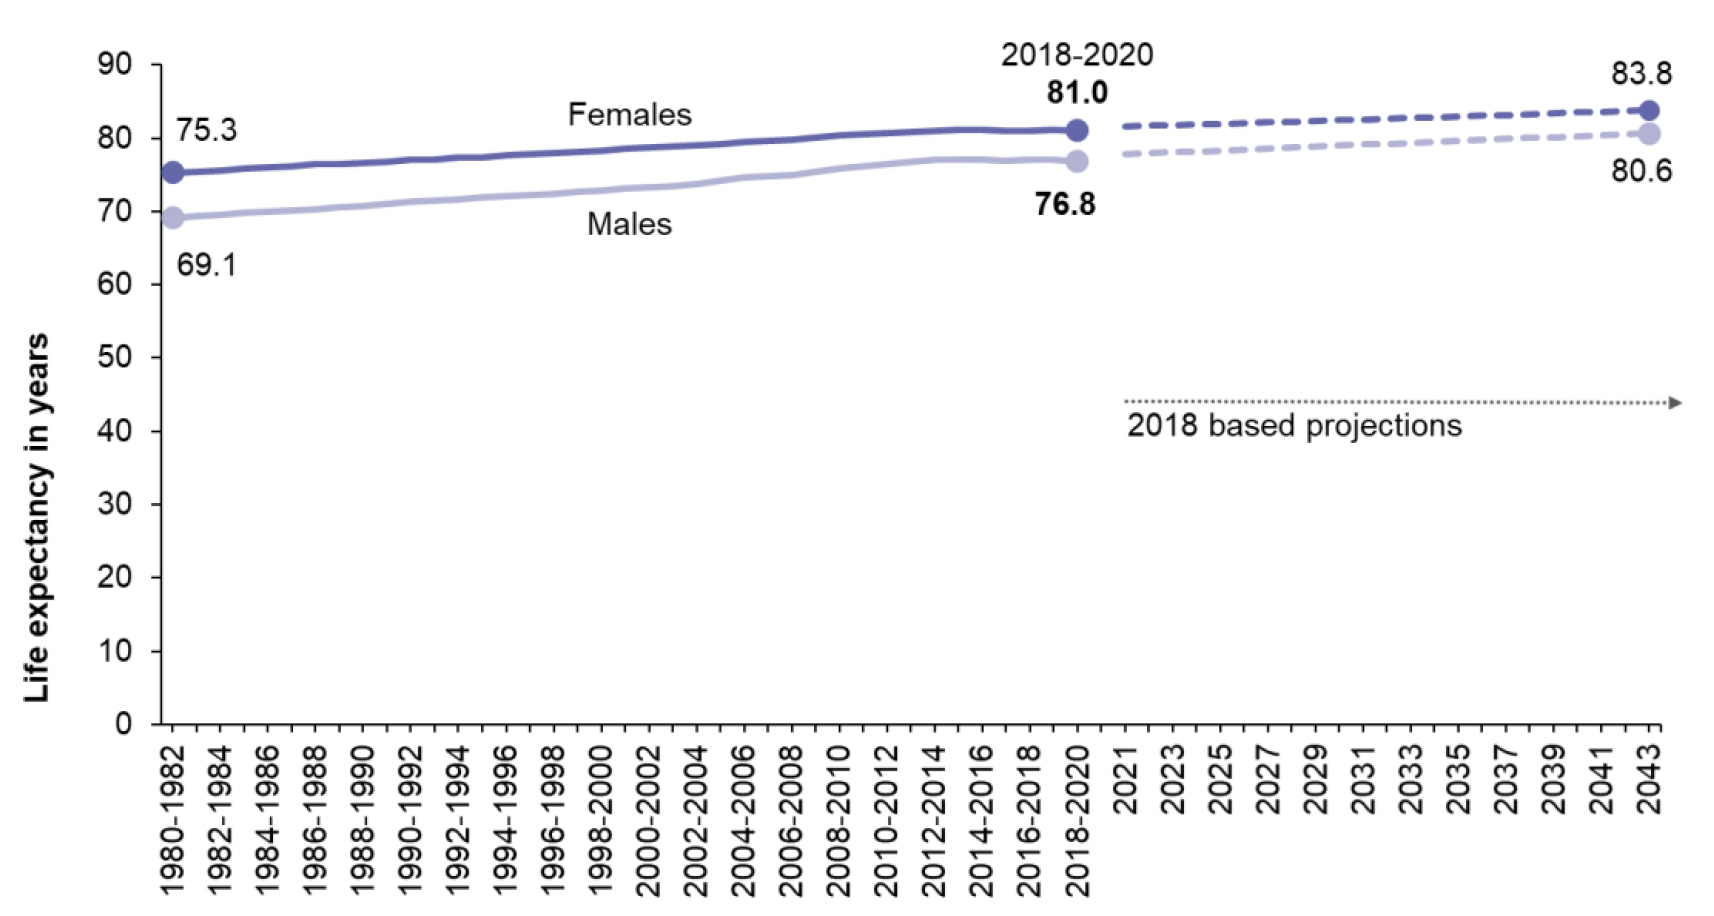
Source: Figures to 2018-20 are from National Life Tables for Scotland (NRS) based on 3 years of data. Figures from 2021 are projected single year life expectancies (2018 based, NRS). Life Expectancy in Scotland 2018-2020: Report (nrscotland.gov.uk)
4.2 Ageing Population
The age composition of the population is particularly important in this context, given that it shapes demand for health and social care services. Projections by NRS suggest that Scotland is likely to have more older people and fewer younger people in mid-2045 than in mid-2020[37]. The current (mid-2020) population structure includes a sharp peak at around age 73 (post-war baby boomers, born 1946-47), and a large bulge with people in their mid-50s (born during the 1960s baby boom). As these generations age, with higher life expectancy than in previous generations, they are projected to make up a growing proportion of the population. Also, as female life expectancy is higher than for males, more females are projected to live into older age. These projections suggest that the number of people aged 65 and over will grow by nearly a third by mid-2045 to make up 25.4%, with the number of children falling by over a fifth to 13.3% of the population. The population aged 16-64 years is projected to remain relatively stable and is projected to make up 61.3% of the population by mid-2045. Most of the changes are the result of the ageing population.
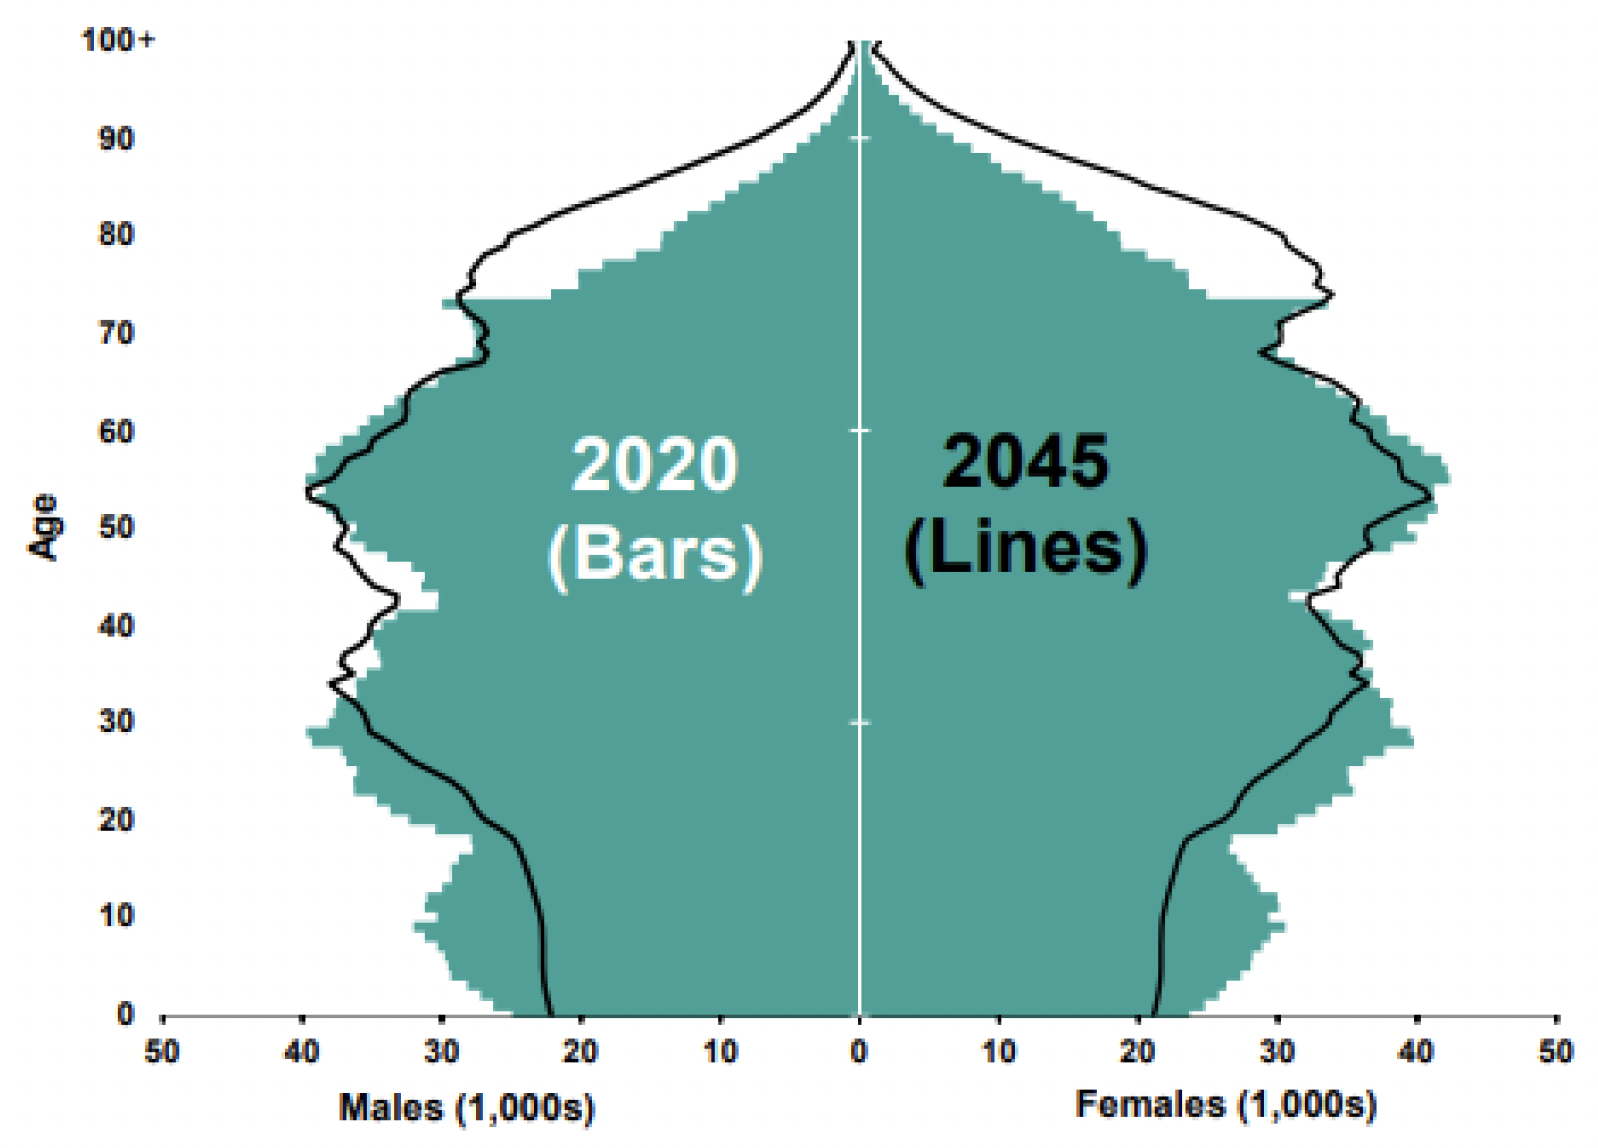
Source: Projected Population of Scotland (Interim) 2020-based, Report (NRS) (nrscotland.gov.uk)
Scotland's age-structural shift is also projected to contain increasing numbers of people aged in, what demographers refer to as, the 'oldest old' age categories. For example, NRS projects that the number of people aged 90 and over in Scotland will double between 2020 and 2045 from 43,749 to 85,354.
4.3 Increase in Single-Person Households
Another key NRS projection, relevant here, is the continuation of trends towards estimated increase in single-person households across Scotland. In 2019 more than a third of households were single person households[38]. The largest projected increases between 2018 and 2028 (in number and percentage terms) is in households containing one or two adults only. The number of one person households is projected to increase further by 8% (to 965,100 households); and the number of households with just two adults is projected to increase by 7% (to 830,600 households)[39].
Importantly here, people are more likely to live alone as they become older. In 2018, an estimated 113,800 men aged 65 and over were living alone. This is projected to increase to 139,500 in 2028 (an increase of 23%) and to 161,400 by 2043 (an increase of 42% compared with 2018). The number of women aged 65 and over living alone is projected to increase from 229,200 in 2018 to 245,900 in 2028 (increase of 16%) and to 326,900 by 2043 (an increase of 43% compared with 2018). The number of men aged 85 and over living alone is projected to increase by just over a quarter (26%) between 2018 and 2028, increasing from 17,600 to 22,100; and to nearly double to 33,700 by 2043 (an increase of 92% compared with 2018). The number of women aged 85 and over living alone is also projected to increase from 49,700 in 2018 to 59,400 in 2028 (an increase of 20%) and then to 90,900 by 2043 (an increase of 83% compared with 2018). In 2028, 65% of women in this age group are projected to live alone, compared to 39% of men. The substantial projected increase in the number of older households, in particular of older people living alone, has implications for services and policies aimed at supporting older people.
Contact
Email: SWStat@gov.scot