National Care Service - health and demographic profile: evidence
Provides an overview of Scotland’s health and demographic profile and population projections. It is part of a collection of contextual evidence papers, setting out key sources of information about social care and related areas in Scotland.
3. Overview of Scotland's Health Profile
This section provides an overview of the health profile of Scotland's population, placing focus on aspects relevant to the development of a National Care Service. It outlines the country's health profile in terms of overall life expectancy, healthy life expectancy, the burden of disease and multimorbidity. Throughout these subsections, it explores how these indicators are shaped by socio-economic and demographic factors. While some emphasis is placed on measures such as life expectancy, it is important to note that demand for social care is not restricted to those of older age. As noted in the section on multimorbidity and healthy life expectancy, demand for social care is seen across a far wider section of Scotland's population.
3.1 Life Expectancy
3.1.1 Overview
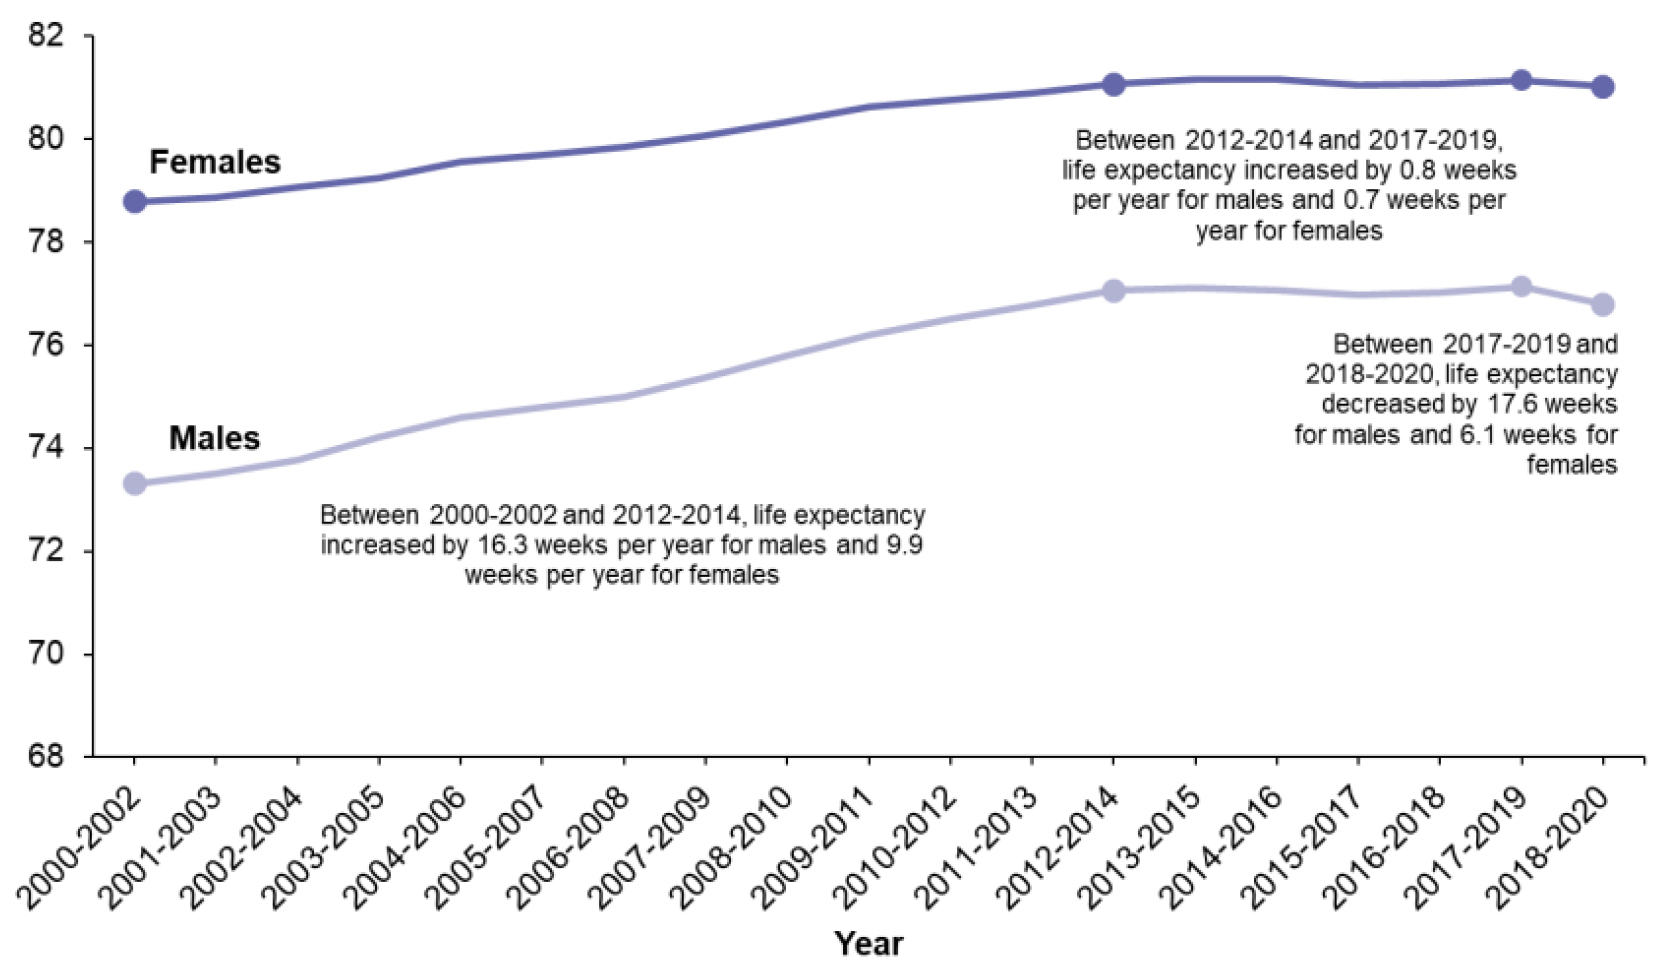
Scotland has the lowest life expectancy at birth of any Western European country[8],[9]. In 2018-2020, life expectancy at birth[10] in Scotland was 76.8 years for males and 81.0 years for females[11]; 2.3 and 1.8 years shorter than across the UK as a whole, respectively.
Source: Life Expectancy in Scotland 2018-2020: Report (nrscotland.gov.uk)
Having increased since the early 1980s, life expectancy in Scotland remained virtually unchanged between 2012-2014 and 2017-2019. Between 2017-2019 and 2018-20, life expectancy across Scotland declined, dropping below the 2012-2014 figure (Figure 1). This represents a decrease of around 17.6 weeks (0.3 years) for males and 6.1 weeks (0.1 years) for females since the previous year's estimates - the biggest annual decrease since the series began. A similar stalling in trends has been seen across the rest of the UK and some other countries including the USA, with life expectancy having fallen over the latest year in all UK countries.
In terms of direct causes underlying this decrease, deaths from Covid-19 accounted for the majority, while drug-related deaths and deaths from external causes (including accidents and suicides) also had a negative effect on life expectancy. Wider analyses have suggested that UK Government changes to tax and welfare from 2010/11 have contributed to these trends[12].
3.1.2 Socio-economic Inequalities in Life Expectancy
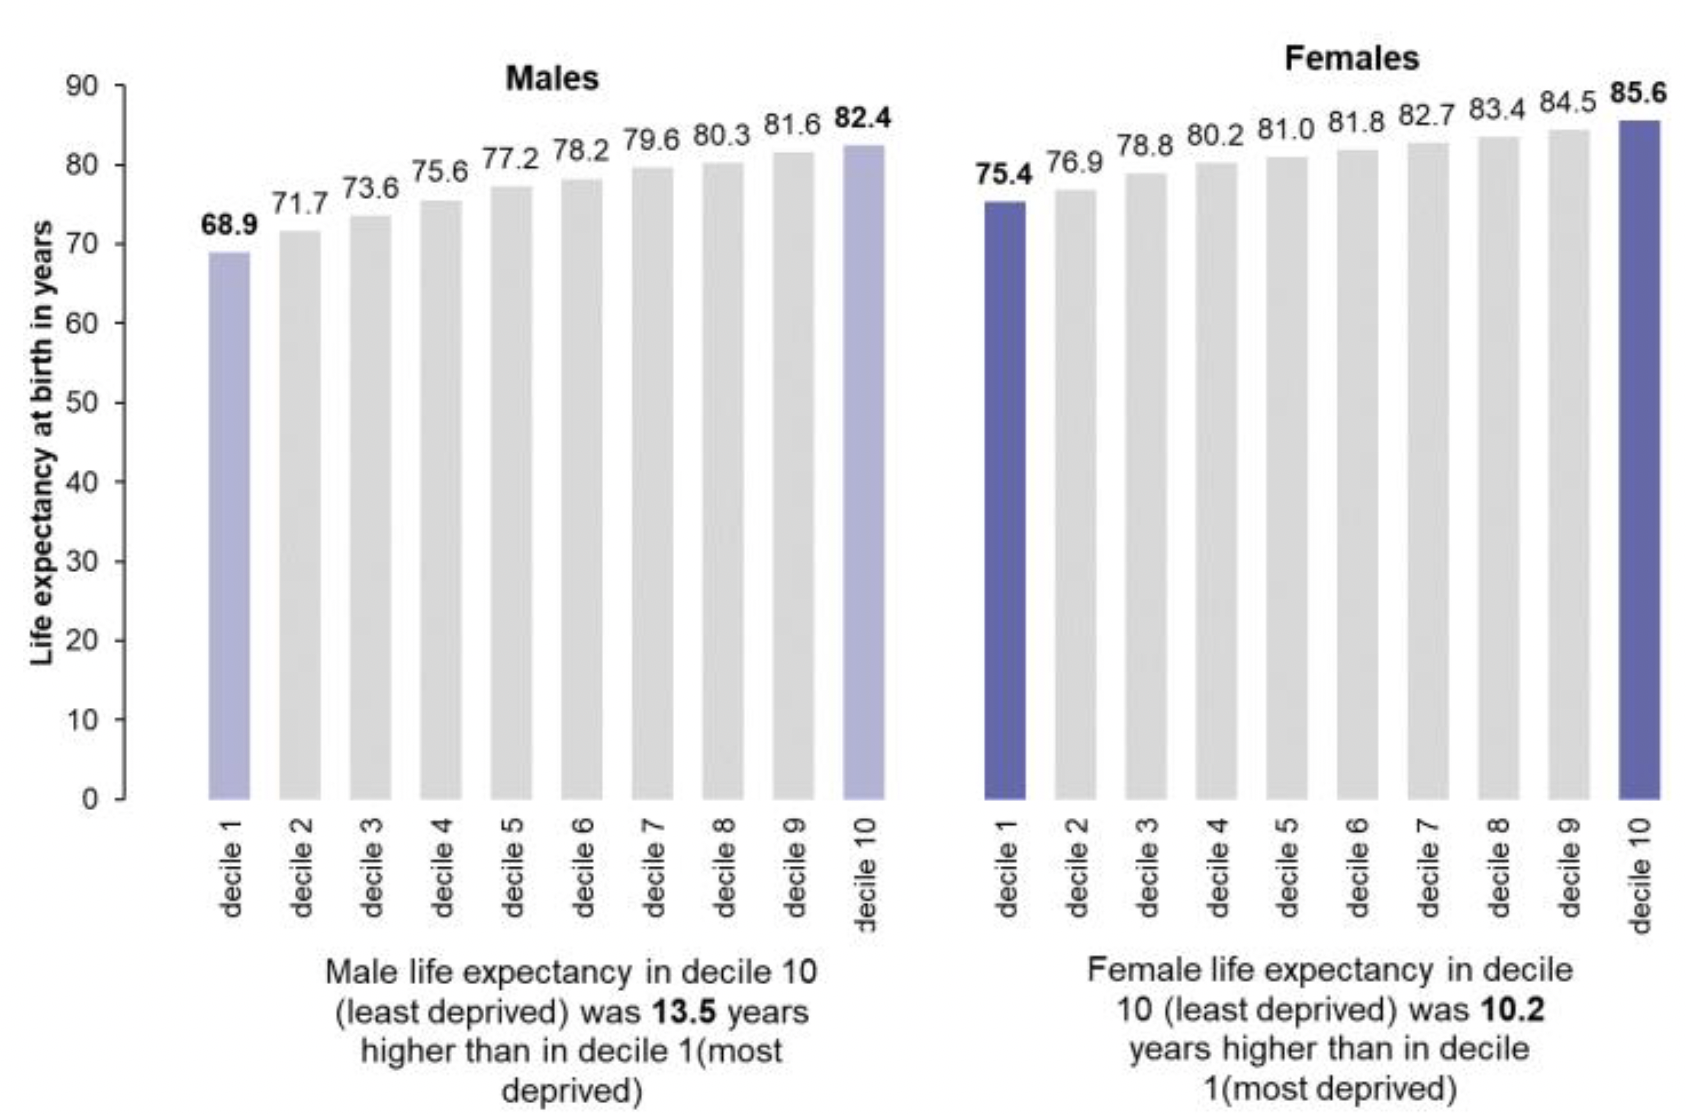
As well as the lowest life expectancy, Scotland has the widest socio-economic inequalities in health[13] of any country in Western Europe. While life expectancy varies between geographical areas, like local authorities and health boards, the difference in life expectancy is far greater when levels of deprivation are taken into account. In 2018-20, the gap in life expectancy between the most and least deprived Scottish Index of Multiple Deprivation (SIMD) deciles[14] was 13.5 years for males (68.9 – 82.4 years) and 10.2 years for females (75.4 – 85.6 years) (Figure 2). This gap has widened over the past few years, growing by 1.3 years for males and 1.6 years for females since 2013-2015, with life expectancy falling in the most deprived and increasing in the least deprived areas[15].
Source: Life Expectancy in Scotland 2018-2020: Report (nrscotland.gov.uk)
3.1.3 Geographic Inequalities in Life Expectancy
There are also substantial geographic inequalities in health across Scotland, largely reflecting socio-economic inequalities between areas. Across council areas, female life expectancy at birth was highest in East Renfrewshire (84.0 (±0.6) years) and lowest in Glasgow City (78.3 (±0.3) years). Male life expectancy at birth was highest in Shetland Islands (80.6 (±1.3) years) and lowest in Glasgow City (73.1 (±0.3) years); this represents 5.7 fewer years of life for females and 7.5 fewer years of life for males compared with East Renfrewshire and Shetland Islands respectively. The rate of growth in life expectancy has slowed or stalled in the majority of Scotland's local authority areas since 2012-2014 and many areas now have decreasing life expectancy, with Inverclyde, Dundee City and South Ayrshire experiencing some of the biggest decreases.
Life expectancy also varies by rurality across Scotland. People living in more rural areas generally live longer and spend more years in good health than those in more urban areas[16]. For males, life expectancy was highest in 'Accessible Rural' areas at 79.4 (±0.3) years and lowest in 'Large Urban' areas (75.7 ±0.2 years). For females, it was highest in 'Remote Rural' areas at 83.2 (±0.3) years and lowest in 'Other Urban' areas (80.2 ±0.1 years). This is relevant to the development of a National Care Service given the challenges associated with rural services, which may require greater service costs, stemming from reduced opportunities for economies of scale, higher travel costs and time, and challenges relating to staffing, training, development and partnership working[17].
3.1.4 Life Expectancy at Older Ages, and 'Time to Death'
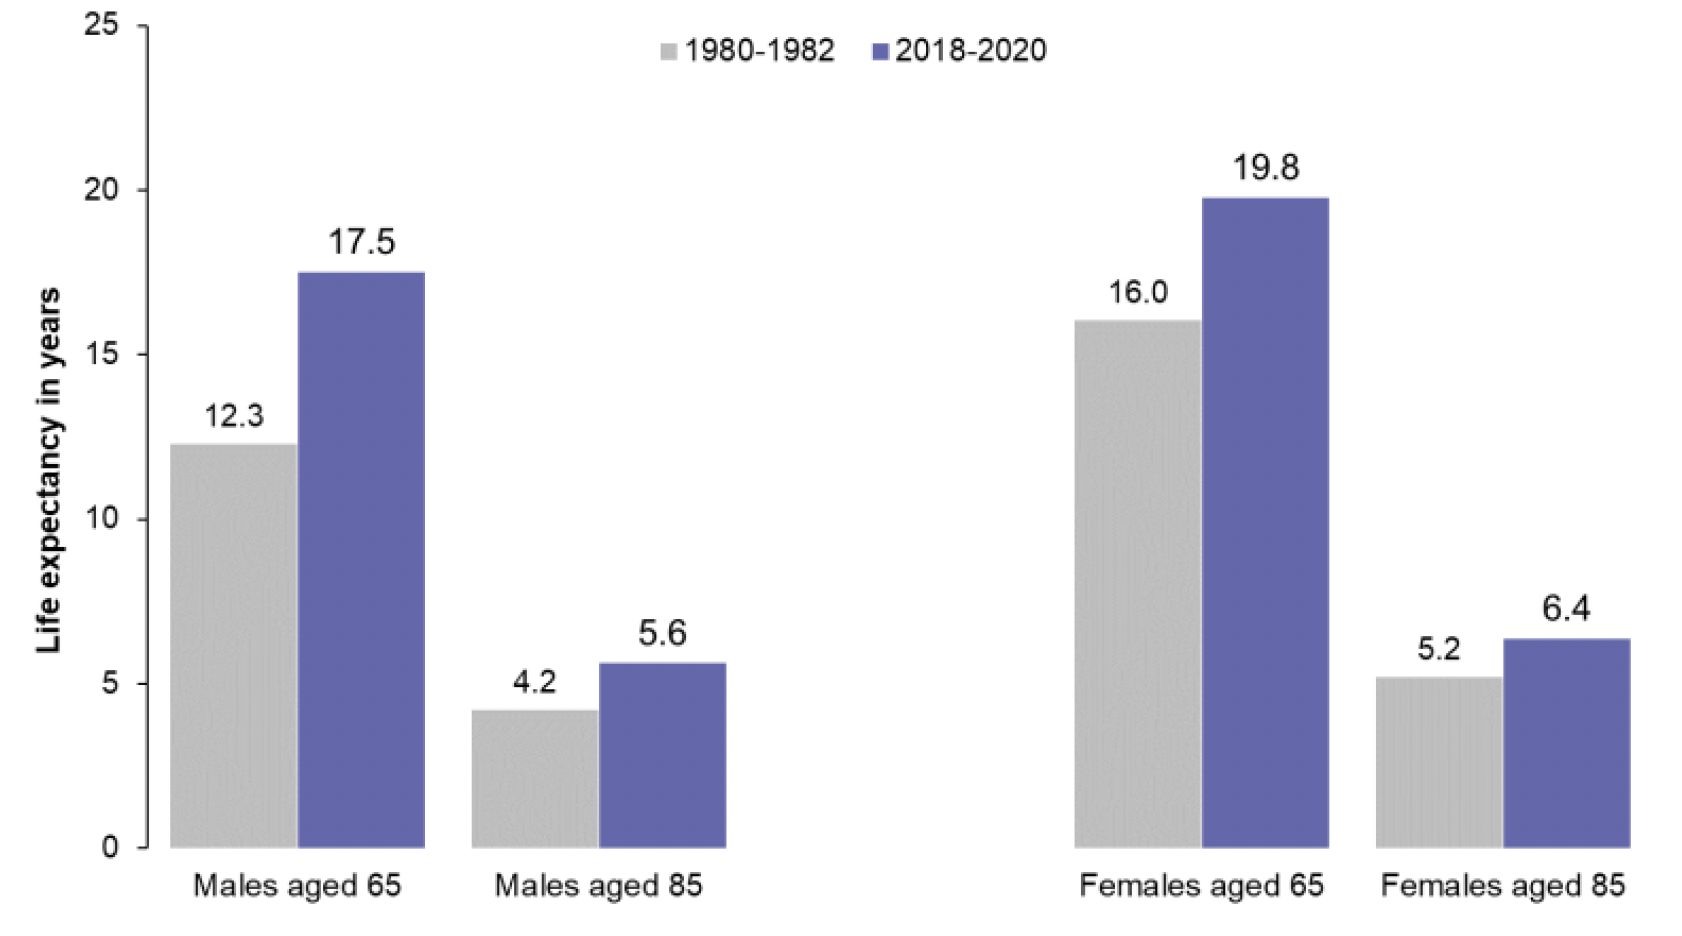
Another relevant measure of life expectancy estimates the number of years individuals aged 65 years can expect to live. In 2018-20, 65 year old males and females could expect to live another 17.5 and 19.8 years, respectively. For 85 years old males and females, life expectancy in 2018-20 was 5.6 years and 6.4 years, respectively. Figure 3 shows how life expectancy at older ages has changed since 1980-82. Life expectancy for males aged 65 has increased by 5.2 years across this time series, and by 3.7 years for females. For those aged 85, life expectancy for males has increased by 1.4 years, and 1.2 years for females, between 1980-1982 and 2018-20.
Source: Life Expectancy in Scotland 2018-2020: Report (nrscotland.gov.uk)
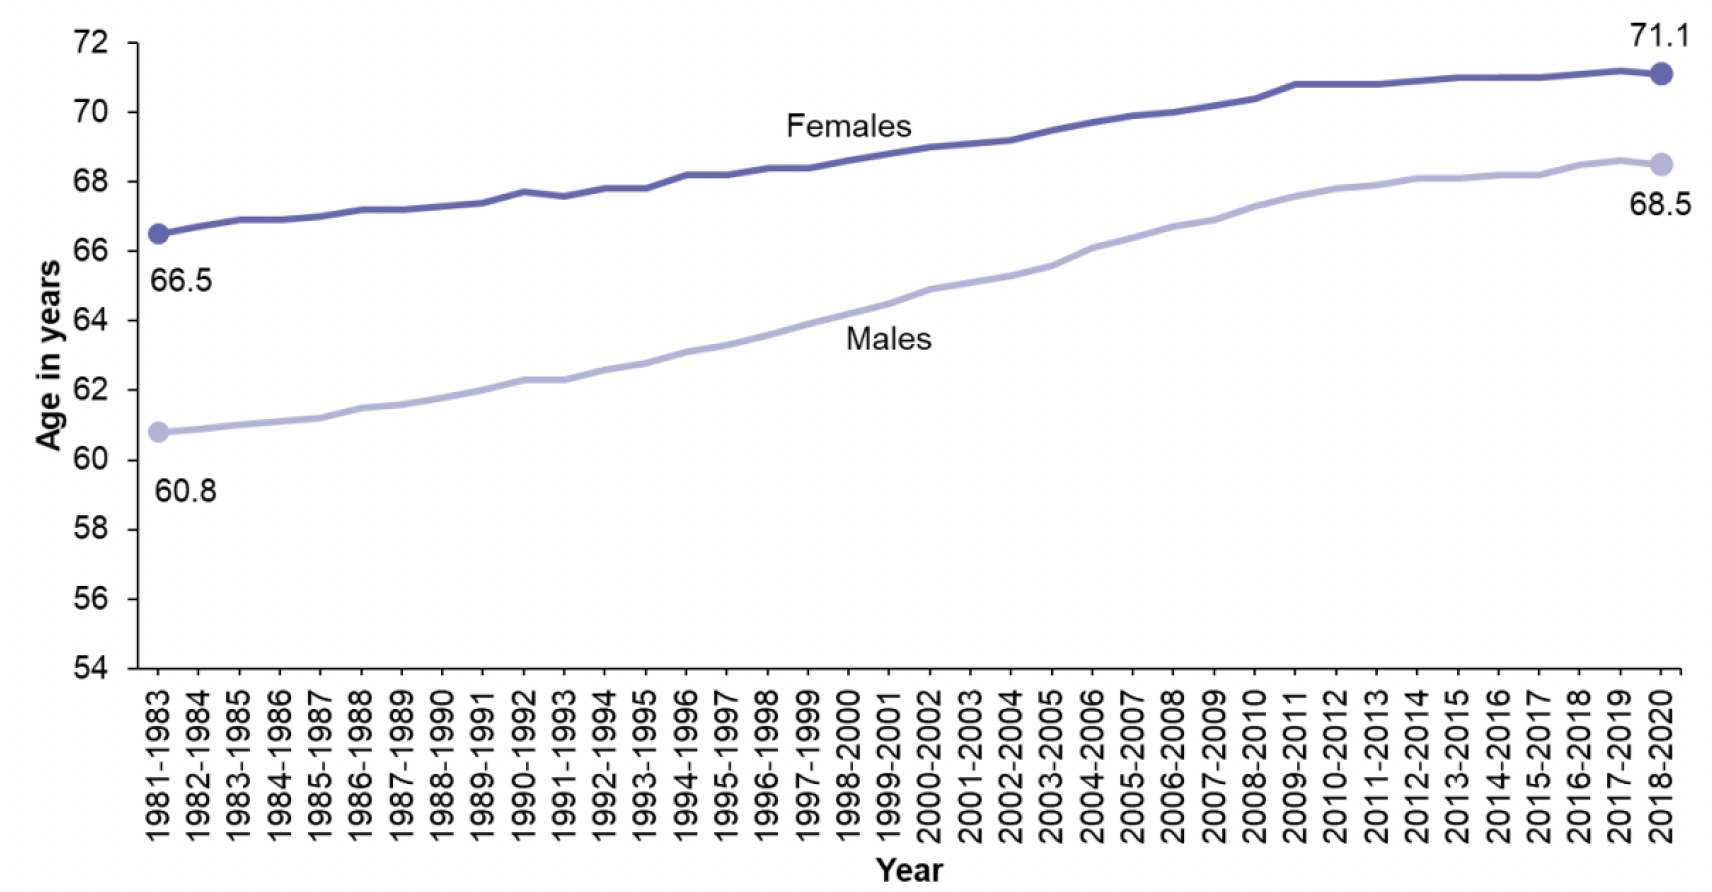
Life expectancy estimates can also be used to look at population ageing. As life expectancy increases, the age at which a person is 'elderly' or approaching death changes. This definition is important, as we define the 'elderly' population as those aged over 65. However, studies show that a lot of the health problems related to old age are more closely associated with how long someone has left to live, rather than how long they have already lived. This means it may be more useful for health and social care policy to look at how many people have only 15 years of life expectancy remaining, rather than the number of people aged 65 and over. Figure 4 shows the average age at which males and females in Scotland have only 15 years of life remaining. This age has risen from 66.5 in females in 1981-1983 to 71.1 in 2018-2020. For males, the average age at which 15 years of life remains has risen from 60.8 to 68.5 over the same period.
Source: Life Expectancy in Scotland 2018-2020: Report (nrscotland.gov.uk)
3.2 Healthy Life Expectancy
3.2.1 Overview
Healthy life expectancy (HLE) is an estimate of the number of years lived in 'very good' or 'good' general health, based on how individuals perceive their state of health at the time of completing the annual population survey (APS)[18]. The estimated healthy life expectancy of a child born in 2018-20 was 61.8 (± 0.5) years for females, and 60.9 (± 0.5) years for males[19]. For males, HLE at birth increased between 2009-2011 and 2015-2017, but has decreased since and is now lower than in 2009-2011. Female HLE at birth was relatively stable between 2009-2011 and 2014-2016 but has since decreased each year (Figure 5).
Although both life expectancy and HLE have fallen for males in recent years, HLE has done so at a faster rate. This means that a greater proportion of life will likely be spent in poor health than in previous years. Life expectancy at birth for females has experienced relatively little change since 2010-2012 although it has fallen by a larger amount over the past year. HLE has consistently been higher for females than males but by a much smaller margin than overall life expectancy and in the last few years the difference has not been statistically significant. This means that a greater proportion of life for females is spent in poor health compared to males. The proportion of life spent in good health has also been decreasing more rapidly for females than males.
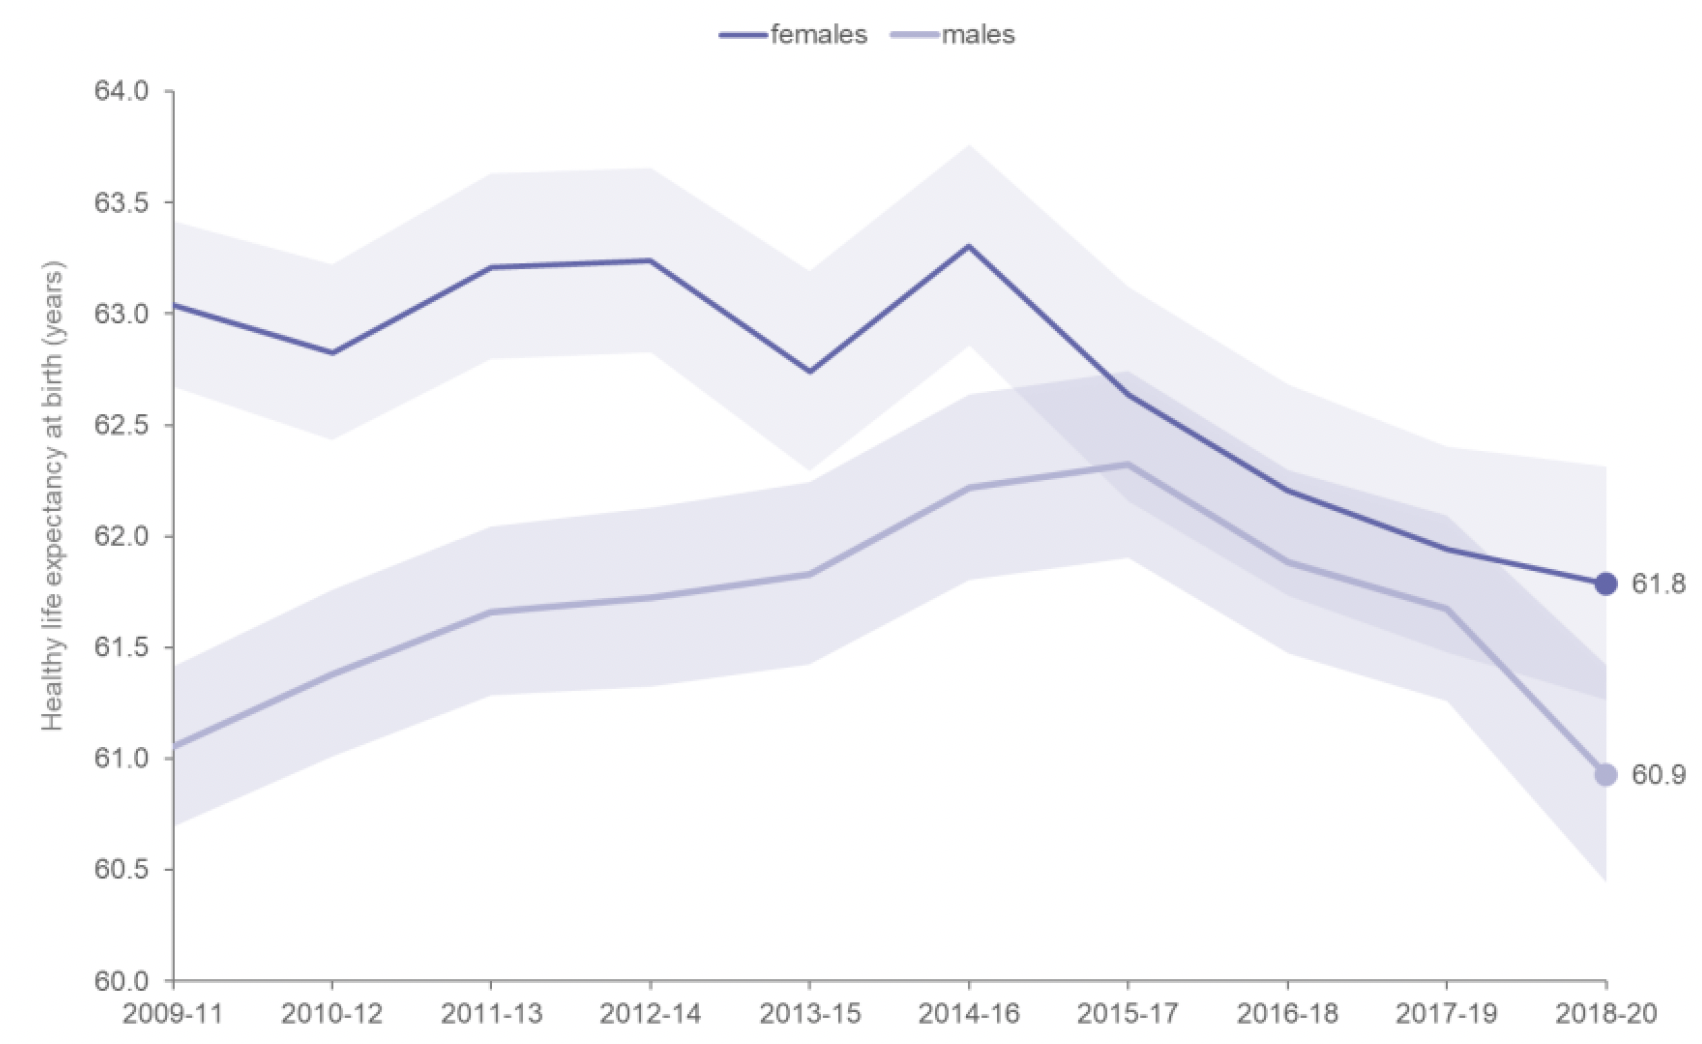
* The shaded area shows the upper and lower 95% confidence intervals.
Source: Healthy Life Expectancy 2018-2020 (NRS)
3.2.2 Socio-economic Inequalities in Healthy Life Expectancy
Socio-economic inequalities in healthy life expectancy are wider than inequalities in life expectancy. Using SIMD deciles[20], males born in the most deprived decile were estimated to have an HLE of 45.4 (±2.2) years, compared to 69.7 (±1.4) years for males in the least deprived decile; a difference of 24.4 years (Figure 6). Females born in the most deprived decile were estimated to have an HLE of 48.6 (±1.9) years, compared to 72.9 (±1.4) years for females in the least deprived decile; a difference of 24.2 years (Figure 7).
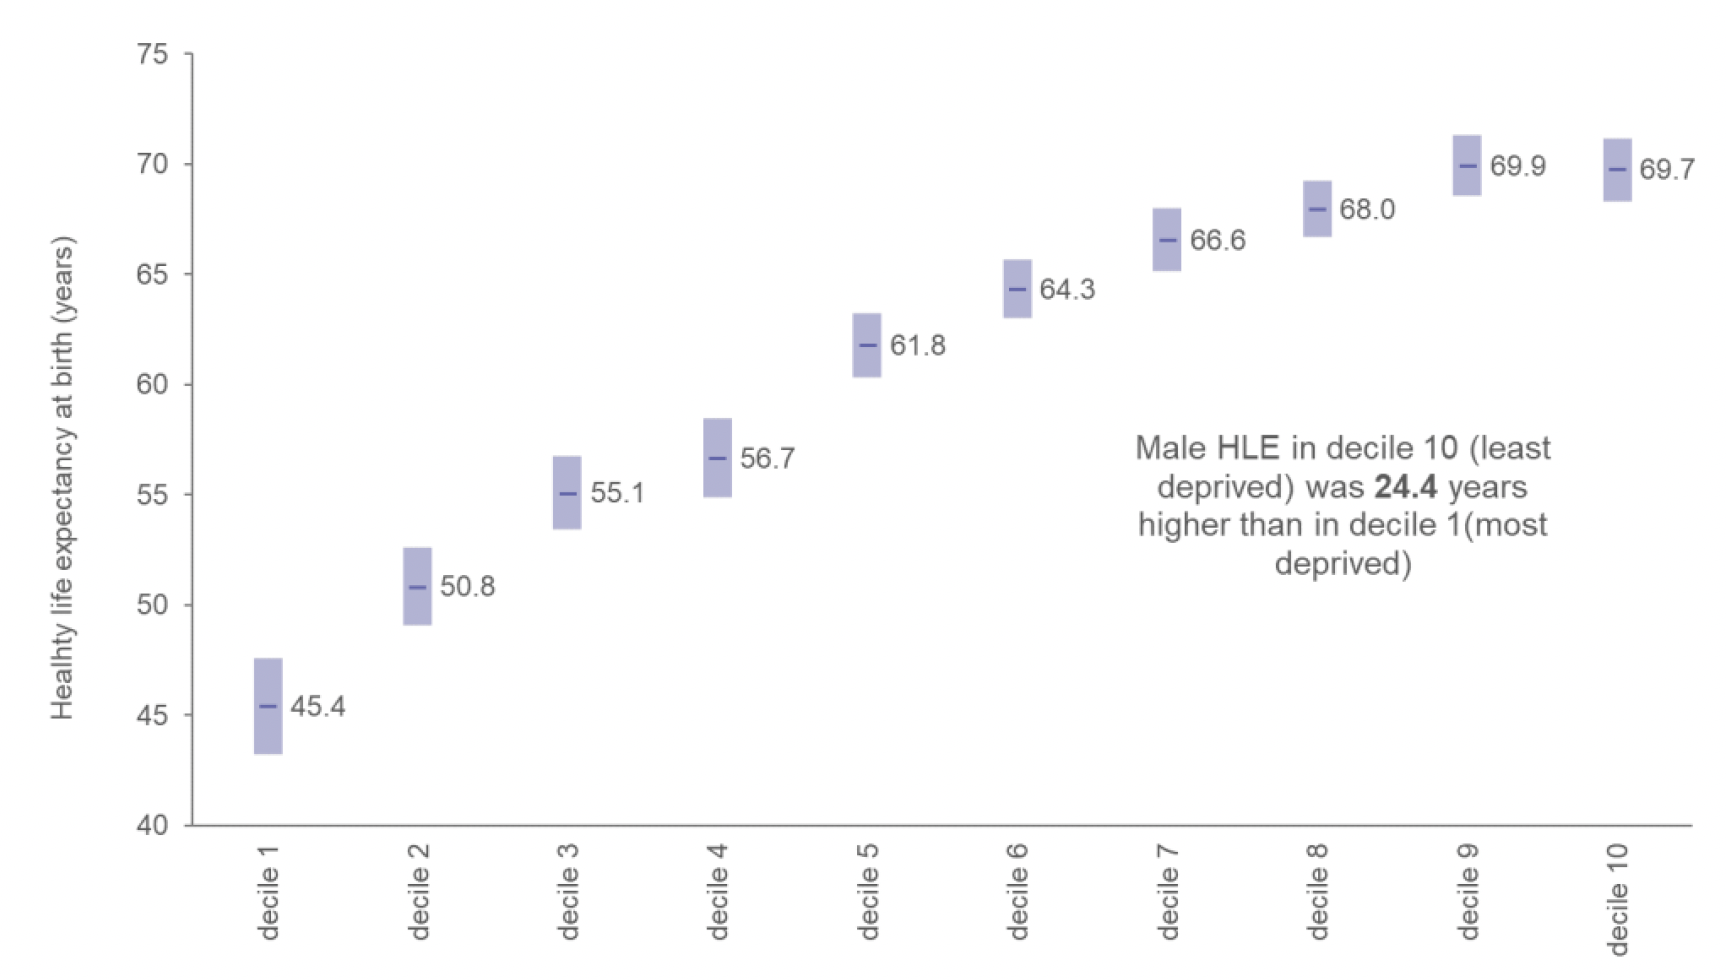
Source: Healthy Life Expectancy 2018-2020 (NRS)
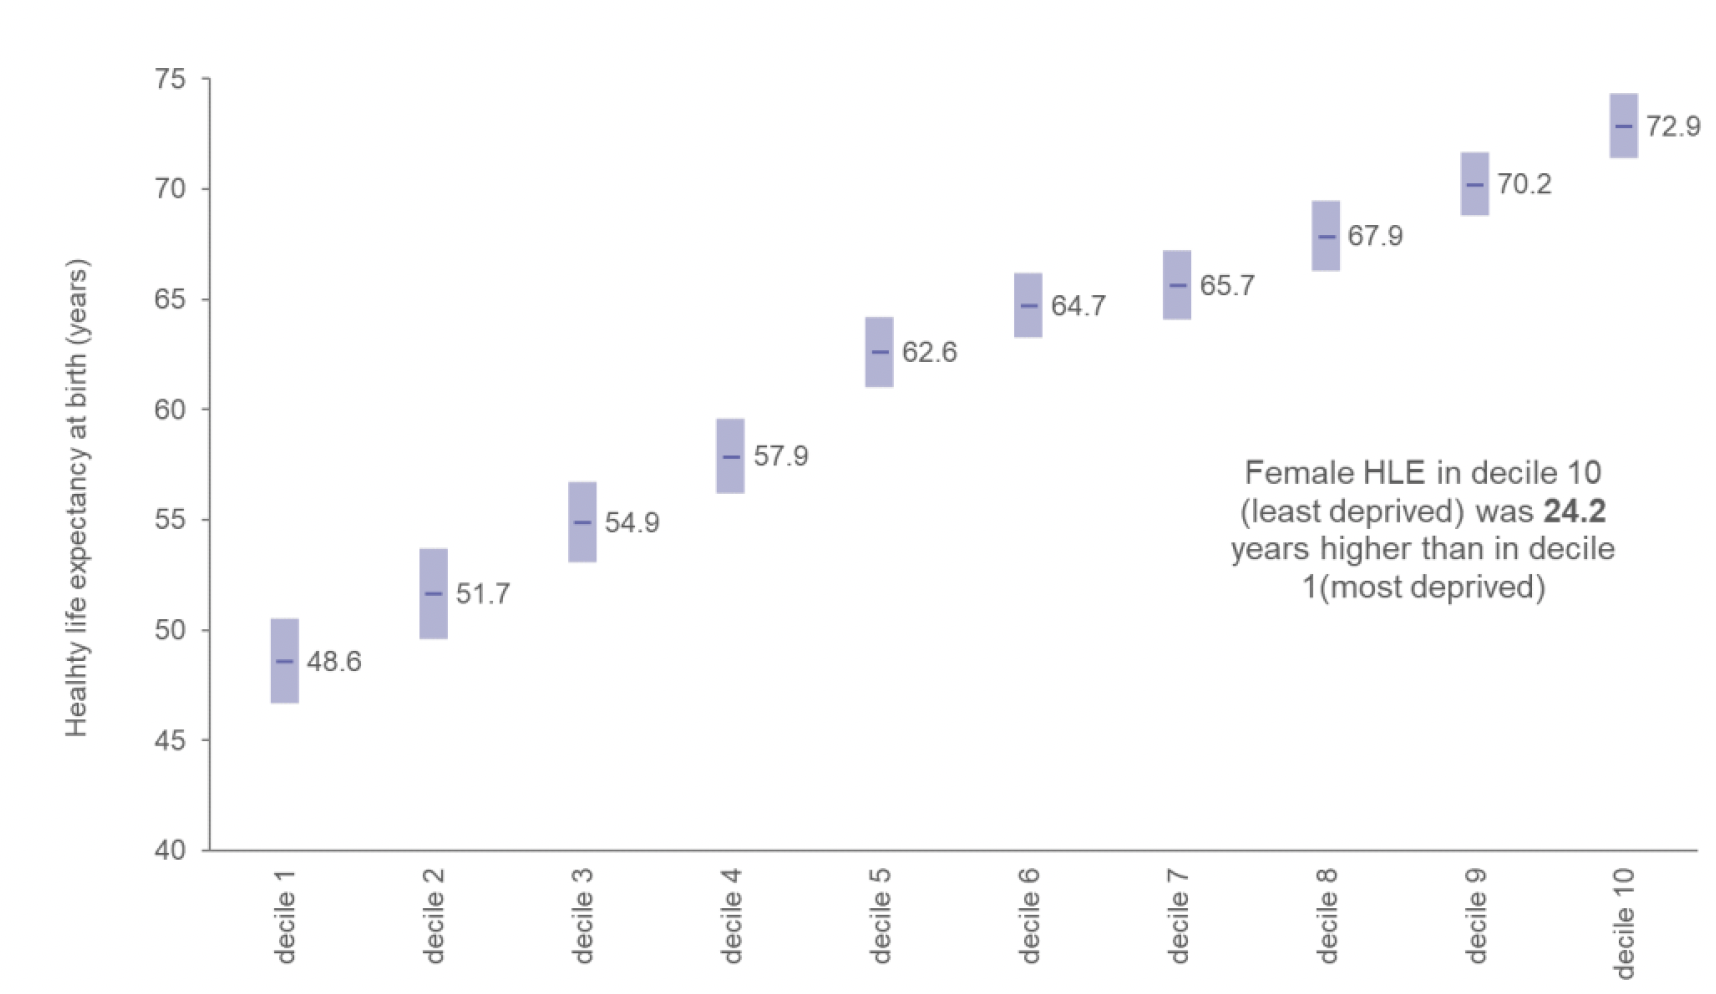
Source: Healthy Life Expectancy 2018-2020 (NRS)
Males in the least deprived areas are expected to spend 84.6% of their life in good health compared with 65.8% in the most deprived areas. Females in the least deprived areas are expected to spend 85.2% of their life in good health compared with 64.5% in the most deprived areas.
For both males and females, the difference in HLE between the most and least deprived areas is much larger than the difference in LE. The result of this is that people in the most deprived areas not only have shorter life expectancy and lower HLE, but they also have a smaller proportion of life spent in good health.
3.2.3 Geographic Inequalities in Healthy Life Expectancy
There are also wide regional variations in HLE, again largely rooted in socio-economic inequalities. For males in 2018-20, HLE at birth was highest in Orkney Islands (71.2 (±5.1) years), East Renfrewshire (68.7 (±1.8) years) and Na h-Eileanan Siar (68.3 (±3.1) years). For females in 2018-20, HLE at birth was highest in Orkney Islands (77.5 (±3.6) years), Na h-Eileanan Siar (67.5(±3.8) years) and East Renfrewshire (67.0 (±2.7) years). In comparison, for males in 2018-20, HLE at birth was lowest in Inverclyde (54.4 (±2.8) years), Glasgow City (56.0 (±1.8) years) and Dundee City (56.1 (±2.3) years). For females in 2018-20, HLE at birth was lowest in North Ayrshire (54.0 (±2.5) years), North Lanarkshire (55.5 (±2.4) years) and Glasgow City (57.4 (±2.2) years)[21].
The difference between the HLE expectancy estimates in the most urban and most rural areas is 6.9 years for males and 3.6 years for females. The rural categories show the highest HLE estimates whilst the urban areas have the lowest in both males and females.
3.2.4 Healthy Life Expectancy at Older Ages
Another measure is HLE at 65 years. In 2017-19, the estimated HLE at 65 years was 10.7 (± 0.3) years for females and 9.9 (± 0.3) years for males.
Over the last decade, male HLE at 65 has experienced an increase whilst female HLE at 65 has remained relatively unchanged since 2009-2011. Due to an ageing population, this means females are estimated to spend a greater proportion of their life in bad health than previously experienced, as the healthy life expectancy at 65 is not increasing in line with the increasing life expectancy.
3.3 Burden of Disease
Burden of disease is a measure of the health of the population. It aims to quantify the difference between living to old age in good health, and the situation in which healthy life is shortened by illness, injury, disability and early death[22]. The latest data on the burden of disease across Scotland come from ScotPHO, whose Scottish Burden of Disease (SBoD) study team have produced comprehensive estimates of Scotland's disease, condition and injury burden for 2016[23].
The health problems which cause the most non-fatal burden (proportion of the year lived with disability – YLD), include disability associated with anxiety, depression and dementia, along with diseases linked to health-related behaviours (in relation to diet, exercise, tobacco, alcohol and drugs[24]), and those caused by our living longer. Figure 8 displays the leading causes of disability in Scotland. ScotPHO note that there were more person-years[25] lived in less than ideal health due to depression in 2016 than there were lost to early deaths from lung cancer, and more person-years lived in less than ideal health due to low back and neck pain than lost to early deaths from stroke.
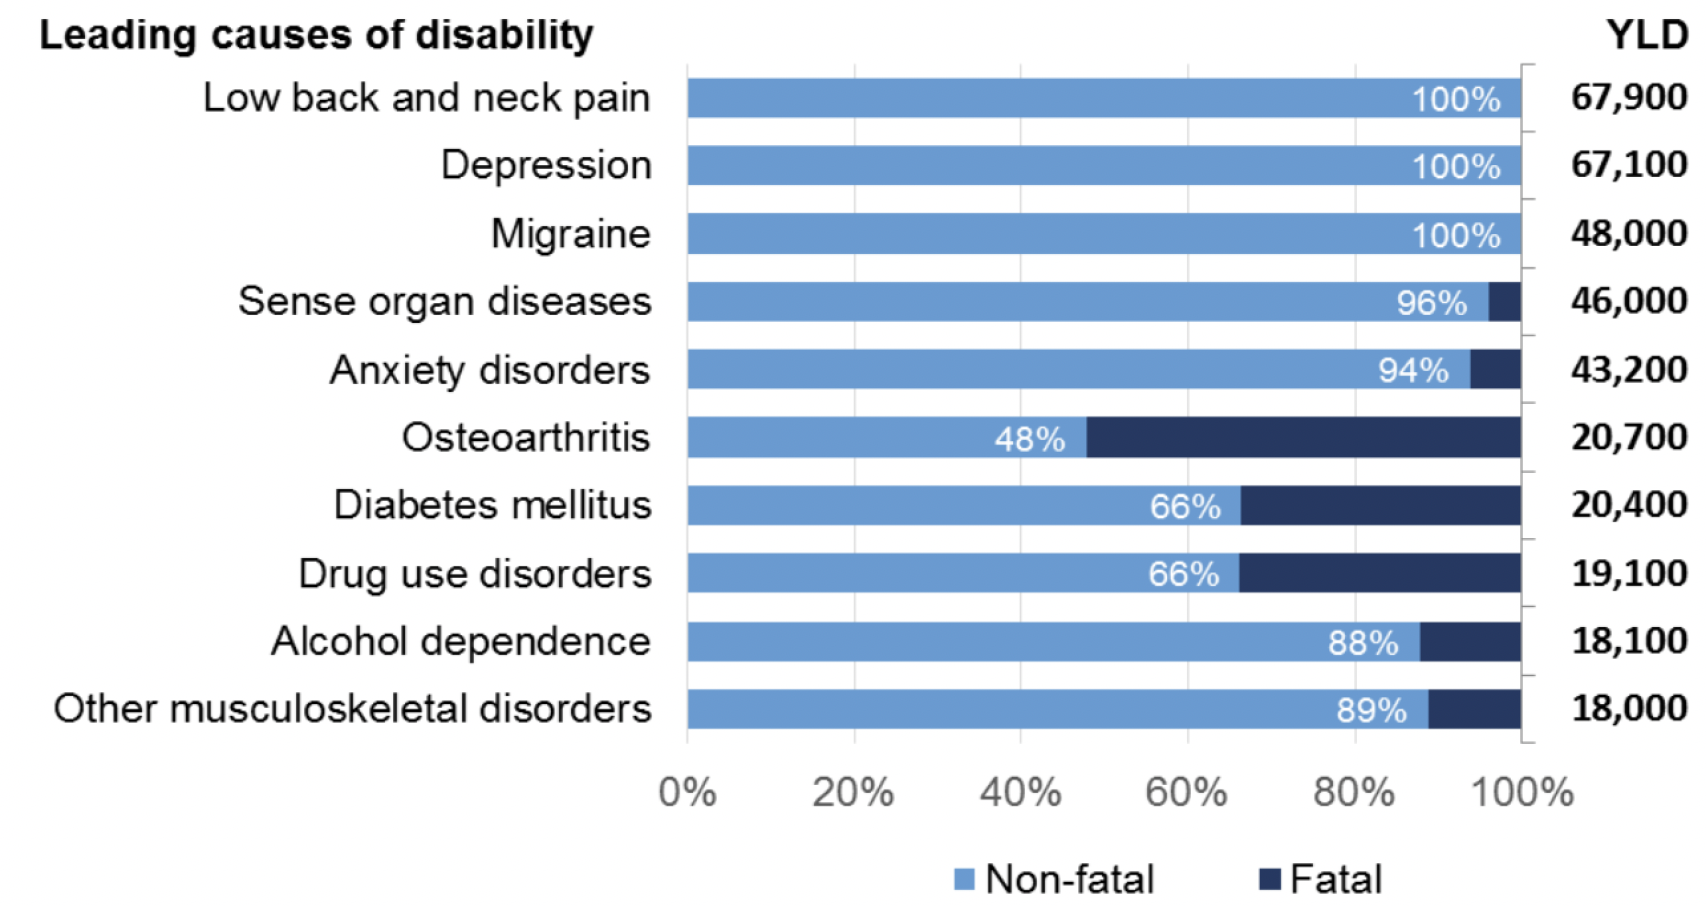
Source: ScotPHO (2016) The Scottish Burden of Disease Study, 2016: Overview Report
There are wide inequalities in the burden of disease by socio-economic deprivation. Overall, 1,305,000 disability adjusted life years (DALY) were lost due to ill health or early death in Scotland in 2016[26]. This ranged from around 184,000 (14.1% of the total) in the most deprived areas to 88,000 (6.7%) in the least deprived areas of Scotland[27]. Total burden increased with increasing levels of deprivation. An estimated 32.9% of these DALY are 'excess'; the total burden that would have been avoided if all deprivation deciles had the same rate as the least deprived areas in Scotland. Over 50% of the total burden in the most deprived decile was excess, in comparison with the least deprived.
3.4 Multimorbidity
Discussion of multimorbidity is relevant here as it has multiple implications, including mortality, unplanned hospital admissions[28], primary care consultations, polypharmacy, and the need for care[29]. The proportion of individuals who have two or more medical conditions simultaneously (referred to as 'multimorbidity') has risen across high income countries, including the UK[30], partly reflecting increases in life expectancy across recent decades. Projections suggest that this trend is set to continue[31]. While these trends reflect the ageing profile of populations, it is important to note that multimorbidity is not restricted to older people.
A recent cross-sectional study which linked national health and social care data to explore multimorbidity and social care use in those aged over 65, found that 93.3% of those receiving social care had multimorbidity, and that 16.2% of those with multimorbidity had received social care, compared with 3.7% of those without[32]. This study also explored how a number of factors – age, deprivation and gender – affected the likelihood of receiving social care. Age showed the largest margin of effect; compared with those aged 65-69 years old, the probability of receiving social care increased by 2.2% in the 70-74 age group, to almost 50% for those aged over 95 years. Those in the most deprived SIMD decile were 5.5% more likely to receive social care compared with those in the least deprived. Small gender differences were apparent too, with women having a 3.2% increased probability of receiving social care than men.
While now a decade old, a nationally representative study of almost 1.8 million people in Scotland derived from primary care electronic records found a multimorbidity prevalence rate of 24%, with the majority of people over the age of 65 years having multimorbidity[33]. Again, this study also found inequalities in multimorbidity across Scotland, with people living in the most deprived areas having higher rates of multimorbidity, with onset 10-15 years earlier, than those living in the least deprived areas. The combination of mental and physical health problems is most common in deprived areas, although pain and depression are in the top five conditions in people with multimorbidity of all ages, and across all deprivation levels[34].
A recent study also demonstrated inverse care from GPs in relation to multimorbidity in Glasgow; despite the greater need of patients with multimorbidity in deprived areas, the study found longer consultation length, higher GP patient centeredness and higher perceived GP empathy in less deprived areas of the city[35].
Contact
Email: SWStat@gov.scot