How much do people in Scotland value characteristics of marine and coastal areas
This report summarises the results of a choice experiment survey that was designed to capture the preferences of Scottish people towards the management of marine and coastal areas in Scotland.
3. Methodology
This section describes the methodological approach for this research. A number of best-practise guidance documents were consulted on to aid the survey design process (Bateman et al., 2002; Johnston et al., 2017; Mariel et al., 2021).
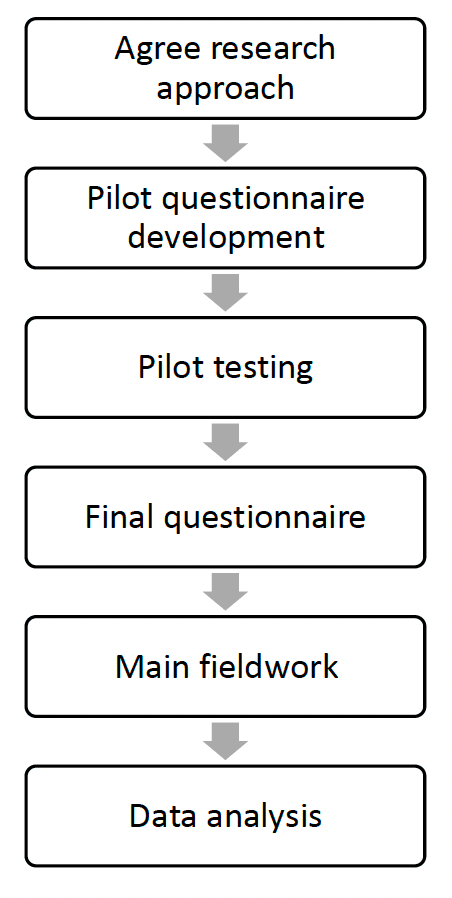
The development of this choice experiment included a number of key steps, as outlined in Figure 2. After agreeing the research approach, an initial online survey questionnaire was designed and tested on a pilot sample. Results from the pilot were discussed with the project steering group and expert input led to questionnaire refinement. A final online questionnaire was designed and the main fieldwork was then undertaken. Results were analysed using a range of choice modelling techniques. Further information about the approach taken at key steps in the design process is detailed below.
3.1 Rationale for Choice Experiment Research Approach
As the objective of this research was to improve understanding of the value people place on characteristics of marine and coastal areas in Scotland, the first step was to determine whether a revealed preferences or stated preferences valuation method was more appropriate.
A review of previous literature suggested that ‘non-use value’ was likely to be a considerable component of the total economic value people place on characteristics of marine and coastal areas (Börger et al. 2014; Kenter et al. 2013). Further scoping made it clear that a revealed preferences approach was not going to be an appropriate way of assessing the economic value of key environmental and management characteristics of marine and coastal areas, due to lack of available market data to infer value from. As it is not possible to estimate ‘non-use value’ using revealed preferences, a stated preferences method was deemed to be more suitable
The next step was to consider whether a choice experiment or contingent valuation approach would be more appropriate. As discussed in the previous section, choice experiments allow for more information to be gathered about the value people place on specific characteristics of a good or service as opposed to the value of it as a whole. In a marine management policy context, this type of information is likely to be more useful when considering trade-offs between alternative management options of marine and coastal areas.
It was also important to select a method consistent with the underlying theory of welfare economics, of which a choice experiment is (Bateman et al. 2002). This increases the applicability of results to future-cost benefit analysis in the appropriate circumstances.
3.2 Pilot Questionnaire Development
The structure of the pilot questionnaire followed a typical choice experiment survey. It included an introduction, initial questions about perceptions of marine and coastal areas, a choice experiment, follow-up questions and additional questions about respondent’s behaviours and socio-demographics.
In a choice experiment, it is crucial to develop a credible overarching choice context and present respondents with a realistic mechanism for change (Bateman et al., 2002; Johnston et al., 2017)[3]. The context developed for the pilot was based on plausible alternative management options for marine and coastal areas in Scotland.
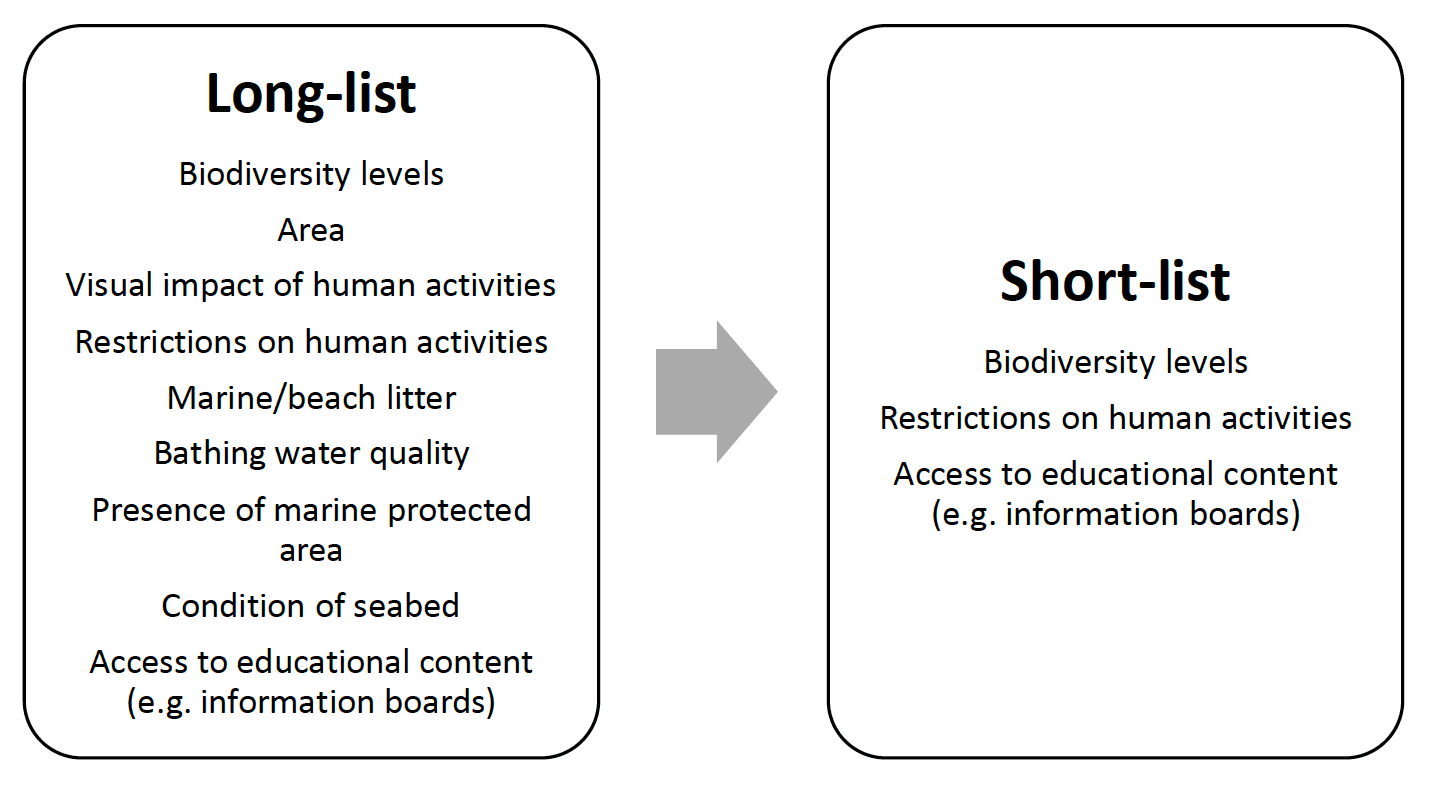
This overarching choice context provided a foundation to develop an initial long-list of relevant attribute to discuss with the Project Steering Group (see Figure 3). The long-list was presented to the Project Steering Group and feedback and advice was sought to create a short-list to take forward for pilot testing. Key takeaways from discussions included the difficulty of presenting some attributes on the long-list in a meaningful way (e.g. visual impact of human activities, condition of seabed) and the need to present biodiversity in an understandable way. Attributes relating to biodiversity levels, restrictions on human activities and access to educational content were taken forward. These were thought to be the most relevant when considering the key characteristics that could be impacted by plausible alternative management options for marine and coastal areas.
It is standard practise to include a monetary attribute in a choice experiment. This is called the payment vehicle and allows for the estimation of willingness to pay for marginal changes in the other attributes. The payment vehicle should be realistic, credible, familiar and binding for all respondents to as great an extent as possible (Johnston et al., 2017).
Household’s annual water charge was included as the payment vehicle in the initial questionnaire design. The majority of households in Scotland are subject to a water charge. These are unmetered charges and are based on the council tax banding of their home[4]. As a payment vehicle, this appeared to fulfil the conditions of being realistic, credible, familiar and binding for all respondents. It was explained to respondents that each option presented in the choice experiment would require payment in the form of an increase in their annual household water charge to support the introduction, monitoring and enforcement of the new policy.
There are multiple dimensions to consider when designing a choice experiment. This includes the number of attributes, the number of levels, the range of levels, the number of alternative options presented to respondents and the number of choice cards[5] (Mariel et al., 2021). An experimental design for the pilot questionnaire was generated using ngene, a specialist software package[6]. The experimental design consisted of 36 choice cards, separated into 6 blocks of 6. Each respondent was randomly allocated to a block and then asked to complete 6 choice cards. Respondents were offered three options to choose from in each choice card. The first two options represented different management policy options with different cost levels. The third option was always a ‘no change’ status quo option which had no additional cost attached to it.
3.3 Pilot Testing
A pilot survey was carried out between December 2022 and January 2023, lasting 3 weeks. The purpose of the pilot was to check respondent’s understanding of the choice experiment, identify potential issues with coding on the survey platform and to gather initial results to discuss with the project steering group to inform the final survey design.
A panel of respondents was provided by TGM Research and a total of 222 complete responses were recorded. Respondents took an average of 18 minutes to complete the pilot. A small number of responses were excluded from the total number of completes as they took less than 5 minutes to complete the survey and displayed behaviour consistent with ‘speeding’ through it (e.g. clicking the same response each time). Despite a relatively small sample, the pilot sample broadly aligned with the target population across age and sex (see Table 1).
| Characteristics | Pilot (% of total) | National (% of total) | |
|---|---|---|---|
| Age group | 16-24 | 15% | 12% |
| 25-34 | 18% | 17% | |
| 35-44 | 16% | 15% | |
| 45-54 | 16% | 16% | |
| 55-64 | 15% | 17% | |
| 65-+ | 21% | 23% | |
| Sex | Female | 53% | 51% |
| Male | 47% | 49% |
Figures may not sum due to rounding.
Results from the pilot suggested respondents had a good understanding of the trade-offs in the choice experiment presented to them. A mixture of open-ended and multi-choice questions were posed to respondents after they completed the choice tasks. These questions were designed to test respondent’s understanding of the choice tasks and allow them to feedback suggestions for design improvements.
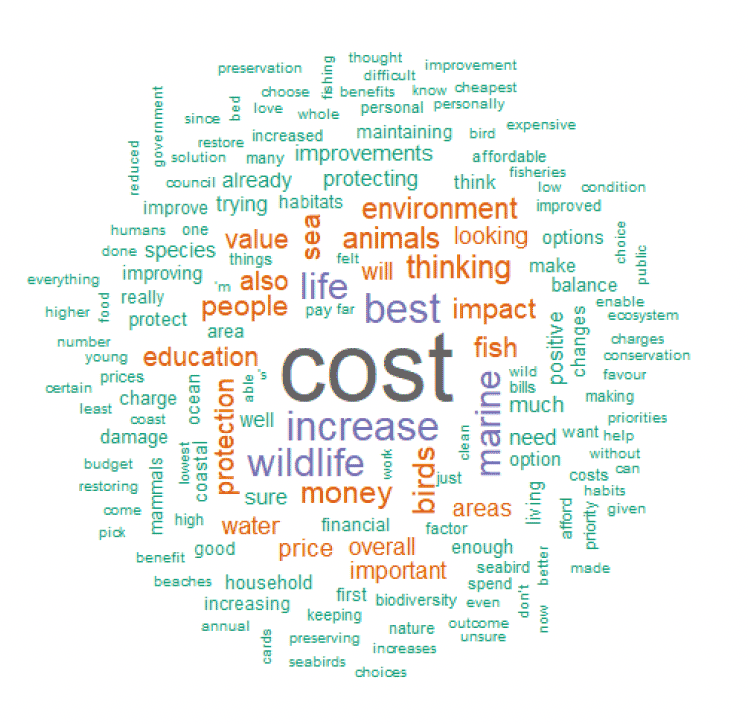
Respondents were asked an open-ended question about what they were generally thinking about when completing the choice cards. Results from this question indicated that respondents were trading-off the attributes with the cost attribute as expected (e.g. see Box 1). Further evidence of this is displayed in Figure 4, which shows that in response to this question, ‘cost’ was the most common word used by respondents. These results indicated that the payment vehicle was working as expected and it was therefore included in the final design.
Box 1: Example responses to follow up question
Q. Could you please describe what you were generally thinking about when making your choices for the choice cards?
- ‘I was looking at an affordable cost first compared to what you were receiving in exchange’
- ‘What was best value for money with the options presented’
- ‘Being able to help and increase the quantity of Scotland’s wildlife but also being affordable for me ‘
- ‘I was looking at value for money as well as overall cost.’
- ‘I was thinking about what is best for the marine life and what was best for the budget’
- ‘Impact vs cost/ what you get for the money’
- ‘The cost to myself with the best option’
- ‘I was thinking what would be the best overall while getting a balance between the cost to people and the good to the environment’
- ‘The cost v benefit’
- ‘The cheapest but most effective choices’
- ‘Balance between protecting nature and increase in household costs’
- ‘Price and marine life’
Another follow-up question was included which involved asking respondents whether they had any suggestion to improve the design of the choice cards. The majority of respondents (70%) did not have any suggestions; however, some respondents did suggest introducing visual aids. This suggestion was taken forward to improve the final design (see Section 3.4 below).
A final question asked respondents how they found the pilot survey. 89% of respondents said it was ‘interesting’ or ‘educational’ and only 2% of respondents said that it was ‘difficult to understand’. Overall, the pilot survey provided useful insights to inform the final questionnaire.
3.4 Final Choice Experiment Design
The attributes and levels used to describe the options presented to respondents were continuously developed and refined throughout the survey design phase. Results from the pilot led to a number of enhancements to the framing of attributes. In response to pilot results and steering group discussions, attributes relating to the size of area changed and distance to coast were included to provide respondents with additional context and increase the applicability of results to different policy settings. Visual aids were added to attribute descriptions and the framing of attributes was refined to aid understanding based on respondent’s feedback in the follow-up questions. The final list of attributes and their levels are described below (summarised in Table 2
| Attribute | Levels |
|---|---|
| Size of area where change occurs | 2.5% of total sea area |
| 5% of total sea area | |
| 7.5% of total sea area | |
10% of total sea area |
|
| Distance to coast | Inshore (from the coast out to 12 nautical miles (22 kilometres)) |
Offshore (from 12 nautical miles out from the coast to 200 nautical miles out from the coast (370 kilometres)) |
|
| Wildlife and habitats | Very small increase |
| Small increase | |
| Medium increase | |
Large increase |
|
| Type of restrictions | None |
| Low | |
| Moderate | |
High |
|
| Educational boards | No |
| Yes | |
| Annual household water charge increase | £10 |
| £20 | |
| £30 | |
| £50 | |
| £70 | |
£100 |
The experimental design of the final choice experiment followed the same structure as the pilot questionnaire, with 36 choice cards separated into 6 blocks. The final survey questionnaire can be found in Annex 3 and an example choice card can be found in Figure 5 below.
| Option A | Option B | Option C | |
|---|---|---|---|
| Size of area where change occurs | 5% of total sea area | 7.5% of total sea area | No Change |
| Distance to coast | Inshore | Inshore | |
| Wildlife and habitats | Medium increase | Small increase | |
| Type of restrictions | Moderate | Low | |
| Educational boards | No | No | |
| Annual household water charge increase | £50 | £50 |
3.4.1 Attribute 1: Size of area where change occurs
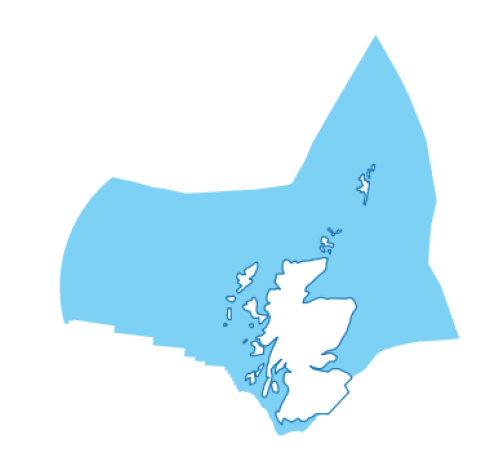
The size of area where the change could occur was included as an attribute. This was described to respondents in terms of its percentage compared to Scotland’s total sea area. To help contextualise the size of area that could be impacted by management policies, respondents were informed that Scotland’s seas are nearly six times larger than the land area of Scotland. A visual aid in the form of a graphic showing the extent of Scotland’s seas was also provided (see Figure 6). The levels were selected to represent a plausible range of sea area that may be changed based on current management policy commitments.
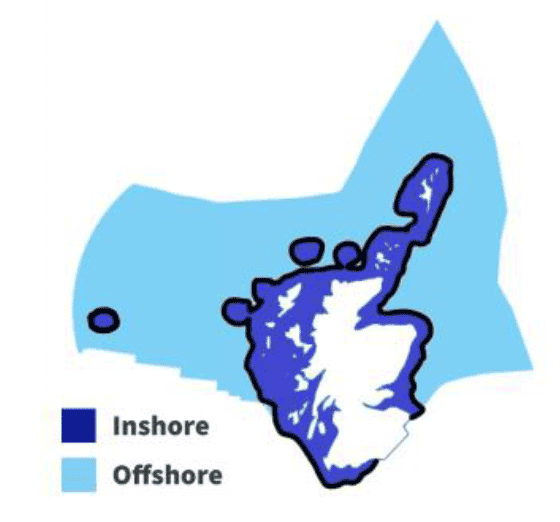
3.4.2 Attribute 2: Distance to coast
An attribute related to how far from the coast the new management policies could be introduced was included. Previous research suggests that people hold significant non-use values for offshore marine environments (Börger et al. 2014; Jobstvogt et al. 2014). However, there is limited evidence to show the extent to which people in Scotland have preferences for management policies closer or further away from the coast. It was described to respondents that management policies could either be introduced inshore (from the coast to 12 nautical miles) or offshore (from 12 to 200 nautical miles). A visual aid was also provided to show the extent of Scotland’s inshore and offshore sea regions (see Figure 7).
3.4.3 Attribute 3: Type of restrictions
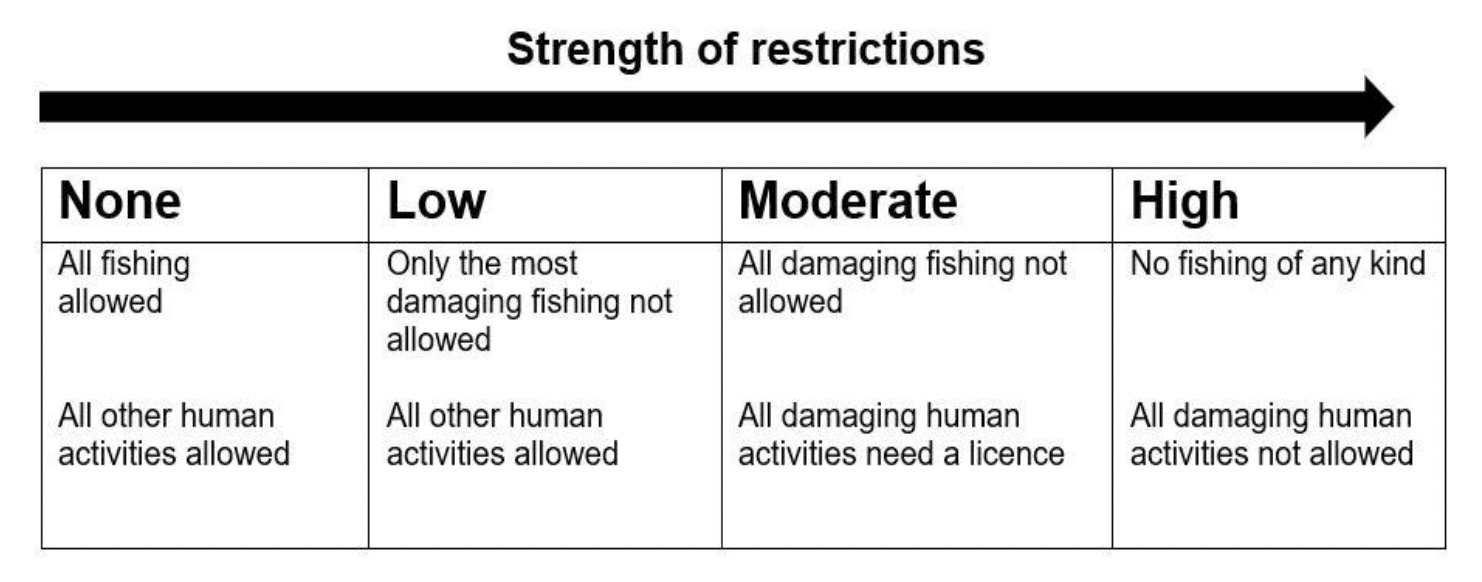
A key element of protecting marine biodiversity is reducing the environmental impact of human activities. Area-based measures such as Marine Protected Areas are one of the most commonly used approaches for doing so. This led to an attribute related to the type of restrictions on human activities being included in the choice experiment. It was explained to respondents that new management policies could introduce restrictions on human activities that cause damage to marine wildlife and habitats. Respondents were informed that non-damaging recreational activities would not be impacted by any restrictions.
The levels of attributes were selected based on the different types of restrictions that are typical of Marine Protected Areas. This ranged from no restrictions to high restrictions, which was described as no fishing of any kind and all damaging human activities not allowed. Figure 8 shows the description that respondents were provided for each level of restriction.
3.4.4 Attribute 4: Wildlife and habitats
The Scottish Government’s Biodiversity Strategy to 2045 sets out ambition for Scotland to be Nature Positive by 2030 and to have restored and regenerated biodiversity across the country by 2045[7]. The Blue Economy Vision sets out a long-term outcome for Scotland’s marine ecosystems to be healthy and functioning, with nature protected and activities managed using an ecosystem-based approach to ensure negative impacts on marine ecosystems are minimised and, where possible, reversed[8]. Given this policy context, it was important to include an attribute linked to marine biodiversity.
Previous literature highlights the need to present the complex concept of biodiversity in an easy to understand format (Christie et al., 2006; La Notte et al., 2021). According to a recent survey, around 67% of people in Scotland reported that they felt like they know or have heard of and have some understanding of marine biodiversity (Scottish Government, 2022) This resulted in careful consideration of how to communicate biodiversity in the choice experiment.
There are several examples in the literature that have successfully used simpler proxies for biodiversity (Christie et al., 2006; Börger et al. 2014; eftec, 2022; Jobstvogt et al. 2014; Hynes et al., 2021; La Notte et al., 2021). Approaches have included (but are not limited to) describing biodiversity in terms of the number and/or variety of overall wildlife and/or habitats, the number of specific species or the chance of encountering wildlife and/or habitats.
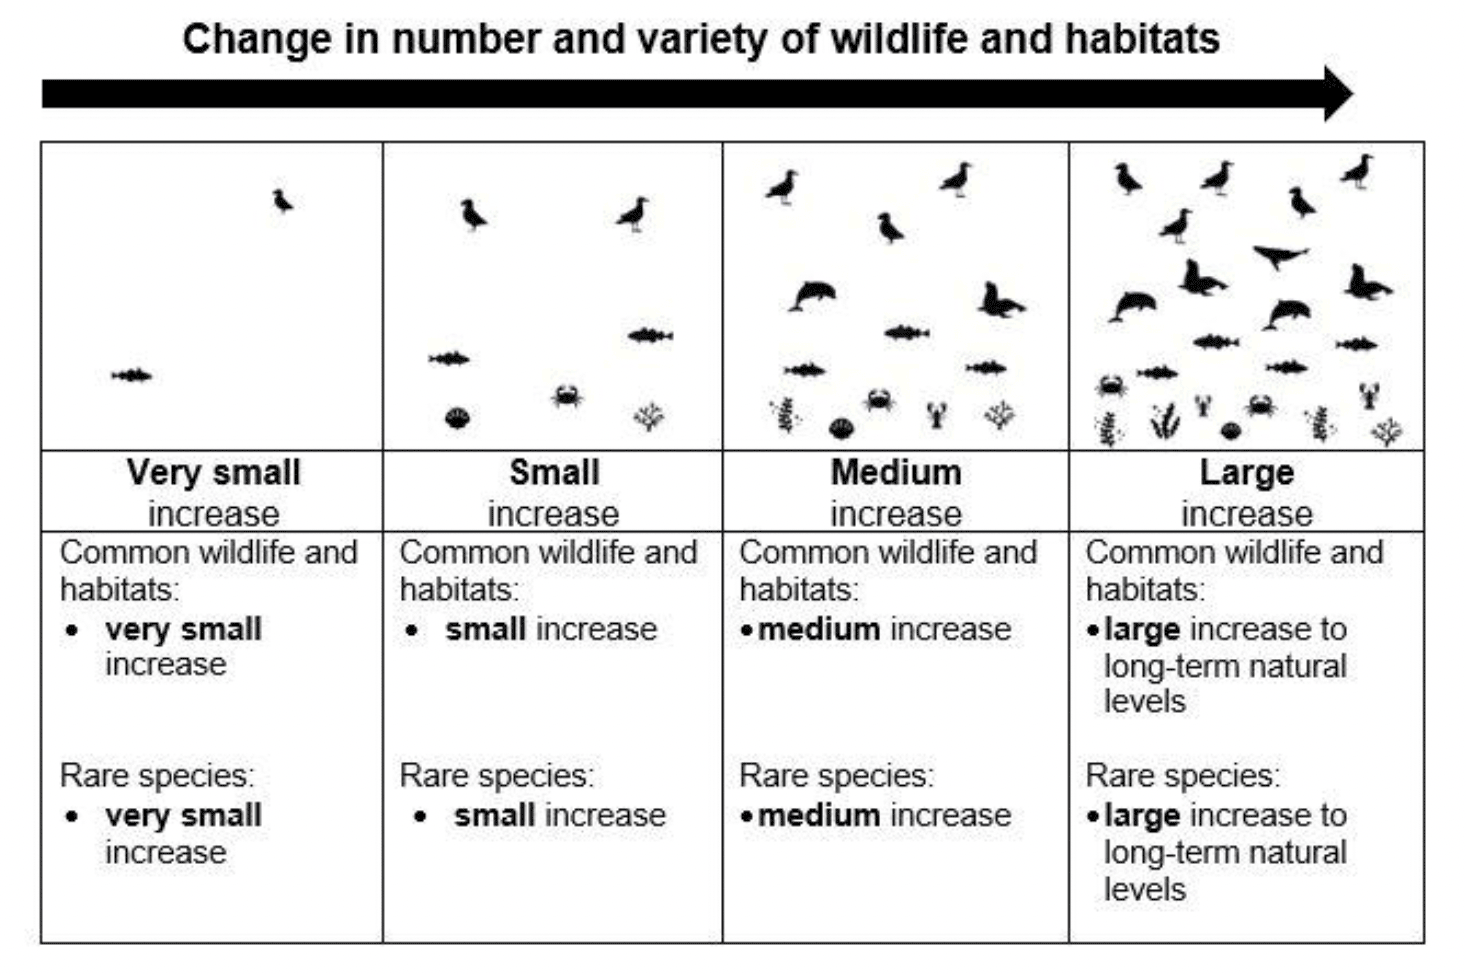
In this choice experiment, the number and variety of wildlife and habitats was used to describe biodiversity in an easier to understand way. Respondents were informed that new management policies could impact the number and variety of wildlife and habitats. It was then explained that these changes might happen on the seafloor and not be visible to the general population.
The change presented to respondents was represented by an increase in today’s situation, with levels ranging from ‘very small increase’ to ‘large increase’ (see Figure 9). The ‘large increase’ level was described to respondents as a large increase to long-term natural levels for both rare and common species. The range of levels was therefore intended to cover the full range of potential wildlife and habitat increases, from a very small increase all the way to what could be considered as full species presence.
3.4.5 Attribute 5: Educational boards
An attribute related to the provision of educational content in marine and coastal areas around Scotland. Respondents were informed that new management policies could updated existing information boards and install new board with educational content for all ages. This content would be focused on wildlife and habitats in marine and coastal areas around Scotland. This was included to test whether respondents had preferences for additional educational content. As with the other attributes, a visual aid was provided (see Figure 10).

3.4.6 Payment vehicle
The payment vehicle used in the final choice experiment was household’s annual water charge. As described above, this was thought to meet the conditions of being realistic, credible, familiar and binding for all respondents to as great an extent as possible (Johnston et al., 2017). Results from the pilot showed that respondents were trading-off the payment vehicle with other attributes as expected and did not indicate any issues.
3.5 Structure of Final Survey Questionnaire
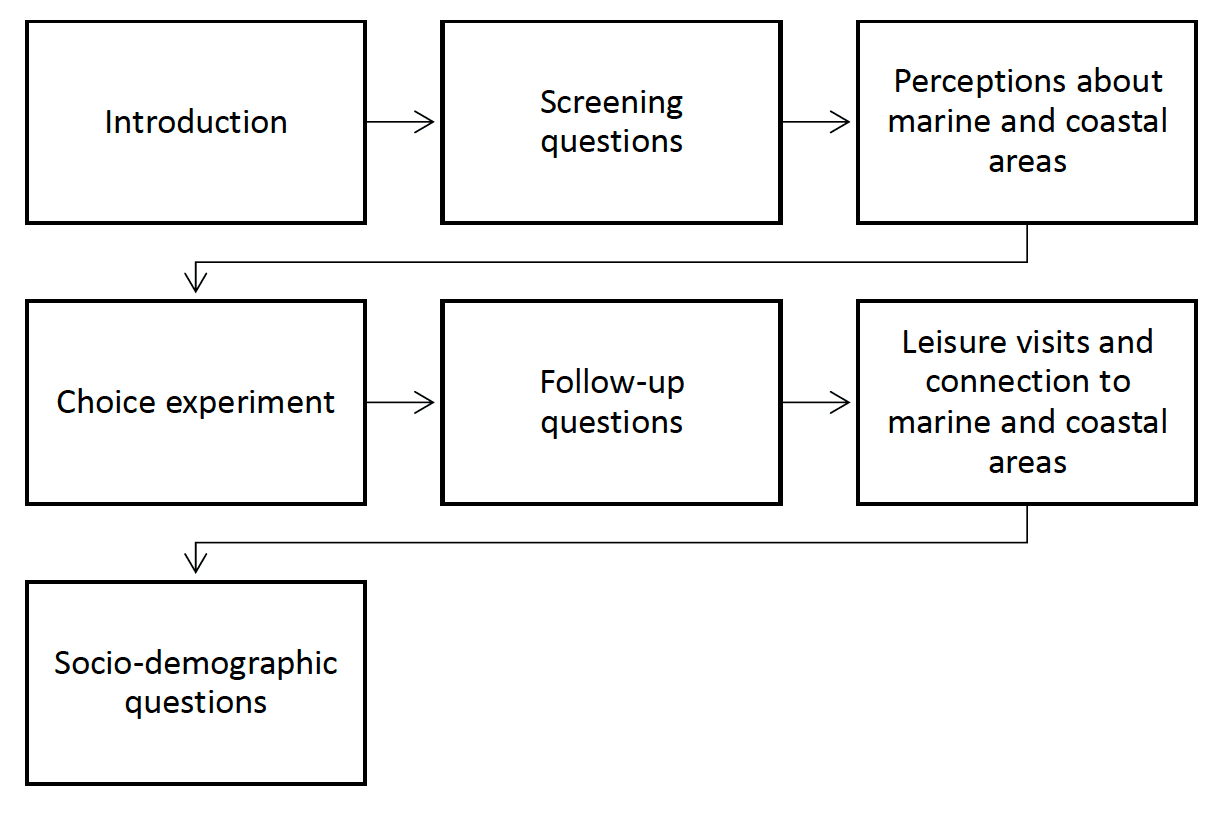
The structure of the final survey followed a similar format to the pilot (see Figure 11). Respondents were first introduced to the survey and a definition of ‘marine and coastal areas’ was provided[9]. Screening questions followed for quota monitoring purposed. Respondents were then presented with a series of questions on their perception of marine and coastal areas and the impact of human activities that use these areas. They then proceeded to the choice experiment section of the survey. A range of follow-up questions were included after the choice experiment to check respondent’s understanding and identify potential ‘protest’ respondents (see Section 3.6). There was then a section focused on their interactions with the marine and coastal areas, including leisure visits and connection to the coast. The survey concluded with questions about their socio-demographic background. The survey questionnaire can be found in Annex 3.
3.6 Question for Identifying Protestors
“Protestors” refer to respondents who are unwilling to give any answers at all (Bateman et al., 2002). Protestors can lead to inconsistent valuation estimates and it is therefore important to detect them (Meyerhoff and Liebe 2010).
It is common practice to identify protest behaviour by using additional follow-up questions to examine the reasons why respondents repeatedly selected the status quo option in a choice experiment (Jonhston et al., 2017; Mariel et al., 2021). Additional follow-up questions are important as systemically selecting the status quo option may not necessarily indicate rejection of the choice experiment. Instead, it may be the case that respondents are genuinely not willing to pay anything for the good or service offered to them (Bateman et al., 2002).
To identify protestors in this choice experiment, a follow-up question about reasons for not supporting payment was included. This was used to help to distinguish between genuine zero bids (those that do not value management policies at all) with protest responses. This was intended to allow for assessment of the sensitivity of results to protest responses.
3.7 Sampling Approach
The sampling approach aimed to achieve a nationally representative sample of Scotland’s population based on age, sex and geographical area. Quotas were based on national statistics and in a similar way to the pilot, but with an additional quota for geographical area (local authorities). Quotas were not specified for other characteristics such as education levels or household income, although questions on socio-demographics were included at the end of the survey to assess how survey sample characteristics compare to the national population. Table 3 summarises the sampling quotas.
| Characteristics | Target (% of total) | |
|---|---|---|
| Age group | 16-24 | 12% |
| 25-34 | 17% | |
| 35-44 | 15% | |
| 45-54 | 16% | |
| 55-64 | 17% | |
| 65-+ | 23% | |
| Sex | Female | 51% |
| Male | 49% | |
| Local Authority | Aberdeen City | 4.2% |
| Aberdeenshire | 4.8% | |
| Angus | 2.1% | |
| Argyll and Bute | 1.6% | |
| City of Edinburgh | 9.6% | |
| Clackmannanshire | 0.9% | |
| Dumfries and Galloway | 2.7% | |
| Dundee City | 2.7% | |
| East Ayrshire | 2.2% | |
| East Dunbartonshire | 2.0% | |
| East Lothian | 2.0% | |
| East Renfrewshire | 1.8% | |
| Falkirk | 2.9% | |
| Fife | 6.8% | |
| Glasgow City | 11.6% | |
| Highland | 4.3% | |
| Inverclyde | 1.4% | |
| Midlothian | 1.7% | |
| Moray | 1.8% | |
| Na h-Eileanan Siar (Western Isles) | 0.5% | |
| North Ayrshire | 2.4% | |
| North Lanarkshire | 6.2% | |
| Orkney Islands | 0.4% | |
| Perth and Kinross | 2.8% | |
| Renfrewshire | 3.3% | |
| Scottish Borders | 2.1% | |
| Shetland Islands | 0.4% | |
| South Ayrshire | 2.1% | |
| South Lanarkshire | 5.9% | |
| Stirling | 1.7% | |
| West Dunbartonshire | 1.6% | |
| West Lothian | 3.4% | |
Source: Mid-Year Population Estimates | National Records of Scotland (nrscotland.gov.uk). Figures may not sum due to rounding.