How much do people in Scotland value characteristics of marine and coastal areas
This report summarises the results of a choice experiment survey that was designed to capture the preferences of Scottish people towards the management of marine and coastal areas in Scotland.
4. Results
This section details the results from the final survey questionnaire. This includes a breakdown of the sample characteristics and analysis of selected survey questions, choice experiment results and follow-up questions[10].
4.1 Survey Sample Characteristics
After identifying and removing respondents who took less than 5 minutes (identified as speeders) or did not complete the survey, a total of 986 complete responses were recorded. On average, respondents took 19 minutes to complete the survey. 3% of the total complete responses were identified as exhibiting potential ‘protester’ behaviour (see Section 3.6 and 4.5 for more detail)[11].
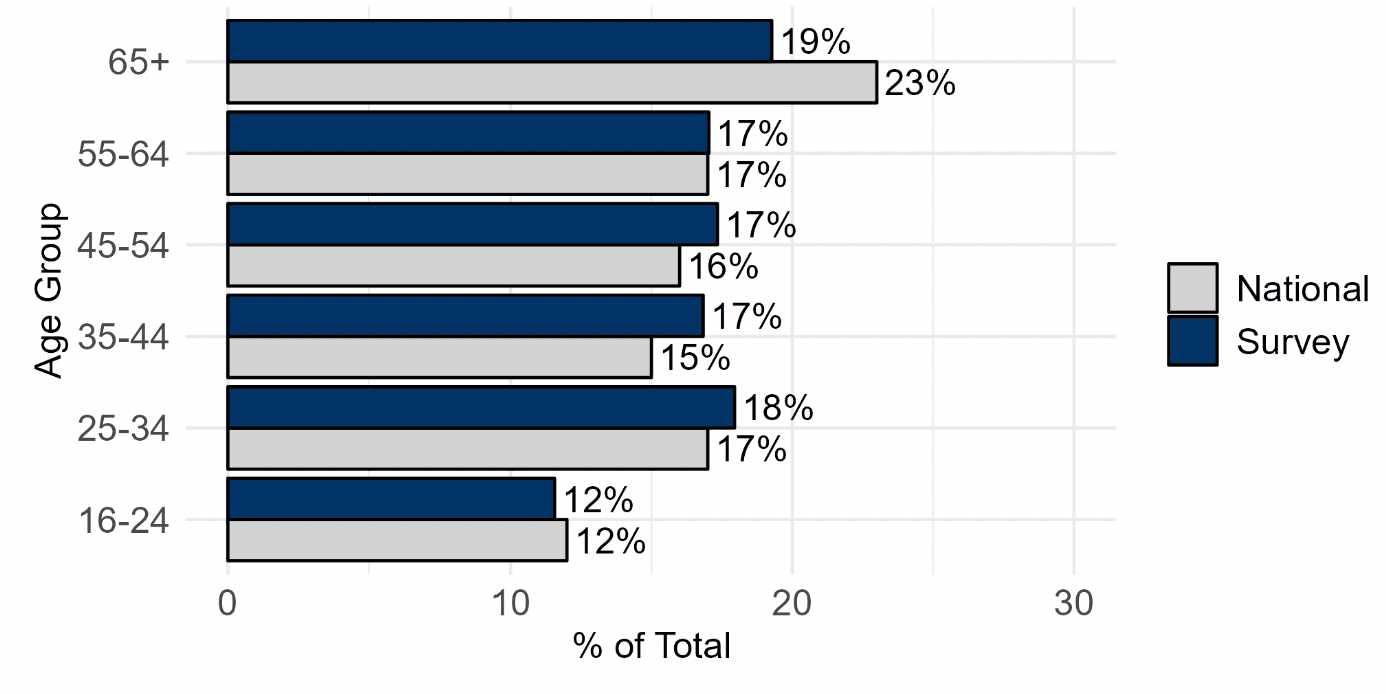
The representativeness of the survey sample has been assessed by comparing the age, sex and local authority area breakdown against national statistics for Scotland’s population[12].
Figure 12 shows that the age breakdown of the survey sample broadly follows that of national statistics. All age categories are within 0-2 percentage points of the national level, apart from the 65+ age group which is within 4 percentage points.
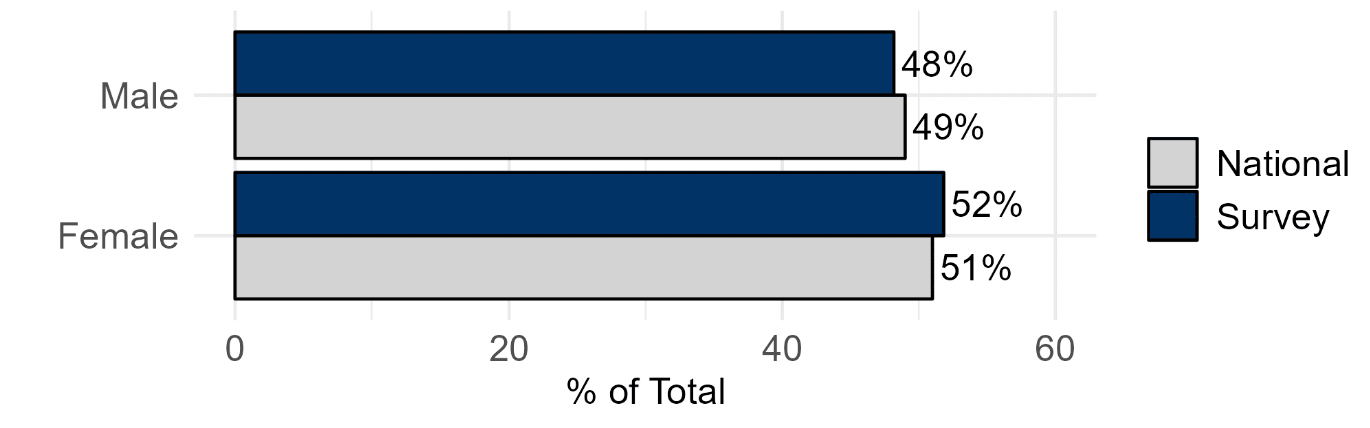
The sex split of the survey sample compared to national statistics is shown in Figure 13. The survey sample had a 48/52% male/female split compared the national population, which has a 49/51% split.
A breakdown of the local authority areas where survey respondents live is presented in Table 4. Overall, the survey sample had a wide geographical spread, reflecting the population structure of Scotland.
| Local Authority Area | Survey (% of total) | National (% of total) |
|---|---|---|
| Aberdeen | 4.6 | 4.2 |
| Aberdeenshire | 5.5 | 4.8 |
| Angus | 2.1 | 2.1 |
| Argyll & Bute | 1.3 | 1.6 |
| Clackmannanshire | 0.8 | 0.9 |
| Dumfries & Galloway | 2.2 | 2.7 |
| Dundee | 2.4 | 2.7 |
| East Ayrshire | 2.2 | 2.2 |
| East Dunbartonshire | 2.0 | 2.0 |
| East Lothian | 1.8 | 2.0 |
| East Renfrewshire | 1.8 | 1.8 |
| Edinburgh | 10.3 | 9.6 |
| Falkirk | 3.3 | 2.9 |
| Fife | 7.4 | 6.8 |
| Glasgow | 12.1 | 11.6 |
| Highland | 2.3 | 4.3 |
| Inverclyde | 1.4 | 1.4 |
| Midlothian | 1.7 | 1.7 |
| Moray | 2.4 | 1.8 |
| Na h-Eileanan Siar (Western Isles) | 0.5 | 0.5 |
| North Ayrshire | 2.7 | 2.4 |
| North Lanarkshire | 5.2 | 6.2 |
| Orkney | 0.1 | 0.4 |
| Perth & Kinross | 2.7 | 2.8 |
| Renfrewshire | 3.2 | 3.3 |
| Scottish Borders | 2.2 | 2.1 |
| Shetland | 0.4 | 0.4 |
| South Ayrshire | 2.2 | 2.1 |
| South Lanarkshire | 6.0 | 5.9 |
| Stirling | 1.7 | 1.7 |
| West Dunbartonshire | 1.4 | 1.6 |
| West Lothian | 3.5 | 3.0 |
As discussed in section 3.7, specific quotas were not set for other individual characteristics such as income, education or employment status. However, a series of questions about respondent’s socio-demographics were included at the end of the survey to allow for further comparison of the sample against national levels. Table 5 contains a summary of this comparison.
| Characteristic | Survey (% of total) | National (% of total) |
|---|---|---|
| Median household income | £30,001-£40,000 | £29,000 |
| Education level of degree or higher | 40% | 32% |
| Employed | 59% | 76% |
The median income range of the sample was £30,001-£40,000 and the mode was £20,001-£30,000, compared to a national median household of approximately £29,000. 5% of respondents preferred not to disclose their household income.
40% of the sample stated that they had a bachelor’s degree or higher level of qualification, compared to national levels of around 32%. When asked about their employment status, 59% of the sample stated that they are in either full-time, part-time or self-employment, compared to national levels of around 76%.
When asked whether they were part of an environmental organisation, 87% of the sample answered no, 9% said yes and 4% chose to not answer the question. 20% of the sample stated that either they or a close family or friend worked or depended largely on a marine industry, these respondents were therefore classified as having an ‘industrial connection’[14].
4.2 Perceptions about Marine and Coastal Areas in Scotland
Respondents were asked a series of questions about their perceptions of the environmental condition and impact of human activities on marine and coastal areas in Scotland. These questions were intended to introduce the survey topic to respondents and gather initial information about their general views and experiences.
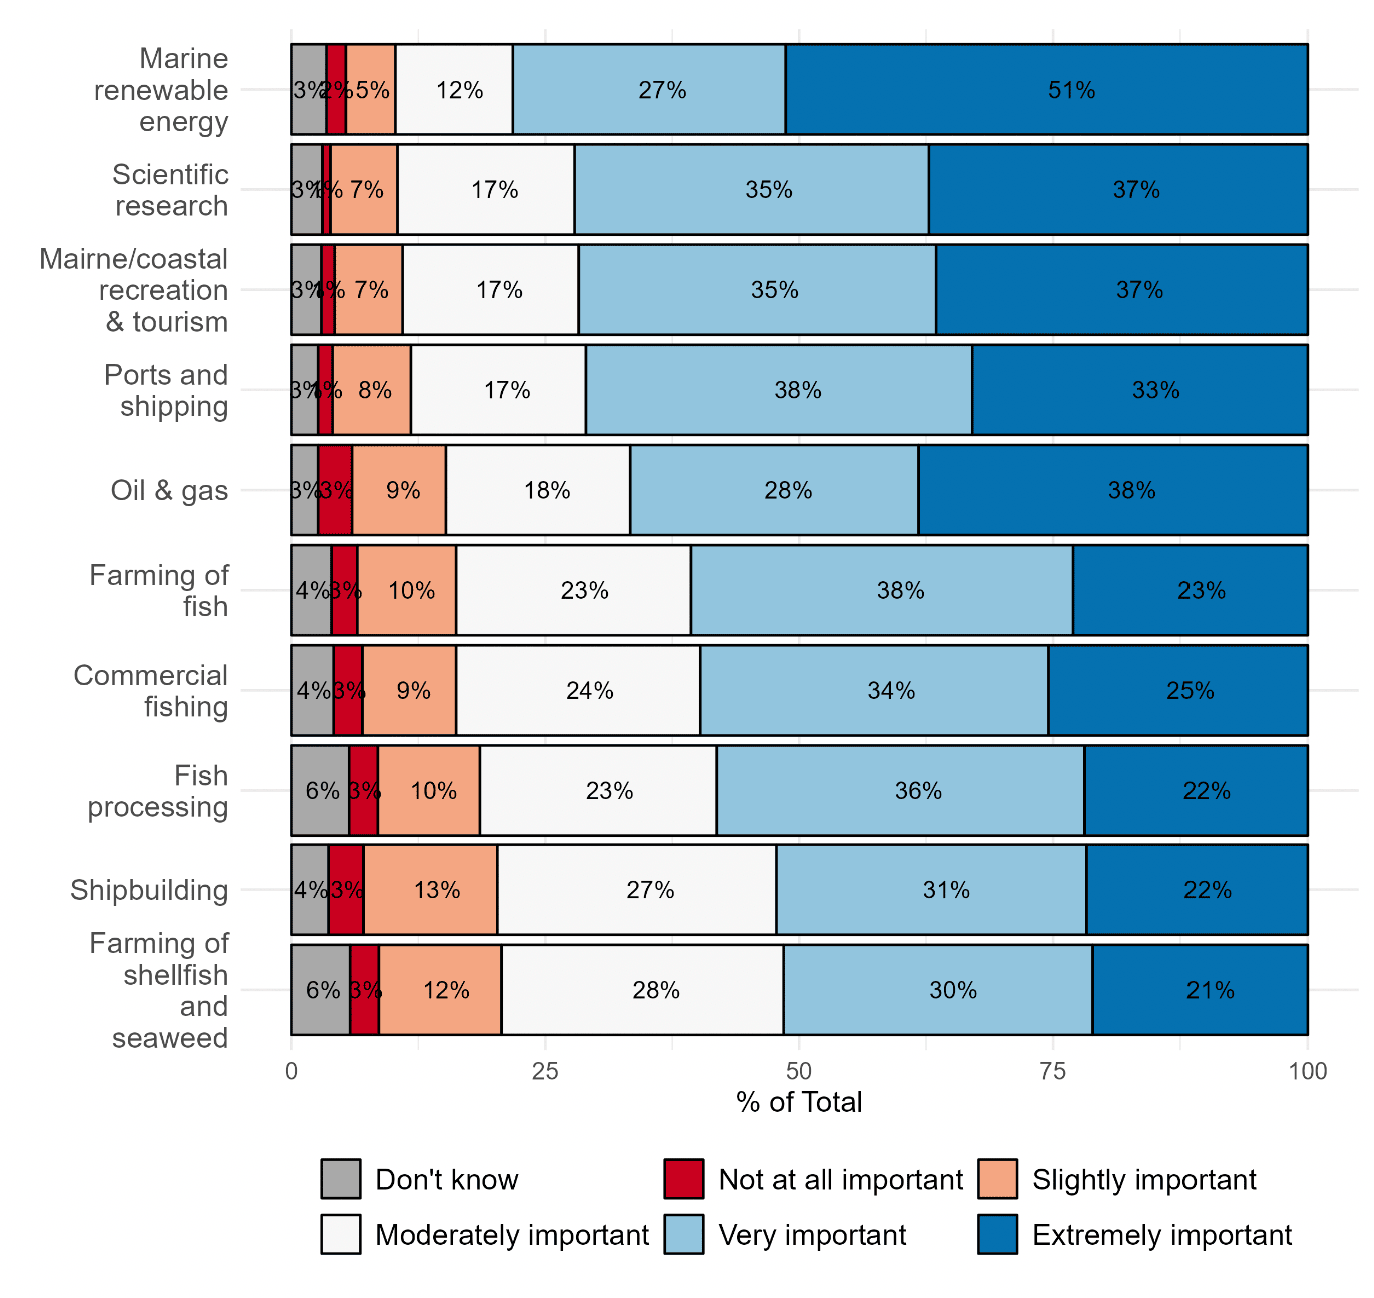
Figure 14 shows respondent’s opinions about the importance of marine industries for Scotland’s future. Marine renewable energy was the industry that respondents felt was the most important, with 78% of respondents considering it as ‘very’ or ‘extremely’ important. Respondents considered farming of shellfish and seaweed to be the least important, with 51% considering it as ‘very’ or ‘extremely’ important.
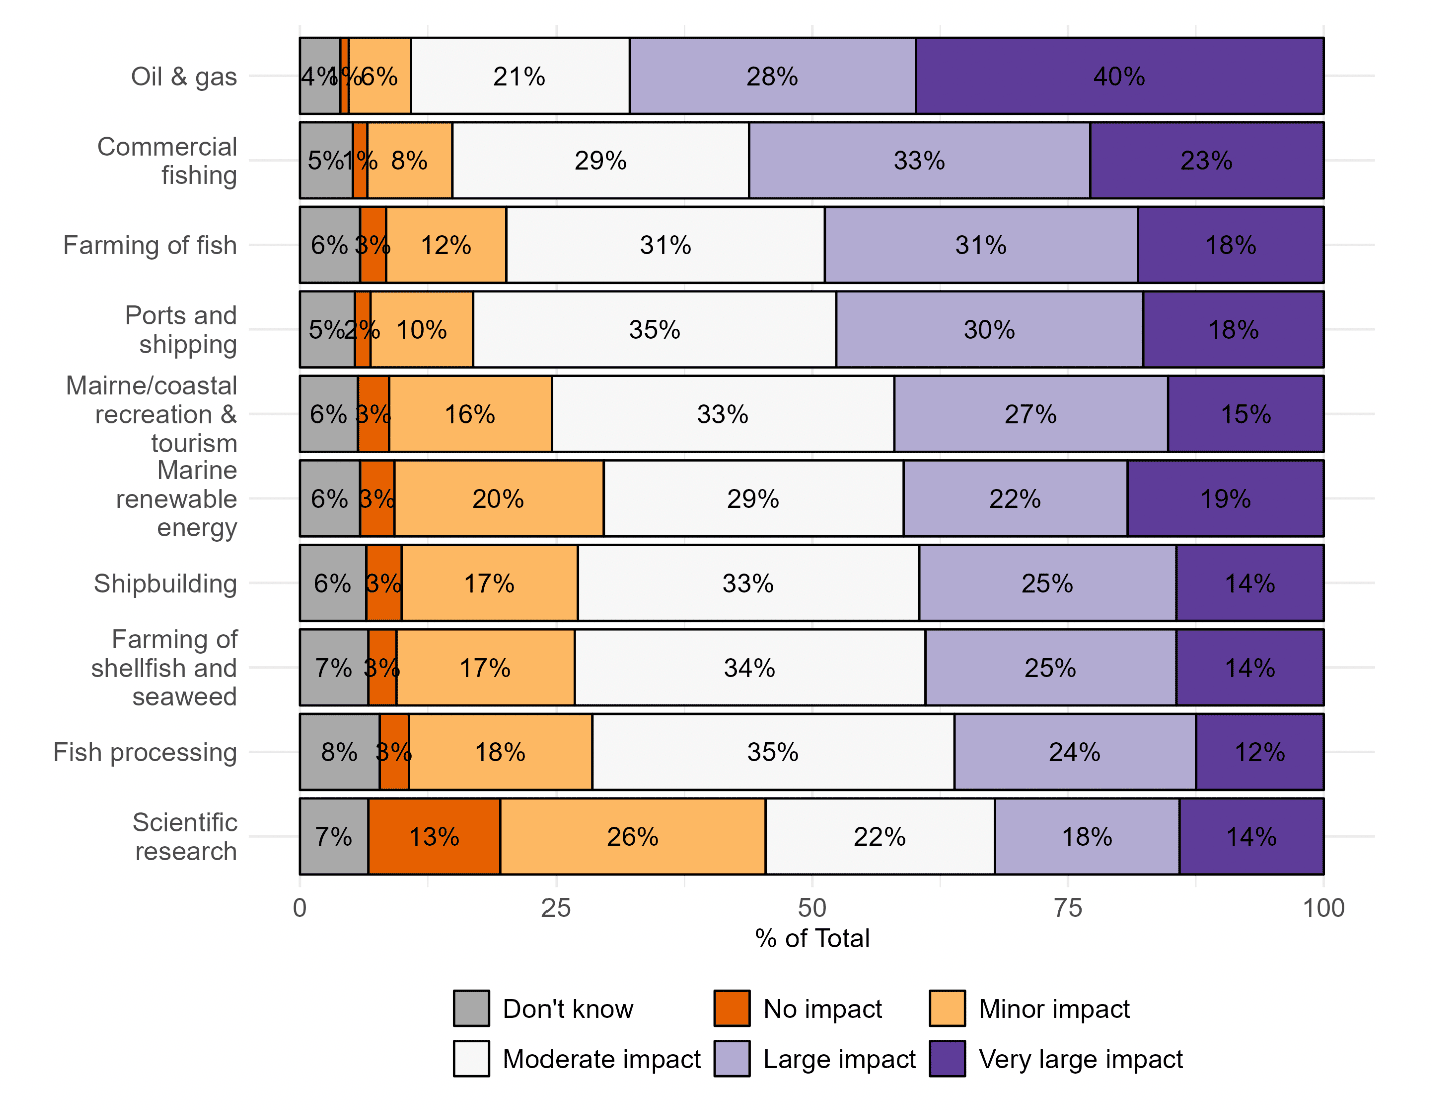
Respondents were asked to state what impact they thought industries had on the environmental condition of marine and coastal areas in Scotland. As shown in Figure 16, the oil & gas industry was considered to have the largest environmental impact, with 68% of respondents thinking that the industry had a ‘very large’ or ‘large’ impact. In comparison, scientific research was the industry respondents thought to have the least impact, with 32% thinking the industry had a ‘very large’ or ’large impact.
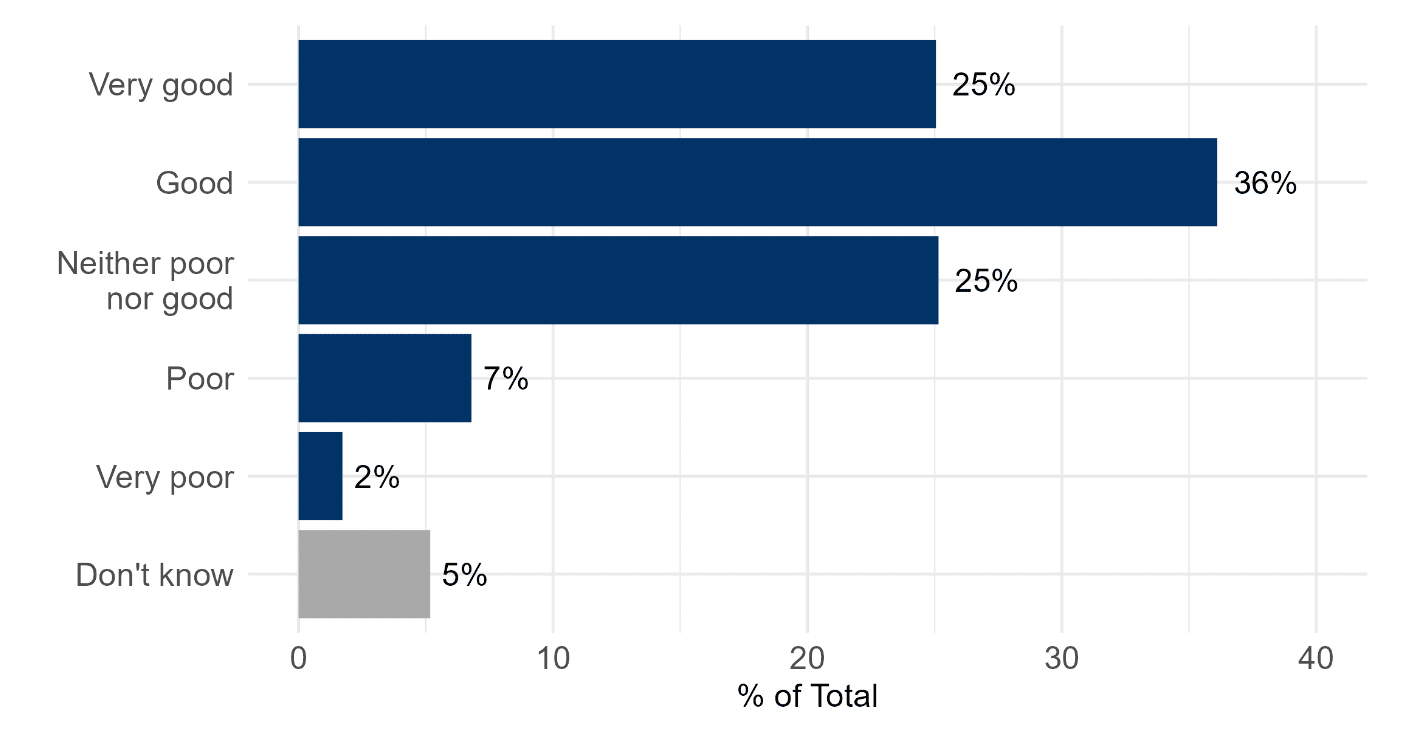
In response to a question about their personal experiences of Scotland’s marine wildlife and habitats (see Figure 17), 61% of respondents rated their experiences as either ‘very good’ or ‘good’. Only 9% of respondents reported to have had ‘poor’ or ‘very poor’ experiences, with a further 30% answering ‘neither poor nor good’ or ‘don’t know’.
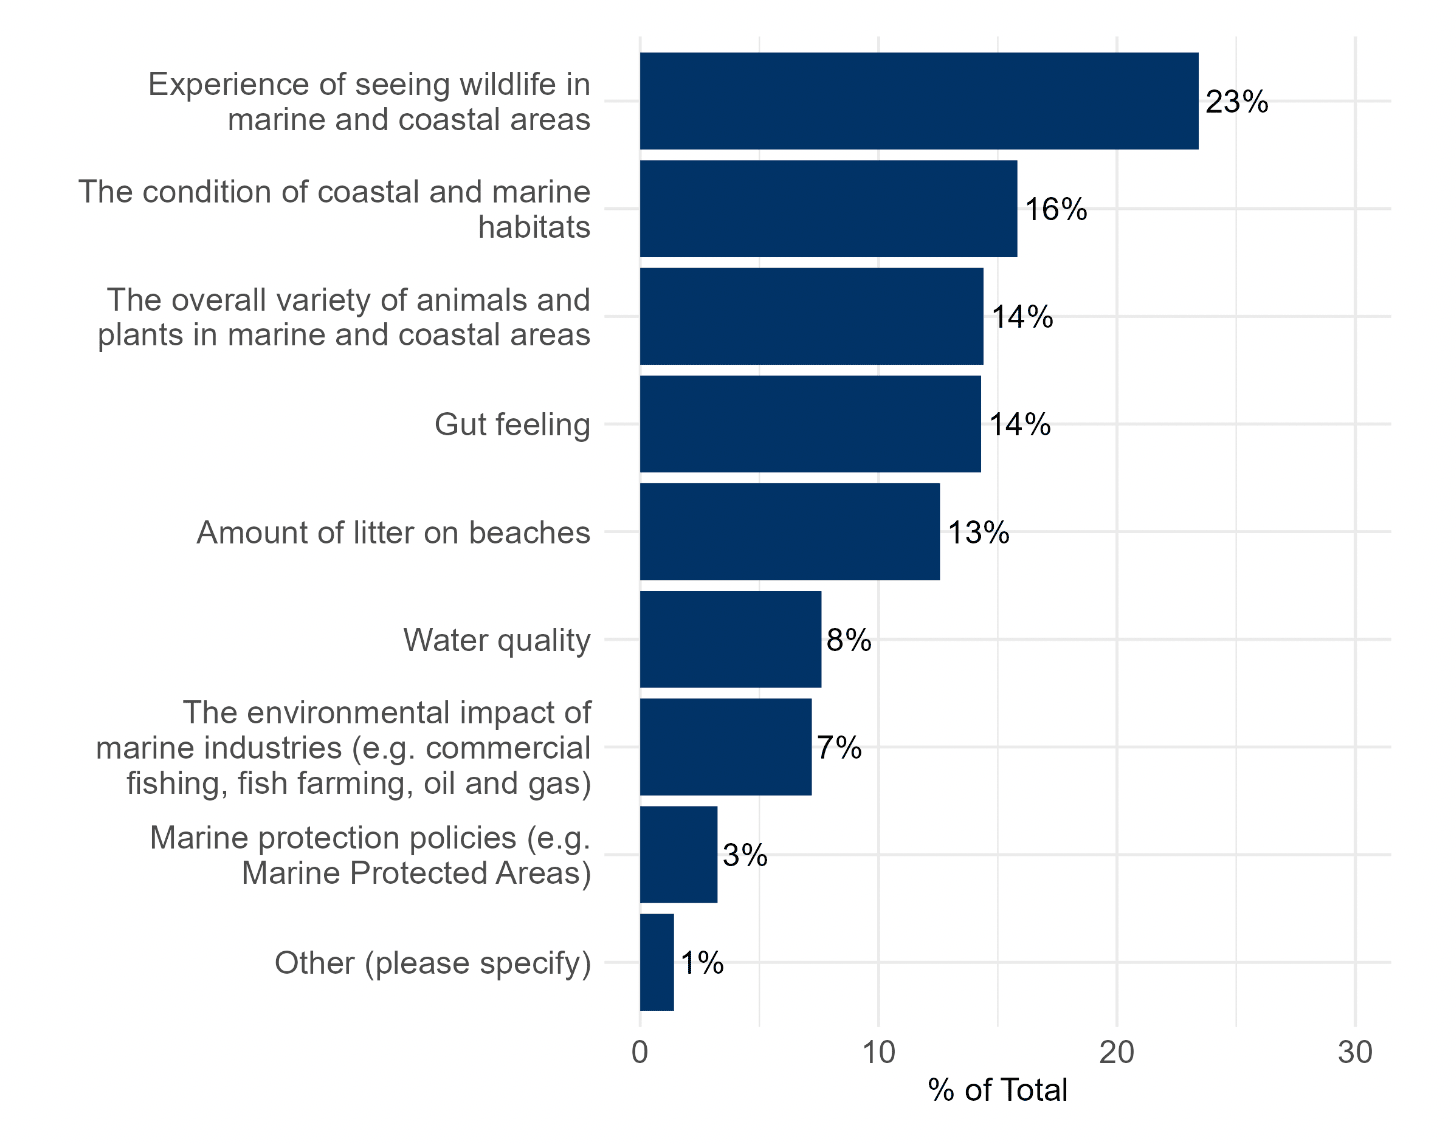
As a follow-up to the question about their personal experiences of Scotland’s marine wildlife and habitats, respondents were asked what they were thinking about the most when they answered that question. Answers to this question are summarised in Figure 18, which shows respondents had a broad range of answers when thinking about their personal experiences of wildlife and habitats. The ‘experience of seeing wildlife in marine and coastal areas’ was what the highest proportion of respondents thought about, with 23% selecting this option. ‘The condition of coastal and marine habits’, ‘the overall variety of animals and plants in marine and coastal areas’ and ‘gut feeling’ had the next highest proportions, with 16%, 14% and 14% respectively.
Respondents were asked what they thought has happened to the overall environmental condition of marine and coastal areas in Scotland in the past 5 years (Figure 19). 19% of respondents thought that the environmental condition had improved, 36% thought it had stayed the same and 33% thought it had worsened. The remaining 11% said that they did not know.

4.3 Leisure Visits to Marine and Coastal Areas
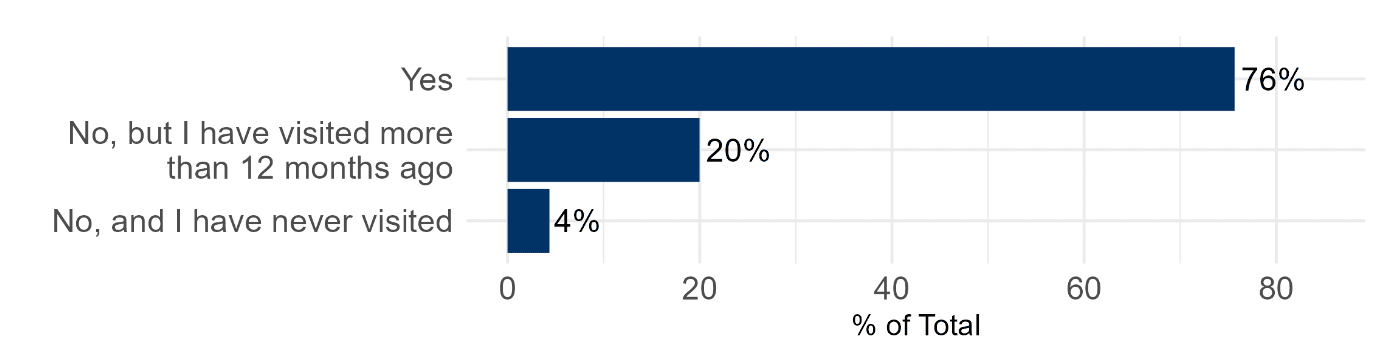
The majority of respondents (76%) had visited a marine or coastal area in Scotland in the last 12 months (see Figure 20). 20% stated that although they had not visited in the last 12 months they had before. Only 4% of respondents had never visited.
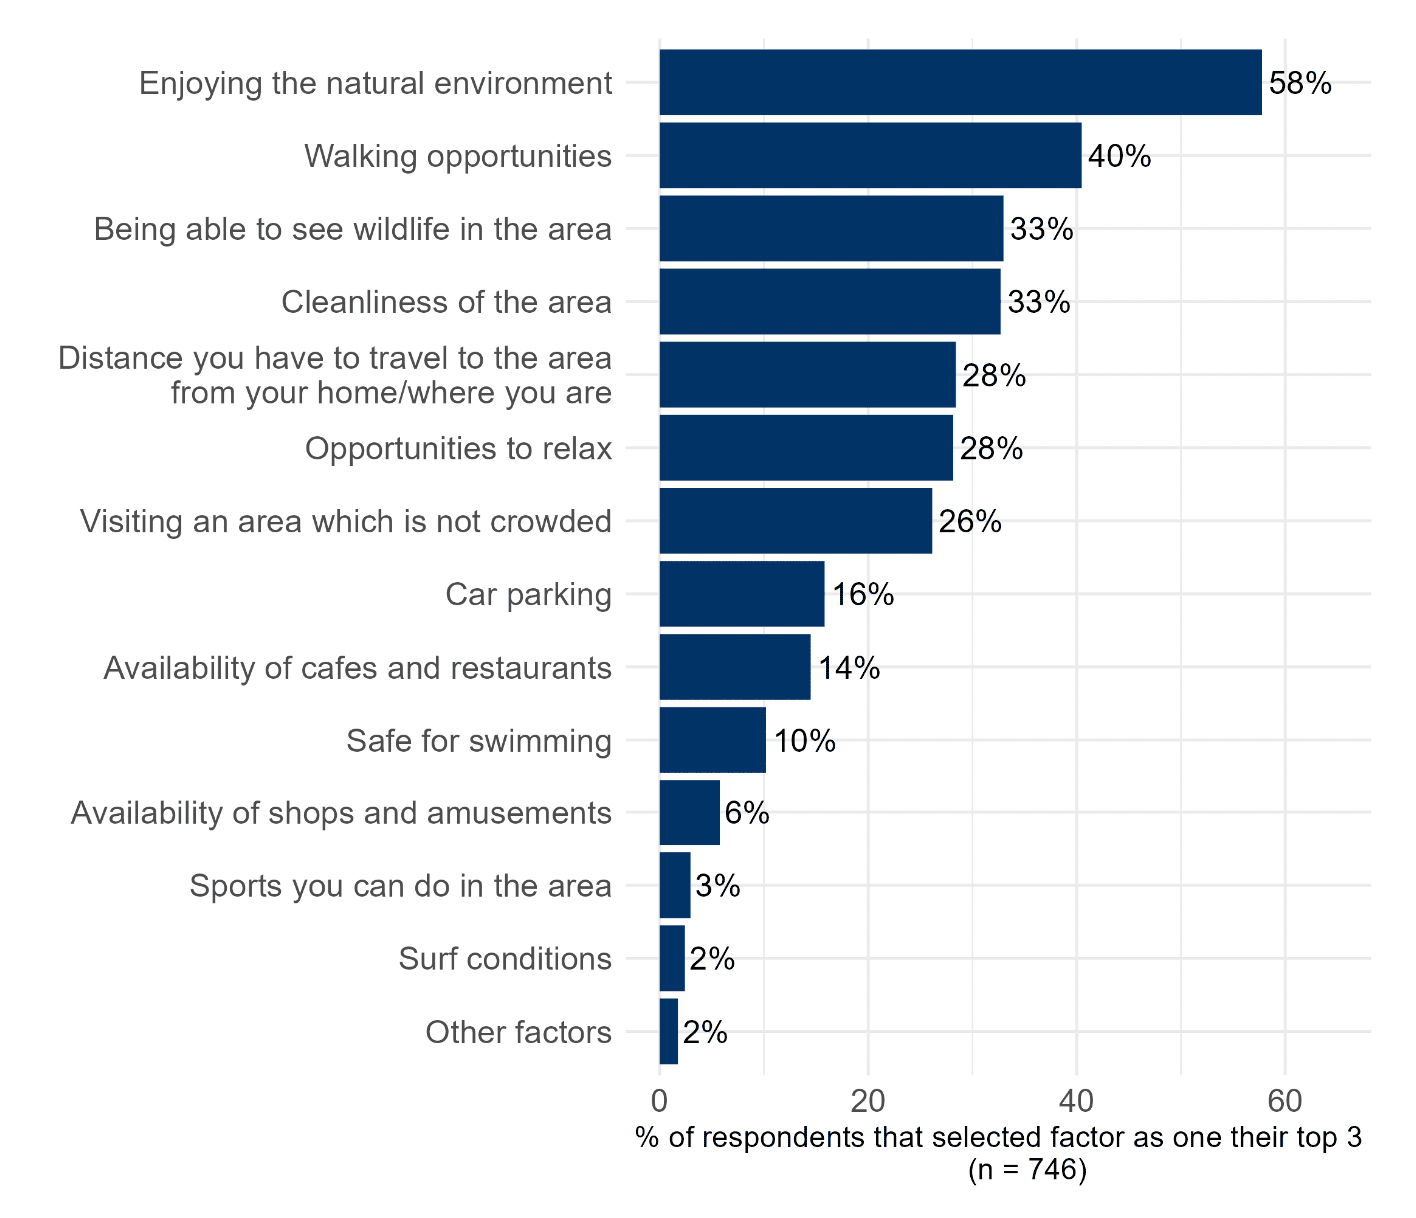
Respondents who had visited a marine or coastal area in Scotland in the last 12 months were asked the top 3 factors they consider when deciding which area to visit (see Figure 21). ‘Enjoying the natural environment’ was the most frequently considered factor, featuring in 57% of responses to this question. ‘Walking opportunities’ and ‘Being able to see wildlife in the area’ were the next two most frequently considered. “Surf conditions” was the least considered factor, featuring in only 2% of responses.
Of those that had visited a marine or coastal area in Scotland in the last 12 months (n = 746), the majority of respondents (75%) stated that ‘walking/hiking/running at the coast’, ‘dog walking’ or ‘wildlife watching’ was the leisure activities they considered to be most important[15] (see Figure 22).
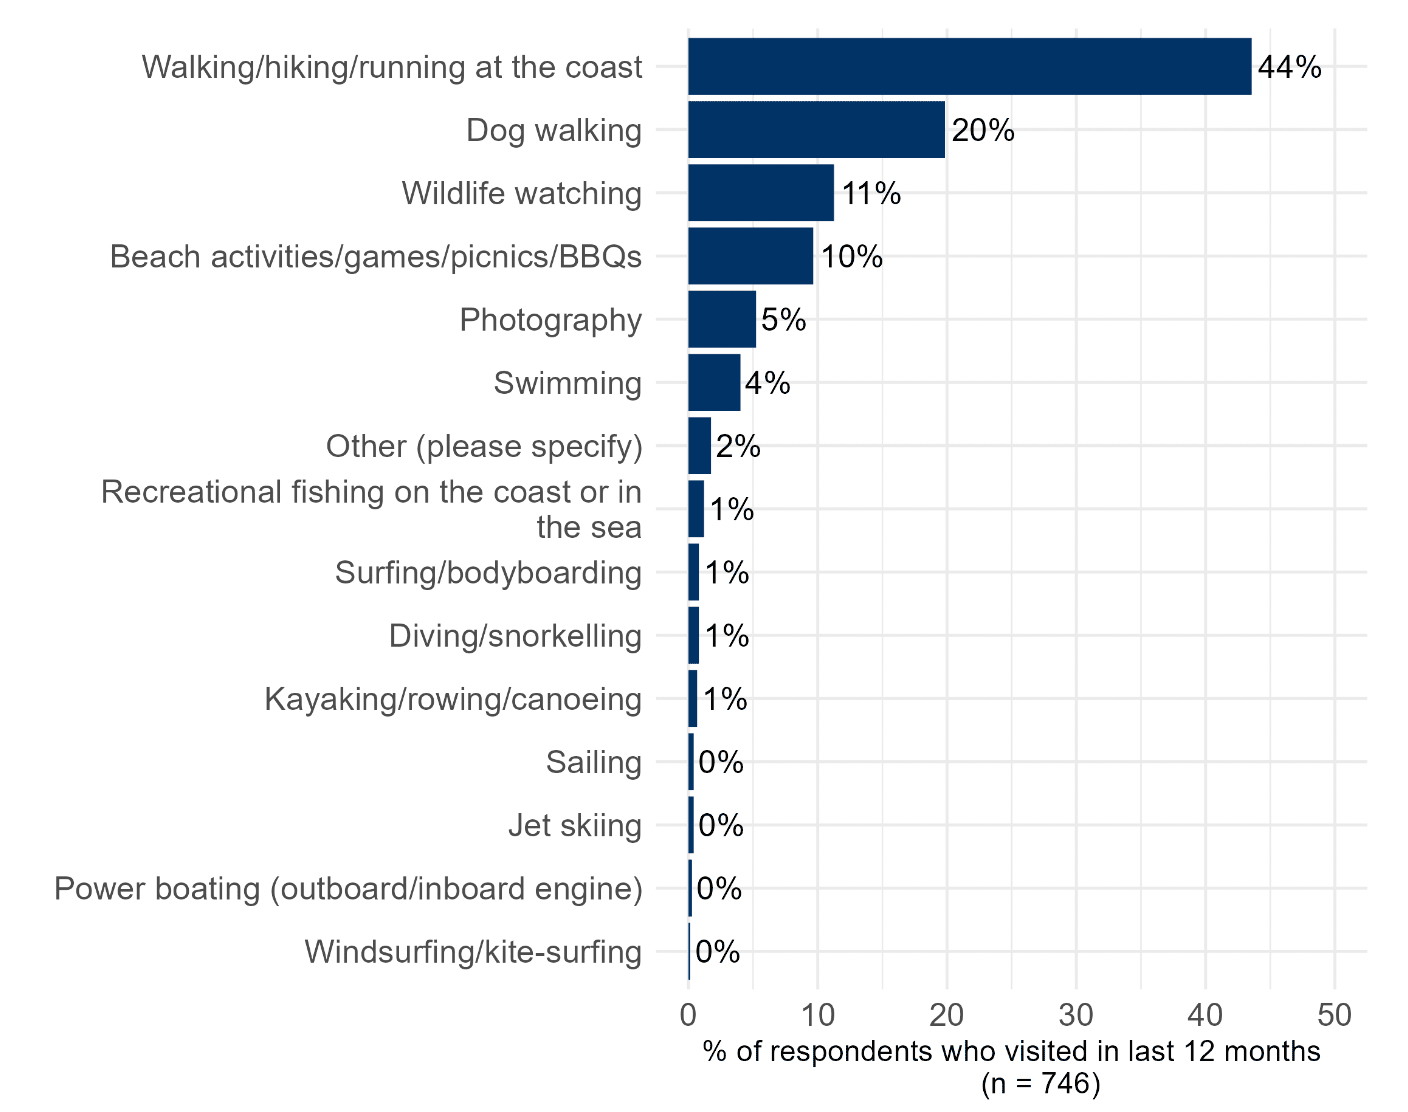
Note: percentages have been rounded to nearest whole digit.
4.4 Choice Experiment Analysis
4.4.1 Approach
The overall aim of the choice experiment analysis was to assess respondent’s preferences for alternative management options for marine and coastal areas in Scotland. Responses were analysed using conditional and mixed logit econometric models. The first step in the modelling approach involved examining the extent to which each attribute had a significant influence on respondent’s choice and whether respondent’s had positive or negative preferences for more of each attribute. This then allowed for the estimation of respondent’s willingness to pay (WTP) for marginal changes in each of the attributes, which provides a more useful unit of measurement. The determinants of preferences were also assessed using a mixed logit model. Full model outputs can be found in Annex 4.
4.4.2 Preferences for Attributes of Marine and Coastal Areas
Preferences for attributes of marine and coastal areas included in the choice experiment were initially assessed using a conditional logit model. Model results reveal whether respondents have positive or negative preferences for each attribute, the extent to which each attribute influenced respondent’s choices and whether this is statistically significant. A summary of the conditional logit model results is presented in Table 6.
| Attribute | Coefficient | Standard Error |
|---|---|---|
| Price (annual household water charge) | -0.016*** | 0.001 |
| Size of area changed (1% of total sea area increase) | 0.031** | 0.010 |
| Distance to coast (inshore) | (reference level) | (reference level) |
| Distance to coast (offshore) | 0.030 | 0.047 |
| Wildlife and habitats (very small increase) | (reference level) | (reference level) |
| Wildlife and habitats (small increase) | -0.001 | 0.077 |
| Wildlife and habitats (medium increase) | 0.373*** | 0.063 |
| Wildlife and habitats (large increase) | 0.688*** | 0.067 |
| Type of restrictions (none) | (reference level) | (reference level) |
| Type of restrictions (low) | 0.322*** | 0.076 |
| Type of restrictions (moderate) | 0.391*** | 0.072 |
| Type of restrictions (high) | 0.006 | 0.066 |
| Educational boards (no) | (reference level) | (reference level) |
| Educational boards (yes) | 0.215*** | 0.046 |
| Status quo | -0.459* | 0.180 |
Note: ***, ** and * indicate statistical significance at the 0.1%, 1% and 5% level of confidence, respectively.
The results from the conditional logit model show that:
- Annual household water charge – respondents have significant and negative preferences for this attribute. This means that all else being equal, respondents prefer management policies with lower costs.
- Size of area changed (1% increase) – respondents have significant and positive preferences for a 1% increase in the size of area changed. This means that all else being equal, respondents prefer management policies that result in larger sizes of sea area being changed[16].
- Distance to coast – respondents do not have significant preferences for this attribute. This means that respondent’s choices do not appear to be influenced by whether a management policy occurs in an offshore or inshore area.
- Wildlife and habitats – relative to a ‘very small increase’ , respondents do not have significant preferences for a ‘small increase’ in wildlife and habitats. However, respondents do have significant and positive preferences for a ‘medium increase’ and ‘large increase’, with greater value being attached to a ‘large increase’.
- Type of restrictions – relative to no restrictions, respondents have significant and positive preferences for management policies that involve ‘low restrictions’ and ‘moderate restrictions’, with greater value being attached to ‘moderate restrictions’. Respondents do not appear to have significant preferences for ‘high restrictions’.
- Education boards – respondents have significant and positive preference for this educational content. All else being equal, respondents prefer management policies that result in additional education content.
- Status quo (do nothing) – respondents have significant and negative preferences for the status quo. This means that on average respondents prefer alternative management policies over the do nothing option.
Household marginal WTP estimates for each statistically significant attribute in the conditional logit model are presented in Table 7. WTP has been estimated by taking the marginal rate of substitution between each attribute and the price coefficient from this model. The results show the average amount that respondents are willing to pay for each attribute, relative to the reference level. All results should be considered as average marginal WTP in the context of the scale of area presented to respondents in the choice cards (between 2.5% and 10% of total sea area). All estimates presented below refer to household WTP per year.
Respondents have an average marginal WTP of £1.98 for each additional 1% of total sea area changed by management policies. This result should only be interpreted for the range of area presented in this choice experiment, which was between 2.5% and 10% of total sea area. Preferences may differ beyond the scale that was tested in this choice experiment.
Relative to a ‘very small increase’ in wildlife and habitats, the average WTP for a medium increase is £23.79. Respondents place greater value on a large increase, with an average WTP of £43.85. The large increase was described to respondents as an increase which would see both common and rare species return to ‘long-term natural levels’.
For the type of restrictions attribute, respondents have an average WTP of £20.50 and £24.93 for management policies that involve ‘low’ and ‘moderate’ restrictions, respectively, relative to no restrictions[17]. As explained in Section 3, ‘low’ restrictions were described to respondents as only the most damaging fishing activity is not allowed and all other human activities allowed, while ‘moderate’ restrictions were described as all damaging fishing not allowed and all damaging human activities need a license.
Respondents have an average WTP of £13.69 for updating existing information boards and installing new boards with educational content (for all ages) about wildlife and habitats in marine and coastal areas around Scotland.
Results suggest respondents have a negative WTP for the status quo. This can be interpretated as a positive WTP for alternative management options. Results indicate that respondents have an average WTP of £29.24 for an alternative option presented in the choice cards compared to the status quo do nothing option.
| Attribute | Average (mean) WTP | Lower C.I. | Upper C.I. |
|---|---|---|---|
| Area (1% of total sea area increase) | £1.98 | £0.70 | £3.25 |
| Wildlife and habitats (medium increase) | £23.78 | £15.85 | £31.71 |
| Wildlife and habitat (large increase) | £43.85 | £35.46 | £52.23 |
| Type of restrictions (low) | £20.50 | £10.95 | £30.06 |
| Type of restrictions (moderate) | £24.93 | £15.89 | £33.96 |
| Educational content (yes) | £13.69 | £7.94 | £19.43 |
| Status Quo | -£29.24 | -£6.77 | -£51.70 |
Note: particular caution should be used when applying the area attribute WTP confidence intervals from the conditional logit model as this attribute has a statistically significant standard deviation coefficient in the mixed logit model, suggesting some evidence of preference heterogeneity (see Section 4.4.3).
4.4.3 Determinants of Preferences
Preferences and WTP were further assessed using a mixed logit model. Conditional logit relies on the assumption that all respondents hold the same preferences for the characteristics of marine and coastal areas (i.e. attributes) and that respondents treat each choice card independently. The mixed logit model relaxes these assumptions and can therefore account for preference heterogeneity amongst respondents.
Table 8 reports outputs from the mixed logit model, which shows a similar pattern of preferences for respondents, with the same relative importance rank for each attribute and attribute level. In this table, results are articulated in mean preference for choice attributes and the standard deviation (heterogeneity) among respondents. Since only one standard deviation coefficient is statistically significant (size of area changed), results suggest that overall people hold homogenous preferences for the marine and coastal area attributes assessed in this choice experiment.
| Attribute | Coefficient | Standard Error |
|---|---|---|
| Mean Coefficients | ||
| Price (annual household water charge) | -0.016*** | 0.001 |
| Size of area changed (1% increase) | 0.029** | 0.011 |
| Distance to coast (inshore) | (reference level) | (reference level) |
| Distance to coast (offshore) | 0.032 | 0.049 |
| Wildlife and habitats (very small increase) | (reference level) | (reference level) |
| Wildlife and habitats (small increase) | 0.014 | 0.081 |
| Wildlife and habitats (medium increase) | 0.389*** | 0.067 |
| Wildlife and habitats (large increase) | 0.714*** | 0.070 |
| Type of restrictions (none) | (reference level) | (reference level) |
| Type of restrictions (low) | 0.324*** | 0.080 |
| Type of restrictions (moderate) | 0.406*** | 0.077 |
| Type of restrictions (high) | 0.005 | 0.068 |
| Educational boards (no) | (reference level) | (reference level) |
| Educational Content (yes) | 0.222*** | 0.047 |
| Status quo | -0.507** | 0.189 |
| Standard Deviation Coefficients | ||
| Size of area changed (1% increase) | 0.057* | 0.022 |
| Distance to coast (inshore) | (reference level) | (reference level) |
| Distance to coast (offshore) | 0.051 | 0.183 |
| Wildlife and habitats (very small increase) | (reference level) | (reference level) |
| Wildlife and habitats (small increase) | 0.055 | 0.302 |
| Wildlife and habitats (medium increase) | 0.429 | 0.241 |
| Wildlife and habitats (large increase) | 0.008 | 0.243 |
| Type of restrictions (none) | (reference level) | (reference level) |
| Type of restrictions (low) | 0.217 | 0.254 |
| Type of restrictions (moderate) | 0.061 | 0.273 |
| Type of restrictions (high) | 0.109 | 0.247 |
| Educational boards (no) | (reference level) | (reference level) |
| Educational Content (yes) | 0.023 | 0.181 |
| Status quo | 0.068 | 0.196 |
Note: ***, ** and * indicate statistical significance at the 0.1%, 1% and 5% level of confidence, respectively.
To assess the extent to which respondent’s preferences are determined by their individual characteristics, interactions between the status quo attribute and specific variables that represent respondent’s characteristics were added to the mixed logit model. This was done to identify whether respondent’s individual characteristics appeared to make them less or more likely to choose an alternative management option over the status quo (do nothing) option.
Respondent’s characteristics that were tested in the mixed logit model are described in Table 9. Analysis shows that visitor, regular recreational user, young and industrial connection characteristics affect preferences for the status quo at a statistically significant level. All of these factors appear to have a negative influence on preferences for the status quo, which means that respondents who possess these characteristics tend to dislike the status quo (do nothing) option and prefer alternative management policies. Full model outputs from the mixed logit model with interactions are included in Annex 4.
| Individual characteristics | Description | Influence on preference for status quo option |
|---|---|---|
| Coastal | Respondents who live less than 5 miles from the coast and answered ‘yes’ when asked if they describe the area the live ‘by the coast’ | No significant influence |
| Visitor | Respondents who have visited a marine and coastal area in the last 12 months | Yes – negative influence |
| Regular recreational user | Respondents who do a recreational activity at a marine and coastal areas at least once a fortnight or more | Yes – negative influence |
| Young | Respondents aged between 16-34 | Yes – negative influence |
| Male | Male respondents | No significant influence |
| Industrial connection | Respondents who said that they or a close family or friend work in a marine industry | Yes – negative influence |
4.4.4 Aggregation of WTP Estimates
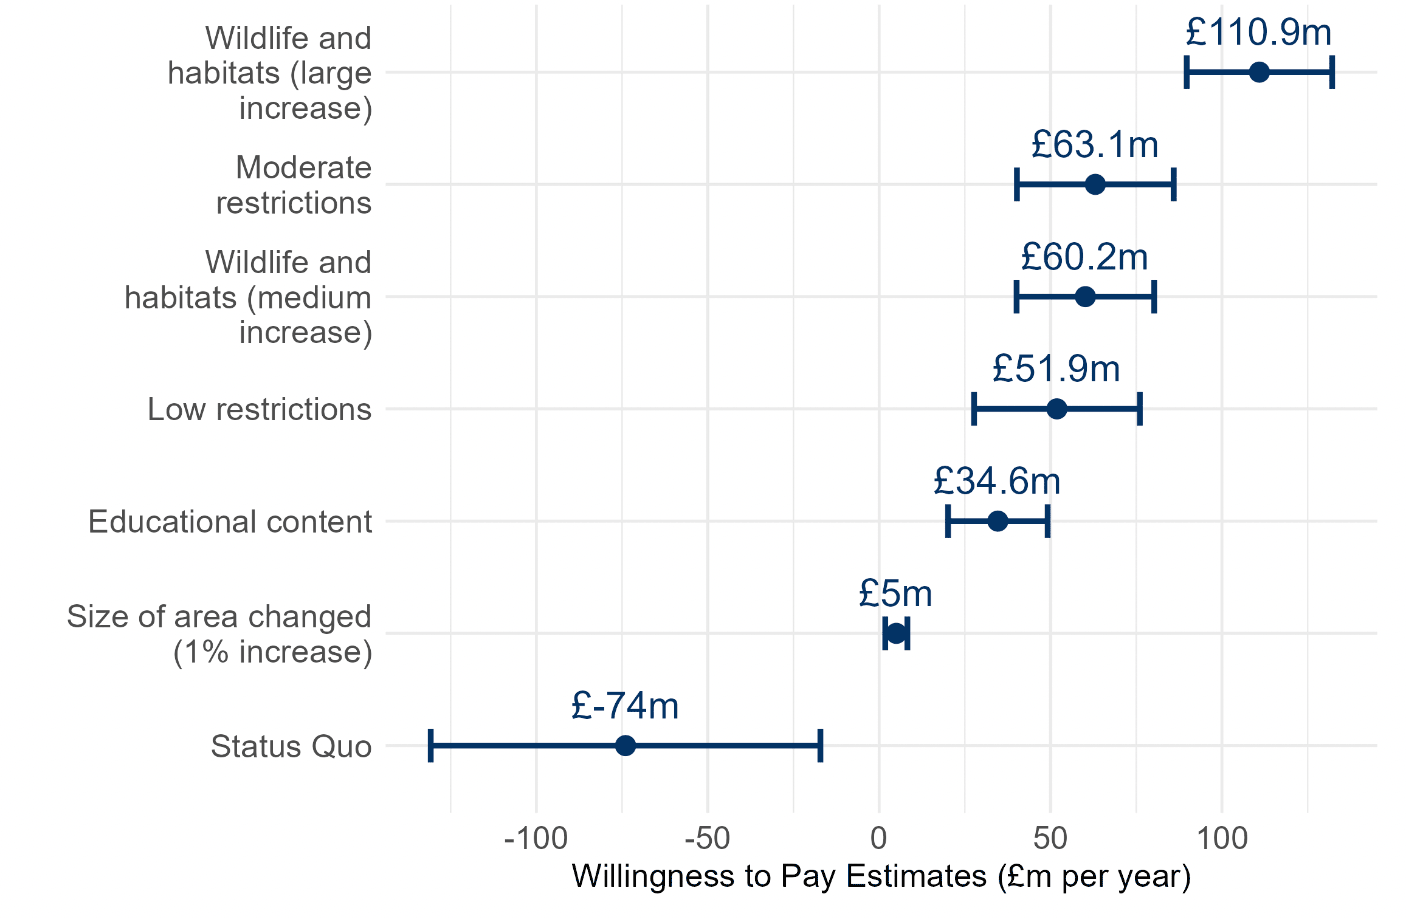
WTP estimates have been aggregated to give indicative total WTP values for the Scottish population. This has been done by applying the average WTP estimates of the survey sample to the total number of households in Scotland (2.53 million). The estimates are summarised in Figure 23 (see Annex 5 for table of results).
As results from the mixed logit model suggested that people tend to have homogenous preferences for the marine and coastal area attributes, aggregate WTP estimates are presented using outputs from the conditional logit model. Results below are presented as a range (95% confidence interval) to account for uncertainty.
Based on the average WTP estimates, model outputs suggest Scottish households are willing to pay between £90m-£132m per year for management policies that result in a ‘large increase’ in wildlife and habitats. This decreases to £40m-£80m per year for a ‘medium’ increase.
Results suggest that households have positive preferences for management policies that involve ‘low’ and ‘moderate’ restrictions on damaging human activities, with aggregate WTP estimates of between £28m-£76m and £40m-£86m per year, respectively.
Households are estimated to be willing to pay around £20m-£49m per year for management policies that involve updating existing information boards and installing new boards with educational content (for all ages) about wildlife and habitats in marine and coastal areas around Scotland.
For every additional 1% of total sea area changed, households are estimated to be willing to pay an additional £2m-£8m per year (within the 2.5% and 10% range of total sea area tested in this choice experiment).
Results suggest that households in Scotland are WTP £17m-£131m for alternative management options (as they have been presented in this choice experiment) over the status quo do nothing option.