How much do people in Scotland value characteristics of marine and coastal areas
This report summarises the results of a choice experiment survey that was designed to capture the preferences of Scottish people towards the management of marine and coastal areas in Scotland.
5. Validity of Results
This section includes an assessment of the validity of results, informed by best-practise guidance documents (Bateman et al., 2002; Johnston et al., 2017; Mariel et al., 2021). Validity has been assessed using two criteria:
1. Construct validity: are the results consistent with expectations?
2. Content validity: was the survey questionnaire clear and understandable for respondents?
5.1.1 Construct Validity
Overall, results from this choice experiment are consistent with expectations. Respondents expressed negative preferences for the cost attribute (increase in household water charge), which means that, all else being equal, results suggest that respondents prefer options with lower costs. This is consistent with economic theory and prior expectations.
As discussed in Section 2.3, there are a limited number of other stated-preferences valuation that have been undertaken in a Scottish marine context. It is therefore difficult to compare the results from this study with other studies. Although it’s not possible to directly compare values, results broadly align with previous research which suggests people in Scotland generally have positive preferences for improving the environmental condition of marine and coastal areas (e.g. Jobstvogt et al. 2014; McVittie and Moran, 2010; Philips et al. (2018).
5.1.2 Content Validity
Following the choice tasks, respondents were asked a series of follow-up questions to assess their understanding of the choice experiment and motivations for their choices.
Respondents were asked on a scale of 1 (not at all) and 5 (completely), how clear did they think the choice cards presented were. Results of this question are displayed in Figure 24. Overall, results suggest that respondents felt the choice cards were clearly presented, with only 2% selecting the ‘not at all’ clear option and the majority of respondents (90%) selecting 3 or above.
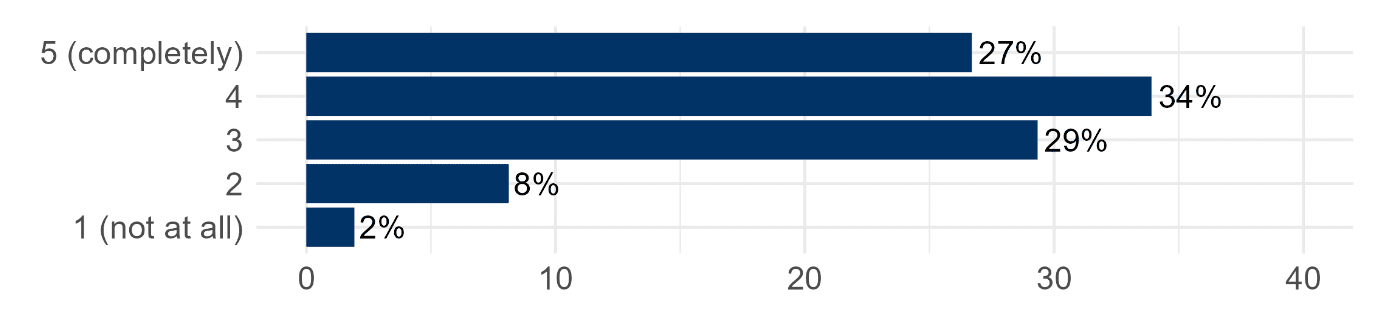
Figures may not sum due to rounding.
A similar question was asked about how sure respondents were of their choices (see Figure 25). 18% of respondents stated that they were completely sure of their choices and 2% stated that they were not at all sure.
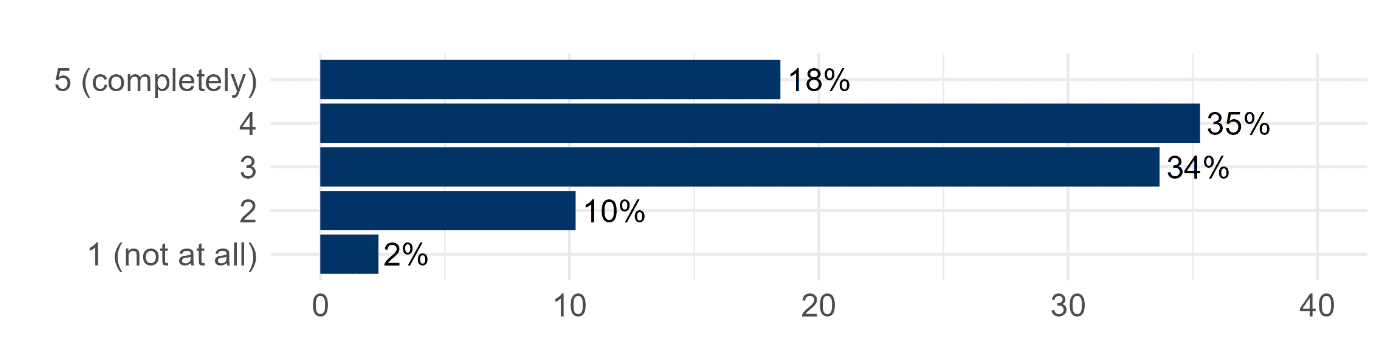
Figures may not sum due to rounding.
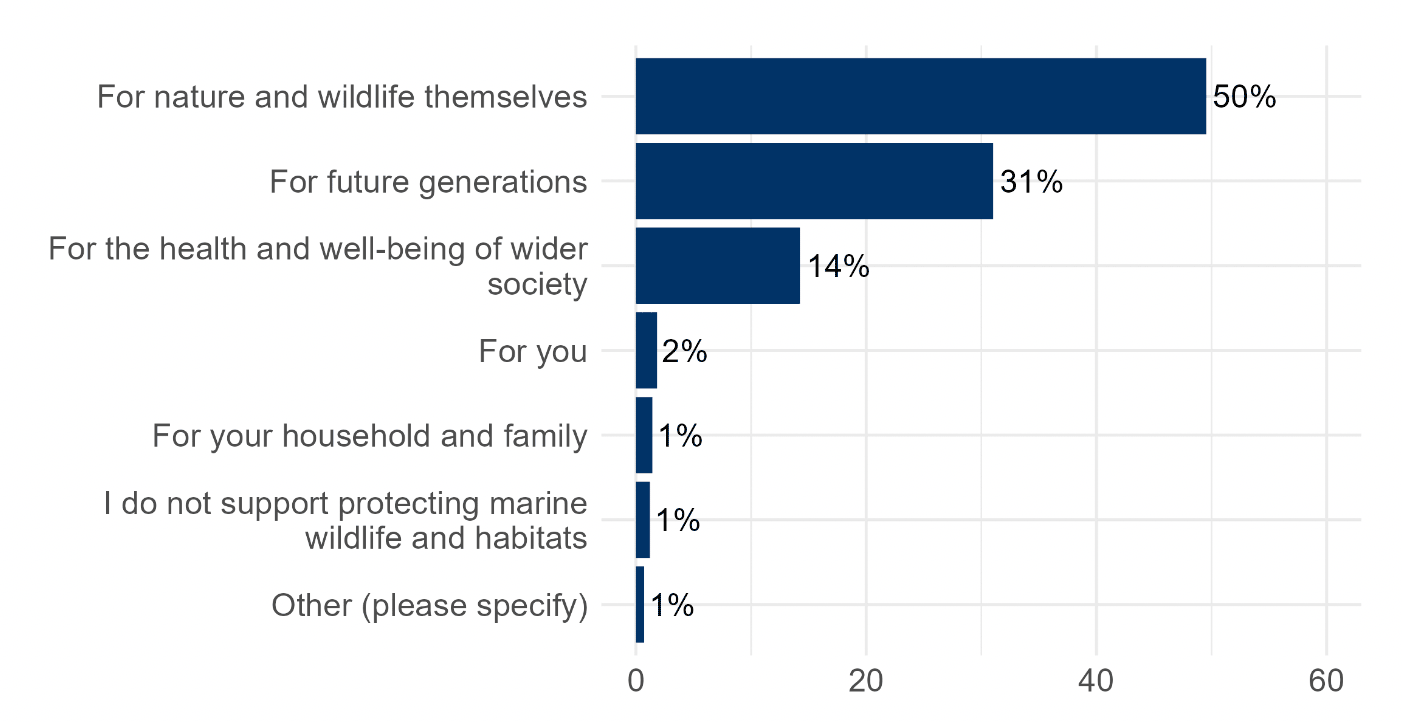
Respondents were asked what they consider as the main reason for protecting marine wildlife and habitats. This question was intended to give an indication of the value motivations of respondents. Figure 26 contains a breakdown of the responses to this question, which shows that respondents appear to hold significant non-use motivations. 50% of respondents considered ‘for nature and wildlife themselves’ as their main reason, and a further 31% considered ‘for future generations’ as theirs.
Another follow-up question asked respondents whether there was any reason they would not support payment of a programme to improve marine and coastal areas. This question was intended to identify potential ‘protestor’ behaviour. As discussed in Section 3.6, high degrees of ‘protestor’ behaviour can lead to inconsistent valuation estimates. A small number of responses (n = 30, or 3% of total responses) were identified as exhibiting potential ‘protestor’ behaviour. These respondents selected the ‘status quo’ option on all choice cards and stated in this follow up question that they would not support payment because ‘the programme should be funded through already existing taxes’ or because they feel that ‘I already pay enough through my taxes’. Modelling of results was conducted with and without potential protest responses included and was found to have very little impact on the final results. As identifying protestors is a somewhat subjective process, and to reduce the risk that genuine non-zero bids were rejected from the analysis, the full survey sample was used in the final analysis.
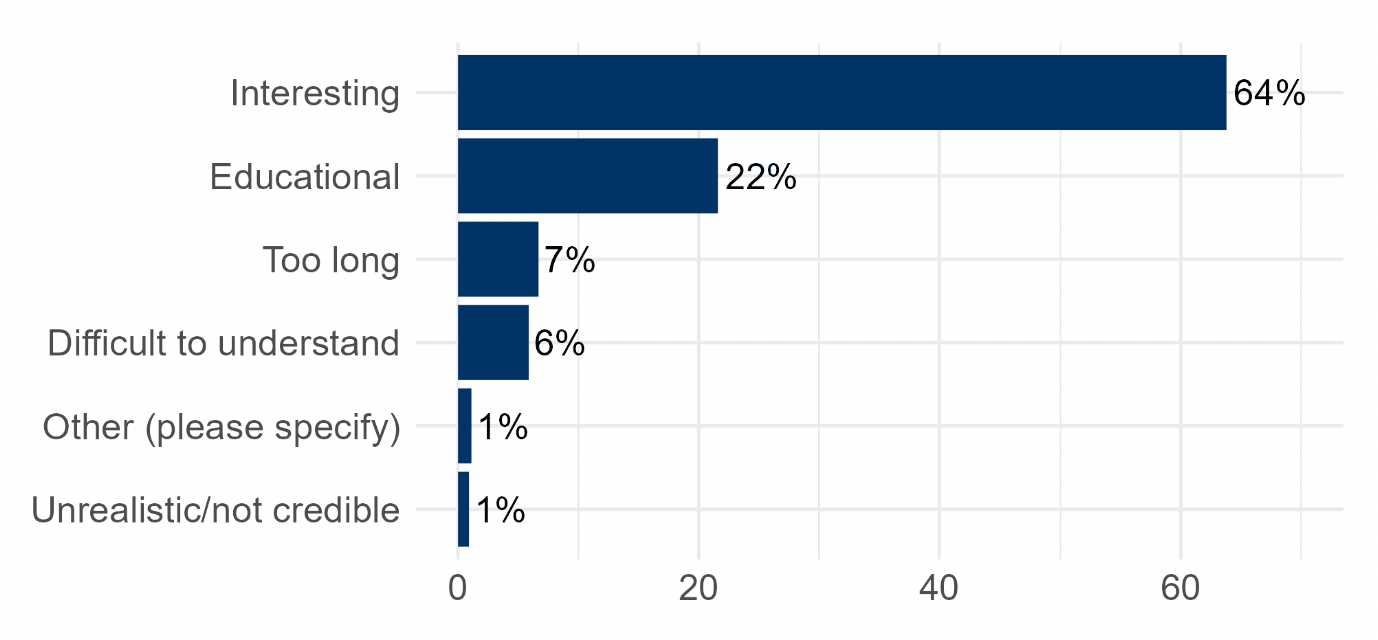
A final question asked respondents how they found the survey overall (see Figure 27). The majority of respondents stated that they found the survey interesting (64%) or educational (22%). Only 1% of respondents found the survey to be unrealistic/not credible.