Long-term Monitoring of Health Inequalities March 2023 report
Annual update of the long-term monitoring of health inequalities headline indicators.
Inequalities in morbidity and mortality indicators
The RII indicates the extent to which health outcomes are worse in the most deprived areas compared to the average throughout Scotland. While comparisons of RII between indicators are possible, they should be made with some caution, in particular where absolute values are significantly higher or lower in the compared indicators or where the measurement scale differs.
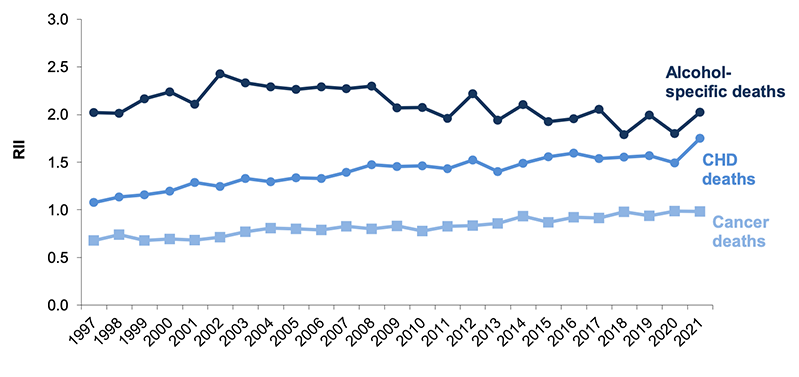
The following charts group indicators in this report into broadly comparable categories: the first shows hospital admissions and incidence of conditions for people belonging to the under 75 age group; while the second shows mortality rates in the 45-74 age group for three causes of death.
Although relative inequalities in heart attack hospital admissions had been increasing in recent years, inequalities have remained highest in alcohol-related admissions throughout the period covered by this report. Inequalities in cancer incidence have remained relatively stable.
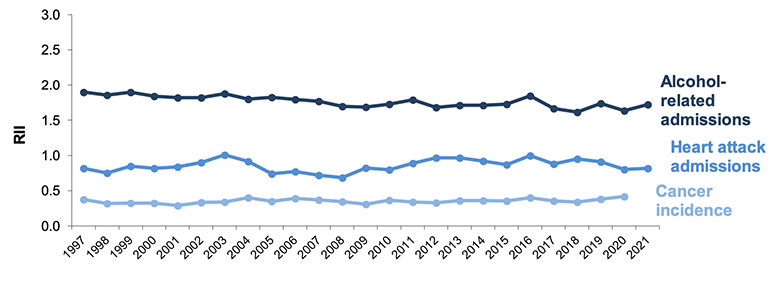
1. Cancer incidence data is only available up to 2020
Relative inequalities in CHD deaths among adults aged 45-74 have increased over the long term. Relative inequalities for alcohol-specific deaths have shown more year on year fluctuation over the same period and are currently similar to at the start of the time series (2.02 in 1997 vs 2.03 in 2021).
Although RII in cancer deaths has increased slightly over the longer term, inequalities remain highest in alcohol-specific and coronary heart disease deaths.
First ever hospital admission for heart attack aged under 75 years
Trends in heart attack hospital admissions
In 2021, over 5,100 new cases of heart attack (for those aged under 75 years) were recorded in Scottish hospitals.
The rate of admissions decreased year on year in the first 10 years of the time series, from 145.1 per 100,000 in 1997 to 80.4 per 100,000 in 2007, the lowest figure in the time series. While the rate of admissions in 2021 was 32% lower than in 1997 (99.2 in 2021), it has increased by 23% since 2007.
This indicator includes data for 2020 and 2021, the first two years of the COVID-19 pandemic. During this time there were changes to the accessibility and use of health services at various points[7] which may have impacted on the likelihood of adults suffering from[8], or presenting at hospital suffering from, a heart attack, although the exact nature of any impact is unclear.
| Year | Total admissions | Target population size | Rate per 100,000 (EASR) |
|---|---|---|---|
| 1997 | 5,764 | 4,740,269 | 145.1 |
| 1998 | 5,676 | 4,729,975 | 141.5 |
| 1999 | 5,101 | 4,721,298 | 126.6 |
| 2000 | 4,812 | 4,708,667 | 118.4 |
| 2001 | 4,776 | 4,703,661 | 116.9 |
| 2002 | 4,833 | 4,701,958 | 116.6 |
| 2003 | 4,569 | 4,702,431 | 109.0 |
| 2004 | 4,413 | 4,714,233 | 103.9 |
| 2005 | 4,047 | 4,735,320 | 94.2 |
| 2006 | 3,750 | 4,752,425 | 86.4 |
| 2007 | 3,549 | 4,783,452 | 80.4 |
| 2008 | 3,655 | 4,811,453 | 81.7 |
| 2009 | 3,851 | 4,835,007 | 84.9 |
| 2010 | 4,377 | 4,858,058 | 95.4 |
| 2011 | 4,537 | 4,888,316 | 97.7 |
| 2012 | 4,747 | 4,895,114 | 100.8 |
| 2013 | 4,697 | 4,903,074 | 98.8 |
| 2014 | 4,503 | 4,914,362 | 93.4 |
| 2015 | 4,521 | 4,935,283 | 92.8 |
| 2016 | 4,521 | 4,962,391 | 91.5 |
| 2017 | 4,738 | 4,976,829 | 94.9 |
| 2018 | 4,233 | 4,983,364 | 83.9 |
| 2019 | 5,007 | 4,996,827 | 98.3 |
| 2020 | 4,908 | 4,996,183 | 95.4 |
| 2021 | 5,140 | 5,001,617 | 99.2 |
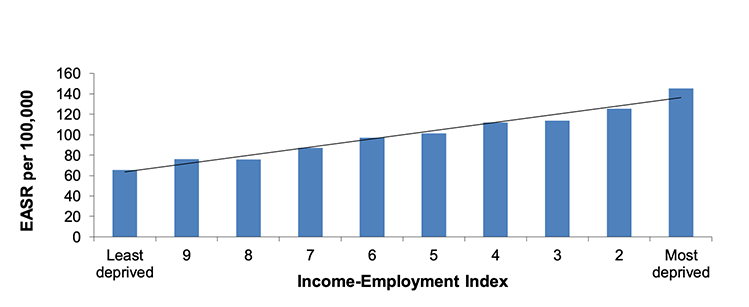
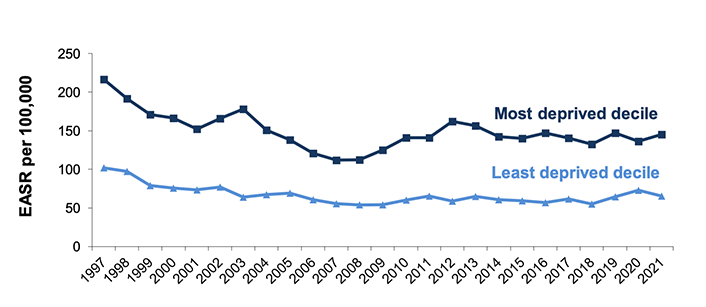
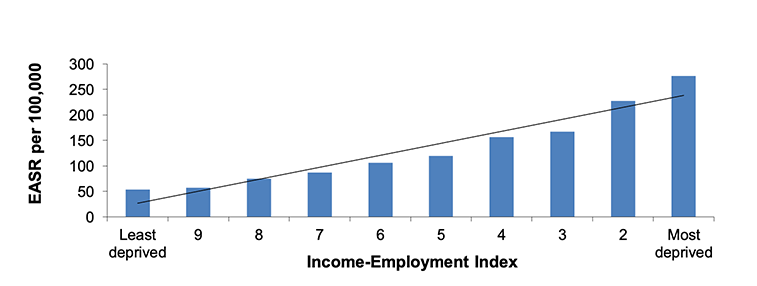
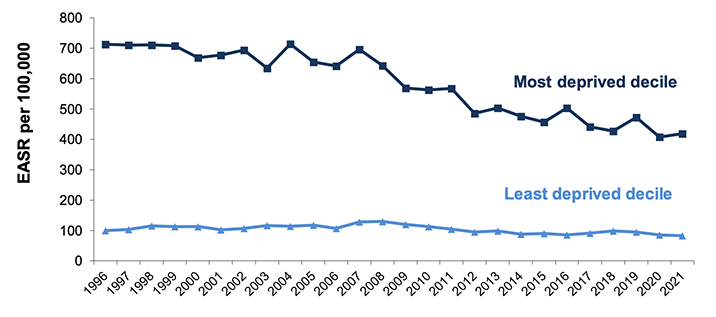
Inequalities in heart attack hospital admissions, 2021
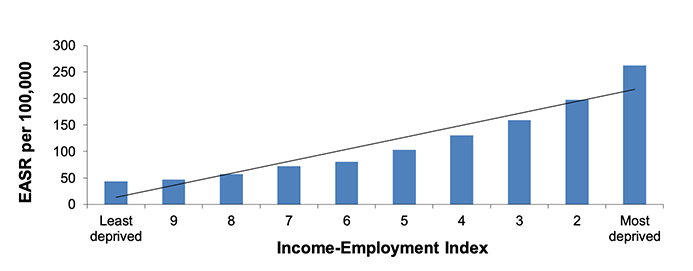
In 2021, the admission rate in Scotland's most deprived areas was more than double that of those living in the least deprived areas (145.3 cases per 100,000 compared to 65.6 per 100,000).
Trends in relative inequalities
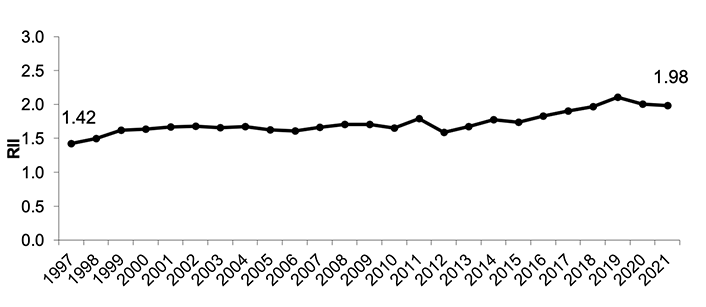
Relative inequality levels for heart attack hospital admissions have fluctuated over time, ranging from 0.69-1.01. The RII for 2021 was the same as at the start of the time series in 1997 (0.82).
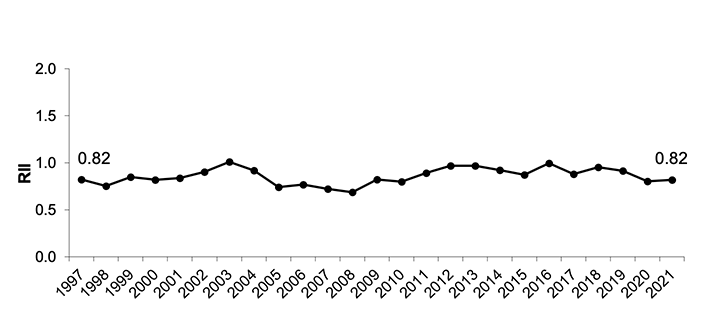
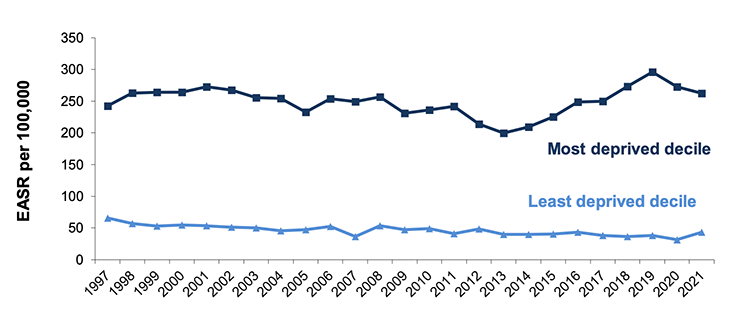
Heart attack hospital admission rates (aged <75) have been around 2-3 times higher in the most deprived areas compared to the least deprived areas across the time series.
Trends in absolute inequalities
The absolute gap in hospital admissions between those living in the most and least deprived areas was 79.7 per 100,000 in 2021. The gap has increased from 63.2 per 100,000 in 2020, which was the lowest figure since 2008.
The increase in 2021 has been driven by a 7% increase in admissions in the most deprived areas and a 10% decrease in the least deprived areas and reflects a return to pre-pandemic levels.
Coronary Heart Disease (CHD) - deaths aged 45-74 years
Trends in CHD deaths
In 2021, over 2,700 deaths amongst those aged 45-74 years were attributed to CHD.
Since 1997, there has been a considerable decrease in CHD deaths amongst the population aged 45-74 years. In 2021, the death rate for this age group was 130.1 per 100,000. While the 2021 rate is 65% lower than the rate in 1997 (372.5 per 100,000), it is the highest level since 2013.
National Records of Scotland note that in 2020 and 2021 there more deaths than usual (when compared to the five year average of 2015-2019) from a number of causes, including heart disease[9]. The cause of this increase is not clear, however, reduced access to and availability of health services, and reluctance to use services[10], during the pandemic may have played a part.
| Year | Number of deaths | Target population size | Rate per 100,000 (EASR) |
|---|---|---|---|
| 1997 | 5,887 | 1,635,590 | 372.5 |
| 1998 | 5,675 | 1,646,711 | 357.9 |
| 1999 | 5,389 | 1,658,124 | 338.9 |
| 2000 | 4,858 | 1,670,660 | 303.9 |
| 2001 | 4,483 | 1,687,422 | 279.3 |
| 2002 | 4,310 | 1,706,141 | 265.9 |
| 2003 | 4,197 | 1,727,112 | 256.3 |
| 2004 | 3,840 | 1,751,037 | 232.3 |
| 2005 | 3,721 | 1,774,865 | 222.3 |
| 2006 | 3,393 | 1,799,382 | 200.8 |
| 2007 | 3,374 | 1,827,320 | 196.6 |
| 2008 | 3,155 | 1,856,874 | 180.9 |
| 2009 | 2,857 | 1,885,693 | 160.7 |
| 2010 | 2,811 | 1,914,226 | 156.6 |
| 2011 | 2,592 | 1,941,253 | 142.6 |
| 2012 | 2,584 | 1,964,203 | 139.7 |
| 2013 | 2,515 | 1,986,202 | 133.7 |
| 2014 | 2,358 | 2,007,988 | 123.1 |
| 2015 | 2,463 | 2,026,210 | 127.4 |
| 2016 | 2,467 | 2,047,858 | 124.7 |
| 2017 | 2,476 | 2,064,612 | 122.2 |
| 2018 | 2,416 | 2,073,318 | 117.6 |
| 2019 | 2,333 | 2,078,411 | 112.1 |
| 2020 | 2,595 | 2,081,214 | 123.3 |
| 2021 | 2,772 | 2,085,703 | 130.1 |
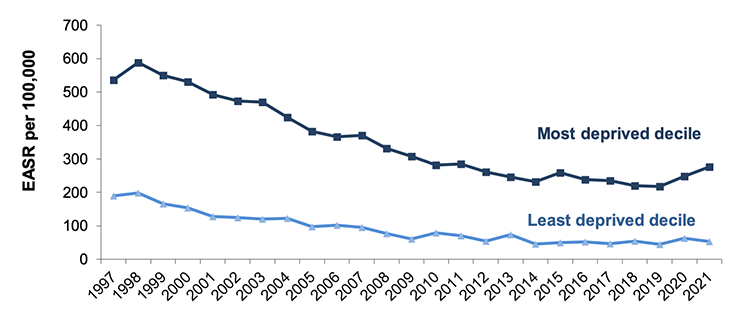
Inequalities in CHD deaths, 2021
In 2021, the CHD mortality rate was five times higher in Scotland's most deprived areas compared to the least deprived (276.3 compared to 53.6 deaths per 100,000 population).
Trends in relative inequalities
Relative inequalities in CHD deaths have increased over the longer term. In 2021 the RII was 1.75, the highest in the time series.
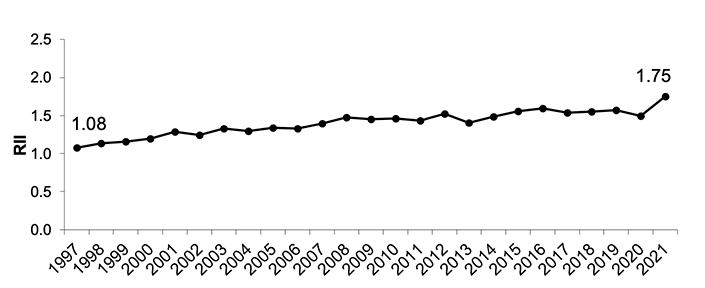
In the second half of the time series, CHD mortality rates have typically been 4-5 times higher in the most deprived areas compared to the least deprived areas. This is higher than at the start of the times series when CHD mortality rates were typically 3-4 times higher.
Trends in absolute inequalities
In contrast to relative inequalities, the absolute gap between those living in the most deprived areas and those living in the least deprived areas has reduced over the longer term from a high of 390.1 per 100,000 in 1998. The gap in 2021 is 36% lower than the start of the time series (222.6 per 100,000 in 2021 compared to 347.3 per 100,000 in 1997) but is the highest figure since 2009.
Between 2020 and 2021 the mortality rate in the most deprived areas increased by 11%, whilst the rate in the least deprived areas decreased by 14%. In 2020 there was a decrease in the rate of first hospital admission for heart attack for adults living in the most deprived areas[11], potentially as a result of non-attendance at hospital as a result of the COVID-19 pandemic, which may have contributed towards this increase in mortality seen in 2021.
Cancer incidence rate aged under 75 years
Trends in cancer incidence
In 2020, there were more than 19,500 new cases of cancer diagnosed among people aged under 75.
Cancer incidence among people aged under 75 has fluctuated over the time series ranging from 417.5 per 100,000 to 452.7 per 100,000 between 1996 and 2019. Cancer incidence in 2020 was the lowest in the time series at 383.9 per 100,000, a reduction of 14% since 2019. This reduction is likely to be a result of the impact of COVID-19 on cancer detection, rather than a genuine decrease in the incidence of cancer in Scotland in 2020.
In Public Health Scotland's (PHS) Cancer Incidence in Scotland[12] publication they note that during the COVID-19 pandemic, cancer screening programmes were paused and referrals for suspected cancer fell as patients were less likely to seek help. Some people will also have died of COVID-19 in 2020 before they were diagnosed with cancer. To quantify this, PHS undertook analysis to determine the rates of cancer that would have been expected in 2020 based on the previous decades cancer data (2010-2019) and determined that the decrease was out with what would have been expected and was therefore likely the result of the COVID-19 pandemic.
| Year | Number of new cases | Target population size | Rate per 100,000 (EASR) |
|---|---|---|---|
| 1996 | 18,128 | 4,754,906 | 452.7 |
| 1997 | 17,167 | 4,740,269 | 427.4 |
| 1998 | 17,109 | 4,729,975 | 424.3 |
| 1999 | 16,914 | 4,721,298 | 417.5 |
| 2000 | 17,138 | 4,708,667 | 420.6 |
| 2001 | 17,147 | 4,703,661 | 418.9 |
| 2002 | 17,530 | 4,701,958 | 423.6 |
| 2003 | 17,574 | 4,702,431 | 420.8 |
| 2004 | 18,159 | 4,714,233 | 430.3 |
| 2005 | 17,987 | 4,735,320 | 421.9 |
| 2006 | 18,167 | 4,752,425 | 423.3 |
| 2007 | 18,775 | 4,783,452 | 430.8 |
| 2008 | 19,449 | 4,811,453 | 439.7 |
| 2009 | 19,999 | 4,835,007 | 446.6 |
| 2010 | 20,015 | 4,858,058 | 441.9 |
| 2011 | 20,208 | 4,888,316 | 441.3 |
| 2012 | 20,296 | 4,895,114 | 436.8 |
| 2013 | 20,598 | 4,903,074 | 437.7 |
| 2014 | 21,064 | 4,914,362 | 442.4 |
| 2015 | 20,888 | 4,935,283 | 433.5 |
| 2016 | 20,980 | 4,962,391 | 429.2 |
| 2017 | 21,197 | 4,976,829 | 426.5 |
| 2018 | 22,549 | 4,983,364 | 449.1 |
| 2019 | 22,698 | 4,997,455 | 447.1 |
| 2020 | 19,663 | 4,996,183 | 383.9 |
Inequalities in cancer incidence, 2020
In 2020, there were 492.1 cases of cancer per 100,000 people in the most deprived areas, compared to 333.8 cases per 100,000 in the least deprived areas.
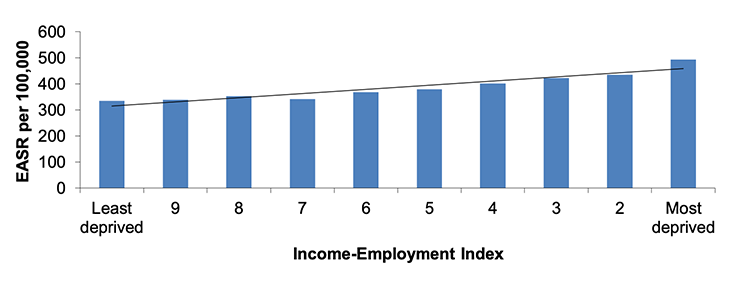
Cancer incidence is more common in the most deprived areas of Scotland. However, this is not the case for all types of cancer[13]. This is driven in part by variations in screening uptake, leading to socially patterned rises in cancer incidence and, in turn, cancer survival for some types of cancer in the least deprived areas.
As has been the case in previous years, of the most common types of cancer, the absolute gap between most and least deprived areas was largest for cancer of the trachea, bronchus and lung (2020 rates were 116.8 and 23.6 per 100,000 population in the most and least deprived areas respectively).
Trends in relative inequalities
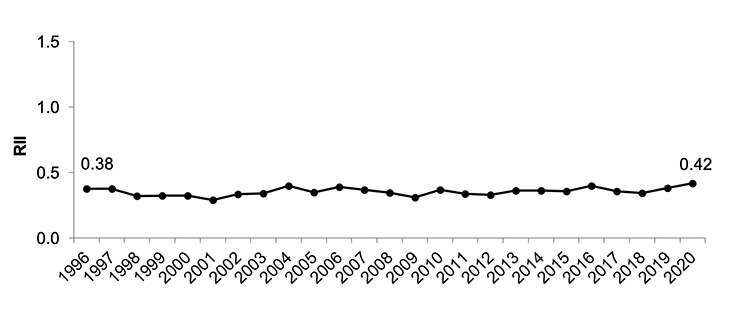
Changes in the relative index of inequality over time have been minimal and show no clear pattern, with the rate fluctuating between 0.29 and 0.42. In 2020 the RII was 0.42, the highest figure in the time series.
Trends in absolute inequalities
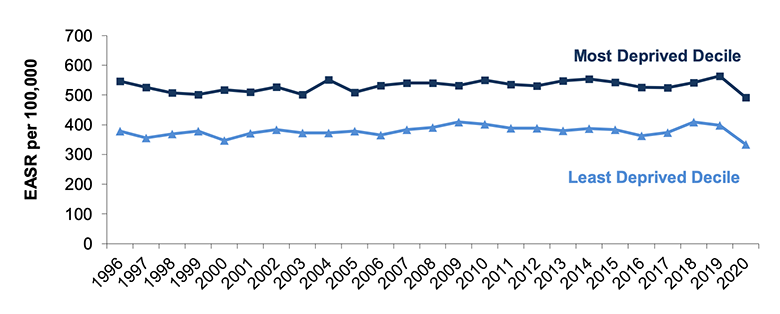
Absolute inequality levels in cancer incidence have fluctuated over time, ranging from 122.1 to 178.2. Rates in both the least and most deprived areas of Scotland have shown no clear pattern. The gap between the most and least deprived decile was 158.2 in 2020. Between 2019 and 2020 the rate of cancer incidence decreased in both the most and least deprived deciles (by 13% and 16% respectively), most likely as a result of the impact of the COVID-19 pandemic.
Cancer deaths aged 45-74 years
In October 2022 Public Health Scotland (PHS) published the annual Cancer Mortality in Scotland report[14] which included data up to 2021. In the report they note that the COVID-19 pandemic resulted in the pausing of cancer screenings, a fall in urgent referrals for suspected cancer and a reduction in patients seeking help, receiving investigations and treatment for cancer.
In the publication PHS note that cancer mortality rates have fallen over time and they therefore undertook analysis to gauge the impact of the pandemic on cancer mortality rates. This analysis concluded that while cancer mortality rates in 2020 and 2021 were lower than before the pandemic, the were within the limits which would have been expected if the pandemic had not occurredxiv.
Trends in cancer deaths
In 2021 more than 7,300 adults aged 45-74 died of cancer.
The cancer mortality rate amongst those aged 45-74 years has fallen by 35% since the start of the time series (from 529.8 per 100,000 population in 1996 to 343.6 per 100,000 in 2021).
| Year | Number of deaths | Target population size | Rate per 100,000 (EASR) |
|---|---|---|---|
| 1996 | 8,402 | 1,631,224 | 529.8 |
| 1997 | 8,068 | 1,635,590 | 509.1 |
| 1998 | 7,995 | 1,646,711 | 501.9 |
| 1999 | 7,904 | 1,658,124 | 494.4 |
| 2000 | 7,776 | 1,670,660 | 484.8 |
| 2001 | 7,903 | 1,687,422 | 489.2 |
| 2002 | 7,850 | 1,706,141 | 481.2 |
| 2003 | 7,706 | 1,727,112 | 467.4 |
| 2004 | 7,678 | 1,751,037 | 460.9 |
| 2005 | 7,606 | 1,774,865 | 451.8 |
| 2006 | 7,486 | 1,799,382 | 441.3 |
| 2007 | 7,569 | 1,827,320 | 439.5 |
| 2008 | 7,536 | 1,856,874 | 431.0 |
| 2009 | 7,481 | 1,885,693 | 421.2 |
| 2010 | 7,394 | 1,914,226 | 411.1 |
| 2011 | 7,428 | 1,941,253 | 408.5 |
| 2012 | 7,514 | 1,964,203 | 406.2 |
| 2013 | 7,520 | 1,986,202 | 399.8 |
| 2014 | 7,445 | 2,007,988 | 389.6 |
| 2015 | 7,621 | 2,026,210 | 392.9 |
| 2016 | 7,385 | 2,047,858 | 373.5 |
| 2017 | 7,342 | 2,064,612 | 363.6 |
| 2018 | 7,531 | 2,073,318 | 367.0 |
| 2019 | 7,487 | 2,078,664 | 360.0 |
| 2020 | 7,362 | 2,081,213 | 349.8 |
| 2021 | 7,326 | 2,085,703 | 343.6 |
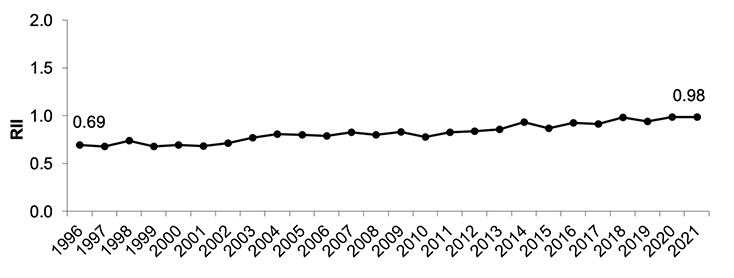
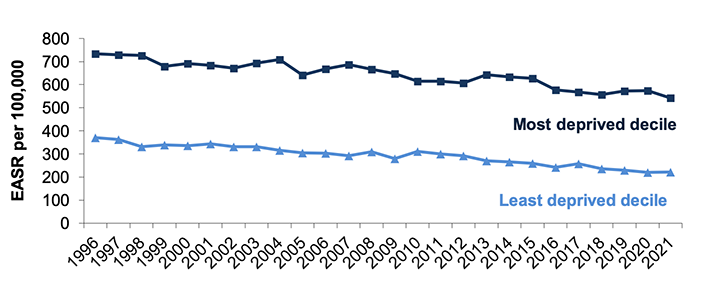
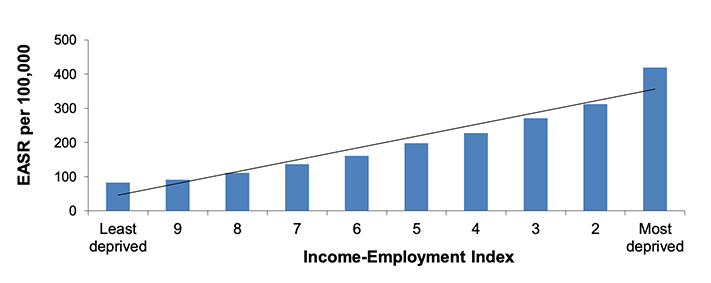
Inequalities in cancer deaths, 2021
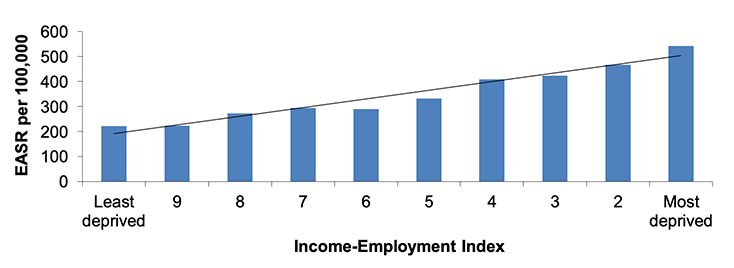
Of people in the 45-74 year age group, those living in Scotland's most deprived areas were more than twice as likely to die of cancer than those in the least deprived areas in 2021 (542.0 deaths per 100,000 population compared to 221.8 per 100,000 population).
As is the case for cancer incidence, inequality levels vary when examining deaths by cancer type[15]. As described in the previous section, variations in screening uptake may lead to socially patterned rises in cancer incidence and, in turn, cancer survival (therefore having a possible effect on mortality) for some types of cancer.
In 2021 the largest differences between rates in the most and least deprived areas are again observed for cancer of the trachea, bronchus and lung (201.4 compared to 31.8 per 100,000 population).
Trends in relative inequalities
Relative inequalities in cancer mortality have increased over time and the RII in 2021 was the second highest recorded across the time series (0.98), higher than at the start of the time series (0.69 in 1996).
Trends in absolute inequalities
Levels of absolute inequality for cancer deaths have fluctuated since 1996, ranging from 304.8 to 395.3. In 2021 the absolute gap between the most deprived and least deprived areas was 320.2 per 100,000.
Alcohol-related hospital admissions aged under 75 years
Trends in alcohol-related admissions
The first hospital admission rate for alcohol-related conditions amongst those aged under 75 years with a 10-year look-back period has shown a general downward trend over time. The rate of admissions was 201.1 per 100,000 in 2021, the lowest figure in the time series and 31% lower than at the start of the time series (289.8 per 100,000 in 1996).
Alcohol-related hospital admissions were around 11% lower in 2020 and 2021 than in 2019. Measures put in place in response to the COVID-19 pandemic impacted hospital activity from March 2020 and are likely to have contributed to the decrease[16]
| Year | Number of admissions | Target population size | Rate per 100,000 (EASR) |
|---|---|---|---|
| 1996 | 12,787 | 4,754,906 | 289.8 |
| 1997 | 12,918 | 4,740,269 | 292.6 |
| 1998 | 13,316 | 4,729,975 | 300.7 |
| 1999 | 13,217 | 4,721,298 | 298.2 |
| 2000 | 12,786 | 4,708,667 | 286.6 |
| 2001 | 13,469 | 4,703,661 | 300.3 |
| 2002 | 13,492 | 4,701,958 | 299.9 |
| 2003 | 12,996 | 4,702,431 | 290.0 |
| 2004 | 14,084 | 4,714,233 | 312.5 |
| 2005 | 13,346 | 4,735,320 | 293.8 |
| 2006 | 13,595 | 4,752,425 | 295.3 |
| 2007 | 14,641 | 4,783,452 | 313.5 |
| 2008 | 14,222 | 4,811,453 | 302.3 |
| 2009 | 12,891 | 4,835,007 | 272.9 |
| 2010 | 12,307 | 4,858,058 | 258.7 |
| 2011 | 12,264 | 4,888,316 | 256.2 |
| 2012 | 11,556 | 4,895,114 | 240.9 |
| 2013 | 11,225 | 4,903,074 | 236.8 |
| 2014 | 10,779 | 4,914,362 | 223.7 |
| 2015 | 10,466 | 4,935,283 | 216.9 |
| 2016 | 10,769 | 4,962,391 | 221.8 |
| 2017 | 10,645 | 4,976,829 | 218.1 |
| 2018 | 10,662 | 4,983,364 | 217.6 |
| 2019 | 11,186 | 4,997,455 | 227.5 |
| 2020 | 9,994 | 4,996,183 | 202.5 |
| 2021 | 9,933 | 5,001,617 | 201.1 |
1. Based on a 10 year look-back period
2. Figures for 2014-2020 have been revised slightly, but this does not affect the overall picture.
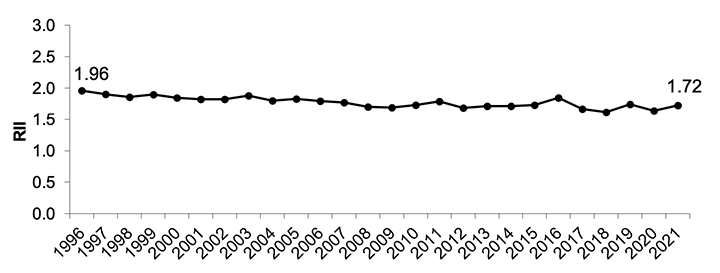
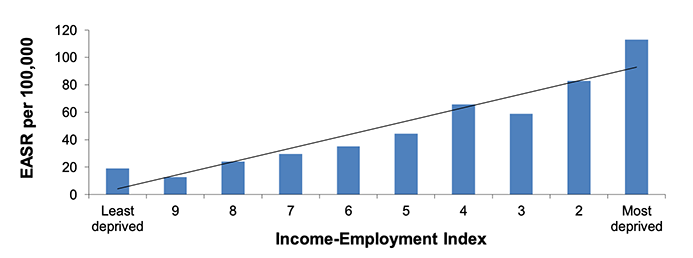
Inequalities in alcohol-related hospital admissions, 2021
In 2021, alcohol-related admissions were 5 times higher in the most deprived areas of Scotland compared to the least deprived (419.1 compared to 82.6 cases per 100,000).
Trends in relative inequalities
There has been a general downward trend observed in relative inequalities for alcohol-related hospital admissions since 1996. However, there has been some fluctuation including an increase in 2016 when the RII was 1.85, the highest rate since 2003. The figure for 2021 was 1.72.
Since 2003, alcohol-admission rates have been between 4 to 6 times higher in the most deprived areas compared to the least deprived areas. Prior to this, admission rates were 6-7 times higher in the most deprived areas.
Trends in absolute inequalities
Absolute inequalities in alcohol-related admissions have generally reduced over time, largely due to a reduction in admissions in the most deprived areas. The gap was widest at the start of the time series in 1996 (613.0 per 100,000) and reduced to its lowest level in 2020 (322.2 per 100,000). The rate increased slightly to 336.5 per 100,000 in 2021. Rates in the most deprived areas have reduced by 41% between 1996 and 2021, compared to a reduction of 17% in the least deprived areas.
Alcohol-specific deaths aged 45-74 years
Trends in alcohol-specific deaths
Analysis by PHS on alcohol consumption during the COVID-19 pandemic found that, while total alcohol consumption for the population reduced, alcohol-specific deaths were 9% higher in 2020 than the 2017-19 annual average[17]. This is possibly as a result of some individuals increasing their alcohol consumption during the pandemic and a reduction in access to hospital treatment for alcohol-related conditions. This impact may have continued to have an influence on alcohol-specific death rates in 2021.
The alcohol-specific death rate among those aged 45-74 years has fluctuated over the time series. There was an overall increase between 1997 and 2006 (increasing from 38.5 per 100,000 to 61.3 per 100,000) followed by a general downward trend until 2012 (38.2 per 100,000) when the rate was similar to the start of the time series. Since 2013, the alcohol-specific mortality rate has increased overall and the rate in 2021 was 47.3 per 100,000, the highest rate since 2010 and higher than at the start of the time series.
| Year | Number of deaths | Target population size | Rate per 100,000 (EASR) |
|---|---|---|---|
| 1997 | 636 | 1,635,590 | 38.5 |
| 1998 | 695 | 1,646,711 | 41.9 |
| 1999 | 761 | 1,658,124 | 45.2 |
| 2000 | 873 | 1,670,660 | 52.1 |
| 2001 | 957 | 1,687,422 | 56.7 |
| 2002 | 1,049 | 1,706,141 | 61.3 |
| 2003 | 1,053 | 1,727,112 | 60.9 |
| 2004 | 1,015 | 1,751,037 | 57.6 |
| 2005 | 1,056 | 1,774,865 | 59.3 |
| 2006 | 1,105 | 1,799,382 | 61.3 |
| 2007 | 1,002 | 1,827,320 | 54.6 |
| 2008 | 1,019 | 1,856,874 | 54.8 |
| 2009 | 905 | 1,885,693 | 47.9 |
| 2010 | 927 | 1,914,226 | 48.3 |
| 2011 | 871 | 1,941,253 | 45.1 |
| 2012 | 752 | 1,964,203 | 38.2 |
| 2013 | 769 | 1,986,202 | 38.6 |
| 2014 | 808 | 2,007,988 | 40.2 |
| 2015 | 840 | 2,026,210 | 41.4 |
| 2016 | 898 | 2,047,858 | 43.7 |
| 2017 | 910 | 2,064,612 | 44.0 |
| 2018 | 898 | 2,073,318 | 43.2 |
| 2019 | 801 | 2,078,664 | 38.4 |
| 2020 | 952 | 2,081,213 | 45.4 |
| 2021 | 997 | 2,085,703 | 47.3 |
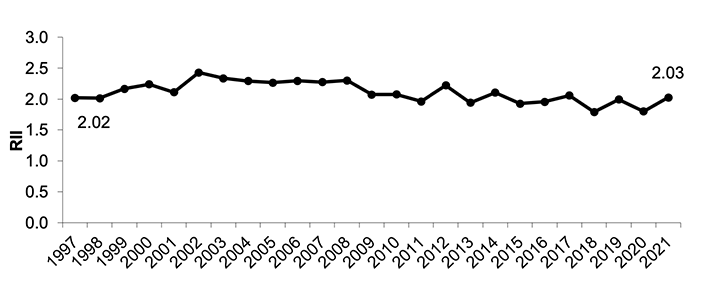
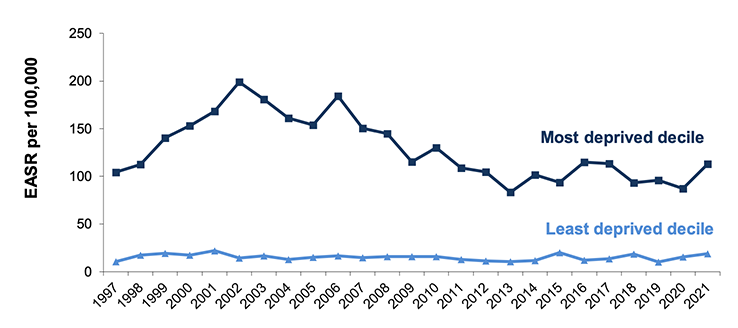
Inequalities in alcohol-specific deaths, 2021
The alcohol-specific death rate (for those aged 45-74 years) in Scotland's most deprived areas is almost six times higher than that observed in the least deprived areas (113.0 compared to 19.0 per 100,000 population).
Trends in relative inequalities
Relative inequalities in alcohol-specific deaths in 2021 were similar to at the start of the time series in 1997 (2.03 and 2.02 respectively). Over the time series the RII has ranged from 1.79 to 2.43.
Trends in absolute inequalities
Following an increase in the gap between the alcohol-specific mortality rate in the most and least deprived areas of Scotland, from 93.7 to 184.7 per 100,000 between 1997 and 2002, there has been general downward trend, with the lowest rate of 71.8 per 100,000 in 2020. However, this rate increased in 2021 to 94.0 per 100,000, the highest rate since 2017
Although the rate of alcohol-specific deaths in the least deprived areas has remained reasonably static since 1997, there has been considerable change in the rate in the most deprived areas. This has largely driven changes in the absolute gap, however, in 2021, both the most and least deprived areas showed an increase from 2020 (increases of 30% and 23% in the most and least deprived areas respectively.)
All-cause mortality aged 15-44 years
Trends in all-cause mortality aged 15-44
There were over 2,300 deaths of people aged 15-44 in Scotland in 2021.
There was an overall decrease in the mortality rate from the start of the time series in 1997 to 2014, when rates reached a low of 96.8 per 100,000. Since then, the mortality rate of those aged 15-44 has increased and in 2021 it was similar to the start of the time series (116.8 per 100,000 and 116.3 per 100,000 respectively).
| Year | Number of all-causes deaths | Target population size | Rate per 100,000 (EASR) |
|---|---|---|---|
| 1997 | 2,440 | 2,158,030 | 116.3 |
| 1998 | 2,507 | 2,142,787 | 119.4 |
| 1999 | 2,507 | 2,129,794 | 119.0 |
| 2000 | 2,501 | 2,118,568 | 118.7 |
| 2001 | 2,509 | 2,111,242 | 119.0 |
| 2002 | 2,566 | 2,102,670 | 122.0 |
| 2003 | 2,461 | 2,094,408 | 116.9 |
| 2004 | 2,409 | 2,088,563 | 114.7 |
| 2005 | 2,305 | 2,091,415 | 109.3 |
| 2006 | 2,482 | 2,091,581 | 118.3 |
| 2007 | 2,461 | 2,097,902 | 117.5 |
| 2008 | 2,443 | 2,096,495 | 117.5 |
| 2009 | 2,389 | 2,092,065 | 115.1 |
| 2010 | 2,229 | 2,087,635 | 108.6 |
| 2011 | 2,262 | 2,092,311 | 110.8 |
| 2012 | 2,071 | 2,077,902 | 102.8 |
| 2013 | 1,990 | 2,064,867 | 100.1 |
| 2014 | 1,904 | 2,053,897 | 96.8 |
| 2015 | 1,976 | 2,053,401 | 101.2 |
| 2016 | 2,194 | 2,054,055 | 112.5 |
| 2017 | 2,068 | 2,048,063 | 107.1 |
| 2018 | 2,220 | 2,044,305 | 114.5 |
| 2019 | 2,331 | 2,053,086 | 119.8 |
| 2020 | 2,349 | 2,055,180 | 119.0 |
| 2021 | 2,322 | 2,062,184 | 116.8 |
The deaths of those age 15-44 in 2021 included: 352 probable suicides, 30 deaths from assault and 723 drug-related deaths. The rate of probable suicide in this age group in 2021 declined for the first time in three years and is lower than at the start of the time series in 1997 (17.0 per 100,000 and 23.9 per 100,000 respectively). Rates of death from assault have increased slightly to 1.5 per 100,000 in 2021 from a low of 1.0 per 100,000 in 2014, but have generally been lower in the last decade that at the start of the series. Drug-related deaths have shown large increases since the beginning of the time series in 1997. In 2021, the drug-related death rate was 36.2 per 100,000, this compares with 8.9 per 100,000 in 1997.
| Deaths from assault | Drug related deaths | Suicides | ||||
|---|---|---|---|---|---|---|
| Year | Number | EASR per 100,000 | Number | EASR per 100,000 | Number | EASR per 100,000 |
| 1997 | 56 | 2.6 | 196 | 8.9 | 518 | 23.9 |
| 1998 | 65 | 3.0 | 227 | 10.6 | 526 | 24.4 |
| 1999 | 86 | 4.0 | 274 | 12.9 | 529 | 24.7 |
| 2000 | 60 | 2.9 | 268 | 12.7 | 541 | 25.6 |
| 2001 | 63 | 3.0 | 289 | 13.8 | 531 | 25.3 |
| 2002 | 76 | 3.6 | 345 | 16.7 | 539 | 25.7 |
| 2003 | 71 | 3.4 | 282 | 13.6 | 456 | 21.8 |
| 2004 | 78 | 3.8 | 311 | 15.2 | 475 | 22.7 |
| 2005 | 50 | 2.3 | 277 | 13.4 | 436 | 21.0 |
| 2006 | 83 | 4.0 | 350 | 17.1 | 435 | 20.9 |
| 2007 | 54 | 2.6 | 392 | 19.1 | 453 | 21.8 |
| 2008 | 53 | 2.5 | 477 | 23.3 | 480 | 23.4 |
| 2009 | 47 | 2.3 | 436 | 21.3 | 432 | 20.8 |
| 2010 | 54 | 2.6 | 384 | 18.9 | 423 | 20.5 |
| 2011 | 53 | 2.6 | 454 | 22.5 | 420 | 20.5 |
| 2012 | 37 | 1.9 | 416 | 20.8 | 375 | 18.3 |
| 2013 | 35 | 1.7 | 354 | 17.9 | 356 | 17.7 |
| 2014 | 22 | 1.0 | 416 | 21.1 | 309 | 15.4 |
| 2015 | 28 | 1.4 | 442 | 22.8 | 306 | 15.3 |
| 2016 | 34 | 1.7 | 568 | 29.2 | 329 | 16.2 |
| 2017 | 40 | 2.0 | 581 | 30.1 | 305 | 15.1 |
| 2018 | 28 | 1.4 | 723 | 37.3 | 370 | 18.3 |
| 2019 | 29 | 1.4 | 753 | 38.4 | 404 | 19.7 |
| 2020 | 30 | 1.4 | 756 | 38.0 | 404 | 19.8 |
| 2021 | 30 | 1.5 | 723 | 36.2 | 352 | 17.0 |
Inequalities in all-cause mortality aged 15-44, 2021
The mortality rate amongst people aged 15-44 years was more than six times higher in the most deprived areas (262.5 per 100,000) compared to the least deprived (43.6 per 100,000) in 2021.
Trends in relative inequalities
There has been an overall increase in relative inequalities over time, although they have fallen in the last couple of years from a high of 2.11 in 2019 to 1.98 in 2021.
Trends in absolute inequalities
The absolute gap in all-cause mortality between those living in the most and least deprived areas has fluctuated over the time series, reaching its lowest level in 2013 (a gap of 159.6 per 100,000). The gap was highest in 2019 at 257.9 per 100,000 and has fallen to 218.9 per 100,000 in 2021. This decrease has been driven by both a decrease in mortality for those living in the most deprived areas and an increase in mortality for those living in the least deprived areas.
Low Birthweight
Trends in low birthweight
Over 2,350 low birthweight babies were born in Scotland in 2021.
The percentage of babies born with a low birthweight has remained fairly stable across the time series, ranging from 5.0 – 6.0%
| Year | Number of low birthweight babies1 | Target population size | % of live singleton births |
|---|---|---|---|
| 1998 | 3,108 | 55,152 | 5.6 |
| 1999 | 3,098 | 52,726 | 5.9 |
| 2000 | 2,906 | 51,057 | 5.7 |
| 2001 | 2,848 | 49,744 | 5.7 |
| 2002 | 2,910 | 48,950 | 5.9 |
| 2003 | 3,026 | 50,069 | 6.0 |
| 2004 | 3,030 | 51,807 | 5.8 |
| 2005 | 3,058 | 51,436 | 5.9 |
| 2006 | 2,939 | 52,467 | 5.6 |
| 2007 | 3,095 | 55,271 | 5.6 |
| 2008 | 3,134 | 56,925 | 5.5 |
| 2009 | 2,893 | 56,107 | 5.2 |
| 2010 | 2,816 | 56,135 | 5.0 |
| 2011 | 2,948 | 56,038 | 5.3 |
| 2012 | 2,781 | 55,395 | 5.0 |
| 2013 | 2,716 | 53,619 | 5.1 |
| 2014 | 2,772 | 54,389 | 5.1 |
| 2015 | 2,819 | 52,842 | 5.3 |
| 2016 | 2,761 | 52,416 | 5.3 |
| 2017 | 2,842 | 50,824 | 5.6 |
| 2018 | 2,689 | 49,248 | 5.5 |
| 2019 | 2,626 | 47,379 | 5.5 |
| 2020 | 2,435 | 45,575 | 5.3 |
| 20212 | 2,357 | 45,846 | 5.1 |
1. This table includes records that could not be assigned an income employment decile and are therefore not included in the rest of the analysis.
2. 2021 data are provisional and may be updated in future reports.
Inequalities in low birthweight 2021
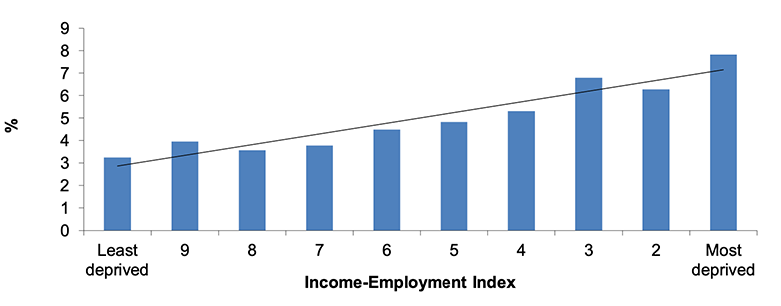
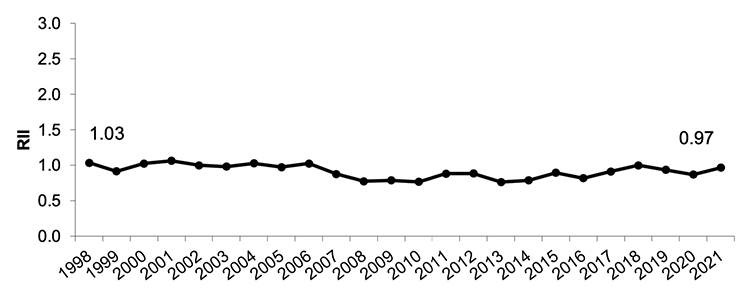
In 2021, 7.8% of live singleton births in the most deprived areas were recorded as low birthweight, this compared to 3.2% in the least deprived areas.
Trends in relative inequalities
Relative inequalities in low birthweight were lower in 2021 than those observed at the start of the time series in 1998 (0.97 and 1.03 respectively). However, the RII values have been increasing the last five years, and are higher than the lowest value in the time series (0.76 in 2013).
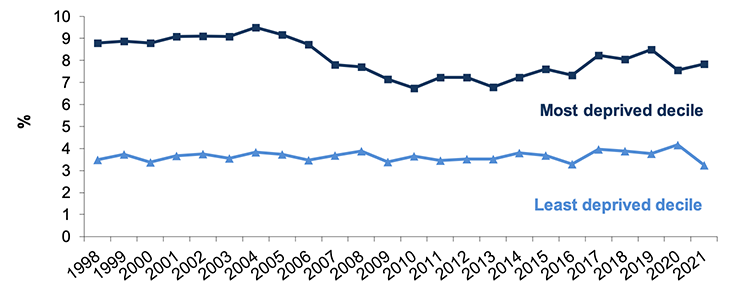
Trends in absolute inequalities
The absolute gap in low birthweight between those living in the most and least deprived areas in 2021 was 4.6 percentage points, an increase from 3.4 percentage points in 2020 but lower than at the start of the time series (5.3 percentage points).
The narrowing and widening of the gap has tended to be driven by changes in the most deprived decile, as the least deprived decile has remained broadly stable since the beginning of the time series. However, the increase between 2020 and 2021 was driven by both an increase in the most deprived areas and a decrease in the least deprived areas.
Healthy Birthweight
Trends in healthy birthweight babies
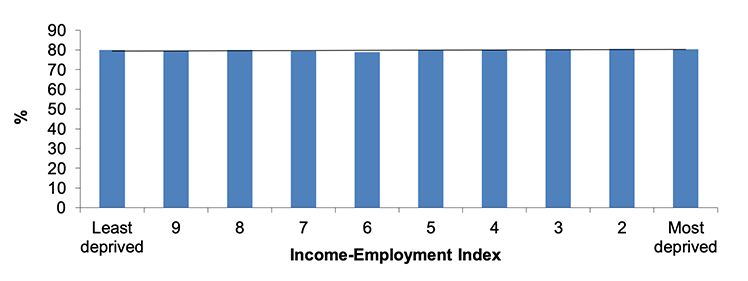
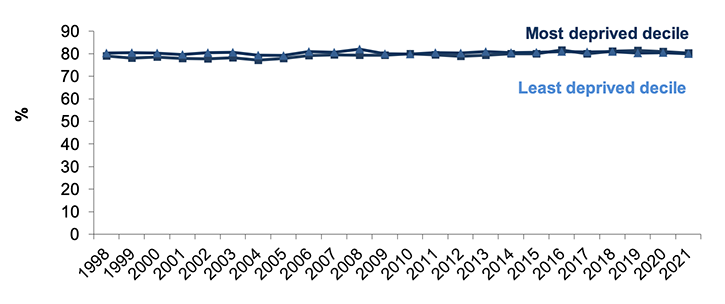
In each year of the time series, between 79% and 81% of babies have been of healthy birthweight.
| Year | Number appropriate for gestational age1,2 | Target population size1 | % of live singleton births |
|---|---|---|---|
| 1998 | 43,963 | 55,065 | 79.8 |
| 1999 | 41,815 | 52,655 | 79.4 |
| 2000 | 40,348 | 50,978 | 79.1 |
| 2001 | 39,412 | 49,666 | 79.4 |
| 2002 | 38,699 | 48,853 | 79.2 |
| 2003 | 39,720 | 49,955 | 79.5 |
| 2004 | 40,823 | 51,694 | 79.0 |
| 2005 | 40,616 | 51,303 | 79.2 |
| 2006 | 41,578 | 52,330 | 79.5 |
| 2007 | 43,778 | 55,077 | 79.5 |
| 2008 | 45,112 | 56,733 | 79.5 |
| 2009 | 44,456 | 55,907 | 79.5 |
| 2010 | 44,936 | 56,039 | 80.2 |
| 2011 | 44,589 | 55,956 | 79.7 |
| 2012 | 44,243 | 55,274 | 80.0 |
| 2013 | 42,849 | 53,424 | 80.2 |
| 2014 | 43,424 | 54,037 | 80.4 |
| 2015 | 42,267 | 52,525 | 80.5 |
| 2016 | 41,877 | 51,863 | 80.7 |
| 2017 | 40,417 | 50,246 | 80.4 |
| 2018 | 39,658 | 49,000 | 80.9 |
| 2019 | 38,168 | 47,290 | 80.7 |
| 2020 | 36,609 | 45,496 | 80.5 |
| 20213 | 36,573 | 45,778 | 79.9 |
1. This table includes records that could not be assigned an income employment decile And are therefore not included in the rest of the analysis.
2. Babies identified as an appropriate weight for gestational age are those with a birthweight between the 10th and 90th percentile. Previously the 5th and 95th percentiles were used. See annex 2 for more information.
3. 2021 data are provisional and may be updated in future reports.
Inequalities in healthy birthweight babies 2021
In 2021, there was a marginal difference between the most and the least deprived areas in terms of the proportion of healthy birthweight babies, with a slightly higher percentage of healthy birthweight babies born to mothers living in the most deprived areas (80.3% in the most deprived areas compared with 80.0% in the least deprived areas).
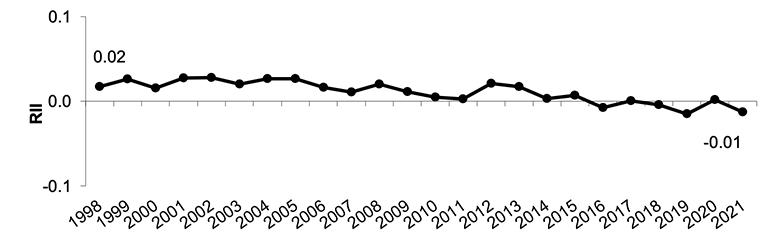
Trends in relative inequalities
Relative inequalities have been consistently low over the times series. The RII for 2021 is -0.01, suggesting that the relative inequality for this indicator is very small.
Trends in absolute inequalities
The absolute gap between the percentage of healthy birthweight babies born to mothers in the most and least deprived deciles has been consistently low across the full time series (0.3 percentage points in 2021). In some years the gap was in the opposite direction to the rest of the time series, with a slightly higher proportion of heathy weight babies born to mothers living in the most deprived areas.
Drug-related hospital admissions aged under 75 years
Trends in drug-related hospital admissions
In 2021/22, just under 9,100 individuals under the age of 75 were admitted to hospital for drug-related issues.
The rate of drug-related hospital admissions, which is based on the number of patients admitted to general acute and psychiatric specialties for drug misuse in each financial year, has shown a general upward trend since the start of the time series, increasing from 63.8 per 100,000 in 1996/97 to 224.2 per 100,000 in 2019/20 and then decreasing in 2020/21 and 2021/22, (188.0 per 100,000 in 2021/22). This fall may be due to the impact of the COVID-19 pandemic rather than a genuine reduction in drug misuse incidents requiring hospitalization.
In their annual drug-related hospital statistics in Scotland report[18], PHS note that there was a decrease in drug-related hospital stays during the COVID-19 pandemic which is inconsistent with the previous upward trend. Analysis found that the number of drug-related hospital stays in April 2020 was 29% lower than the average number of stays in April 2018 and 2019, likely due to the measures put in place in response to the COVID-19 pandemic. In May 2020, however, hospital stays were 6% higher than in May 2018 and 2019 and from May 2020 to June 2021 drug-related hospital stays were broadly similar to the 2018 and 2019 average for the same time period. From July 2021 to March 2022 drug-related hospital stays were lower than the 2018 and 2019 average, decreasing from 10% lower in July 2021 to 26% lower in March 2022.
It is unclear whether the changes in drug-related hospital stays, which coincide with the start of the pandemic, were a result of genuine differences in drug use, changes to hospital admission policies, or whether national and local restrictions in place, such as indoor physical distancing and the closure of nightclubs, may have influenced access to and use of drugs. The continuing reduction in hospital stays observed in 2021/22 could also suggest a new trend in drug admissions which is not yet fully understood[19].
| Year | Total admissions1 | Population | Rate per 100,000 (EASR) |
|---|---|---|---|
| 1996/97 | 3,354 | 4,754,906 | 63.8 |
| 1997/98 | 3,792 | 4,740,269 | 73.4 |
| 1998/99 | 4,386 | 4,729,975 | 86.0 |
| 1999/00 | 4,728 | 4,721,298 | 94.0 |
| 2000/01 | 4,839 | 4,708,667 | 97.3 |
| 2001/02 | 5,193 | 4,703,661 | 105.4 |
| 2002/03 | 5,409 | 4,701,958 | 110.7 |
| 2003/04 | 5,121 | 4,702,431 | 105.9 |
| 2004/05 | 5,292 | 4,714,233 | 109.7 |
| 2005/06 | 5,019 | 4,735,320 | 104.0 |
| 2006/07 | 5,262 | 4,752,425 | 108.8 |
| 2007/08 | 5,790 | 4,783,452 | 119.3 |
| 2008/09 | 6,120 | 4,811,453 | 125.9 |
| 2009/10 | 6,009 | 4,835,007 | 124.0 |
| 2010/11 | 6,432 | 4,858,058 | 132.6 |
| 2011/12 | 6,384 | 4,888,316 | 131.1 |
| 2012/13 | 6,033 | 4,895,114 | 124.5 |
| 2013/14 | 6,624 | 4,903,074 | 137.5 |
| 2014/15 | 6,978 | 4,914,362 | 144.7 |
| 2015/16 | 7,830 | 4,935,283 | 162.2 |
| 2016/17 | 8,598 | 4,962,391 | 178.2 |
| 2017/18 | 9,246 | 4,976,829 | 191.7 |
| 2018/19 | 10,005 | 4,983,364 | 207.3 |
| 2019/20 | 10,860 | 4,997,455 | 224.2 |
| 2020/21 | 10,335 | 4,996,183 | 213.4 |
| 2021/22 | 9,093 | 5,001,617 | 188.0 |
1. Total admissions counts the number of individuals who have been admitted to hospital for drug misuse in each financial year. Individuals admitted to hospital multiple times in the same financial year will only be included once per year.
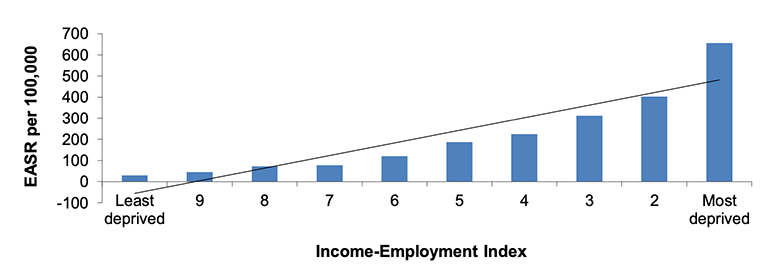
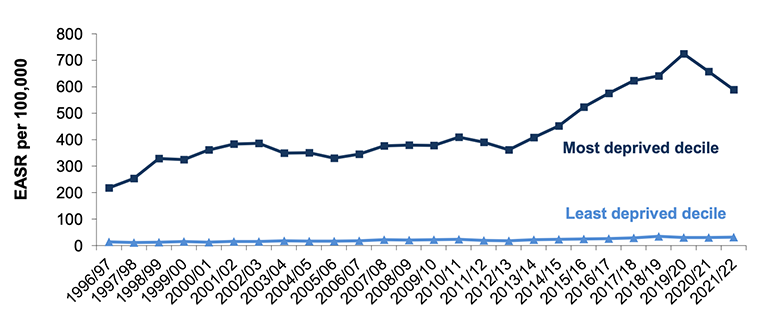
Inequalities in drug-related hospital admissions, 2021/22
In 2021/22 the admission rate in Scotland's most deprived areas was 19 times greater than that of the least deprived areas (589.4 cases per 100,000 compared to 31.1 per 100,000).
Trends in relative inequalities
The RII for patients with drug-related hospital admissions has fluctuated over time. Although it has decreased from a high of 3.05 in 1998/99 the RII for 2021/22 (2.87) is higher than at the start of the time series (2.77).
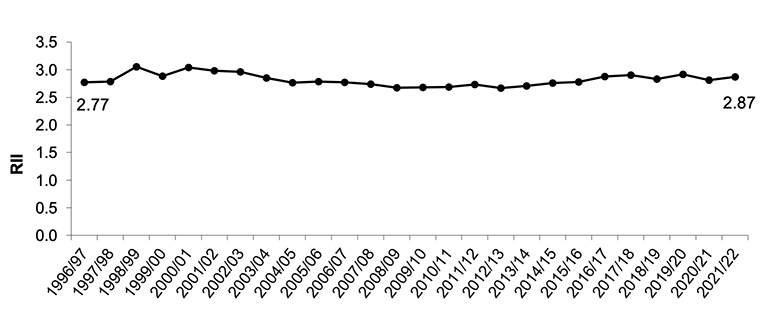
Since 1996/97 admission rates (aged <75) have ranged from 15-28 times higher in the most deprived areas compared to the least deprived areas.
Trends in absolute inequalities
The absolute gap in drug-related hospital admission rates between those living in the most deprived areas and the least deprived areas has increased overall since the start of the time series. After an initial increase between 1996/97 and 1998/99 the absolute gap remained relatively stable, ranging from 309.6 – 385.7 per 100,000 between 1999/00 and 2013/14. The gap then increased each year to reach a high of 694.3 per 100,000 in 2019/20 before falling over the last two year to 626.6 per 100,000 in 2020/21 and 558.3 in 2021/22.
These fluctuations have mainly been driven by changes in drug-related hospital admissions in the most deprived areas, with drug-related hospital admissions in the least deprived areas also increasing but at a much lower scale.
Between 2020/21 and 2021/22 the rate of hospital admissions for those living in the most deprived areas decreased by 11%, having fallen 10% between 2019/20 and 2020/21. These decreases go against the upward trend that was observed between 2012/13 – 2019/20 and it is therefore possible that the reduction is a result of hospital admissions policies associated with the COVID-19 pandemic, rather than a genuine decrease in the number of incidences requiring hospitalization.
Contact
Email: morag.shepherd@gov.scot