Long-term Monitoring of Health Inequalities March 2023 report
Annual update of the long-term monitoring of health inequalities headline indicators.
Headline indicator of Health Inequalities
Healthy Life Expectancy (HLE)
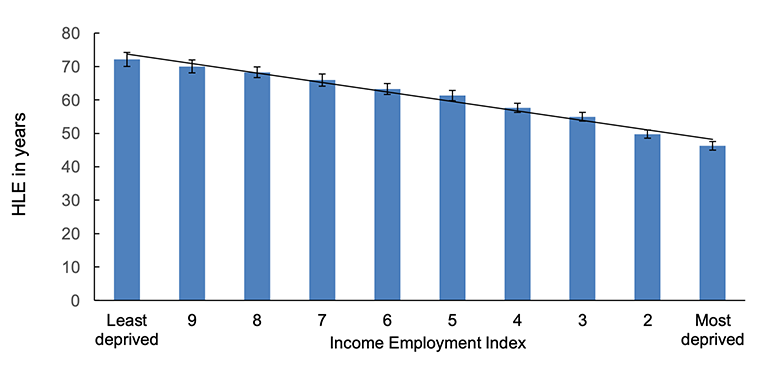
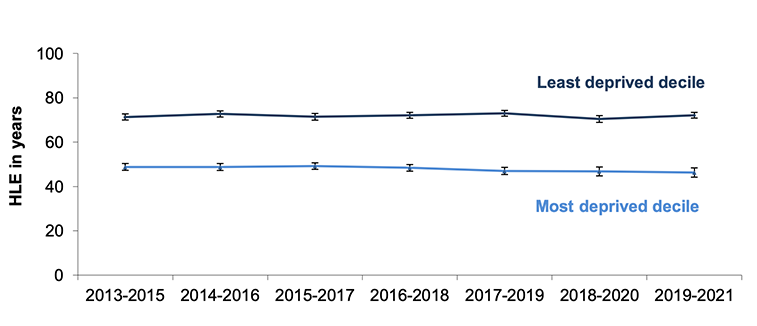
In 2019-2021, male HLE at birth was 46.3 years for those living in the most deprived areas, 25.8 years lower than those living in the least deprived areas (72.1 years).
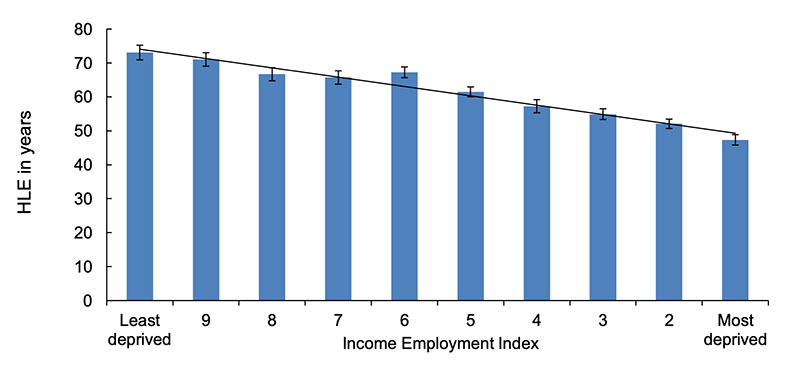
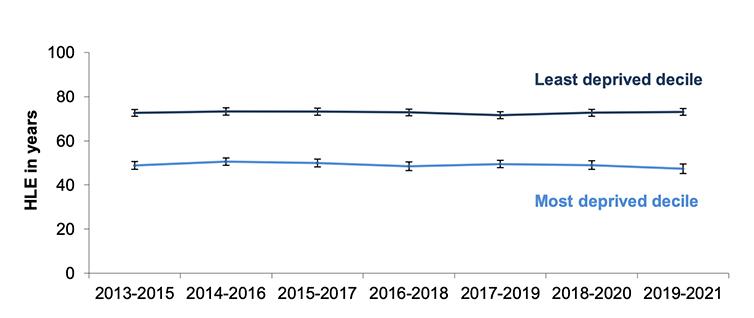
Female HLE at birth was 47.3 years for those living in the most deprived areas, 25.7 years lower than those living in the least deprived areas (73.1 years).
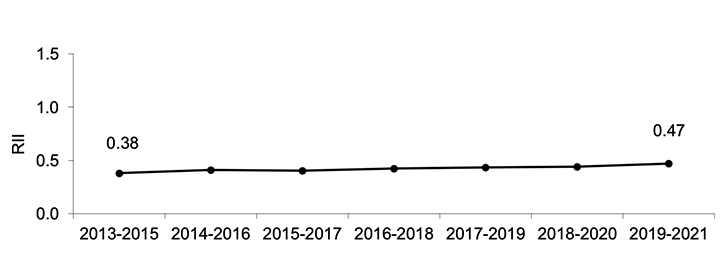
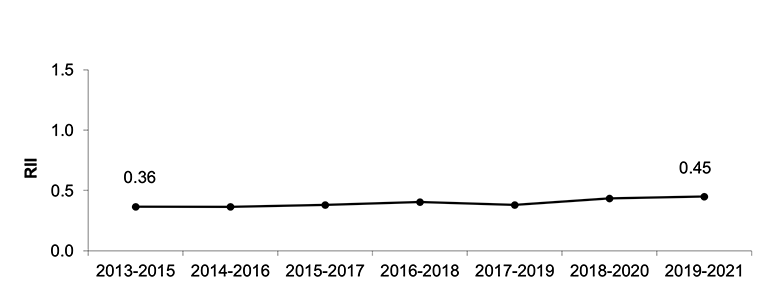
The relative index of inequality has increased to its highest level for both males and females since the start of the time series, increasing from 0.38 to 0.47 for males and from 0.36 to 0.45 for females between 2013-2015 and 2019-2021.
The absolute gap in HLE has increased for males since the start of the time series, from 23.8 years in 2013-2015 to 25.8 years in 2019-2021.
The absolute gap has also increased for females from 23.8 years in 2013-2015 to 25.7 years in 2019-2021, the largest gap in the time series.
The latest HLE figures are calculated with data from 2019, 2020 and 2021, meaning the data includes two years of the COVID-19 pandemic, so we might expect to see some impact on the estimates. However, HLE estimates have large confidence intervals, making it difficult to compare year on year change and directly measure the impact of the pandemic. Additionally, annual population survey data used in the calculation of HLE only asks people to say whether they are in good or poor health and not what is causing their poor health.
However, National Records of Scotland (NRS) have undertaken some analysis on the impact of the COVID-19 pandemic on life expectancy in Scotland. This information is available in the Life Expectancy in Scotland, 2019-2021 report[2].
Trends in HLE
HLE at birth for males increased between 2013-2015 and 2015-2017 (from 61.8 years to 62.3 years) and has since fallen to its lowest level, 60.4 years in 2019-2021. Similarly for females, HLE increased between 2013-2015 and 2014-2016 (from 62.7 years to 63.3 years) before decreasing to its lowest level in 2019-2021 (61.1 years).
Inequalities in HLE, 2019-2021
HLE is lower for those living in the most deprived areas than for those living in the least deprived areas. In 2019-2021 males in the most deprived areas were, on average, expected to live 25.8 fewer years in good health than those in the least deprived areas (46.3 years vs 72.1 years). Females in the most deprived areas were, on average, expected to live 25.7 fewer years in good health than those in the least deprived areas (47.3 years vs 73.1 years).
Trends in relative inequalities
TheRII has increased to its highest level for both males and females since the start of the time series, increasing from 0.38 to 0.47 for males and from 0.36 to 0.45 for females between 2013-2015 and 2019-2021.
Trends in absolute inequalities
The absolute gap in HLE has increased overall for males since the start of the time series, from 22.5 years in 2013-2015 to a high of 26.0 in 2017-2019 before falling to 25.8 in 2019-2021
The absolute gap in HLE for females has increased since the start of the time series, from 23.8 years in 2013-2015 to 25.7 years in 2019-2021 and the gap is currently the largest gap in the time series.
Healthy Life Expectancy and Life Expectancy, 2013-2015 to 2019-2021
Based on HLE and life expectancy (LE) we can estimate the proportion of life spent in good health. In 2019-2021 males were estimated to spend 78.9% of their life in good health, while females were estimated to spend 75.6% of their life in good health.
Males and females in the most deprived areas in Scotland are estimated to spend a much lower proportion of their life in good health than those living in the least deprived areas. In 2019-2021 males living in the most deprived areas spent 67.3% of their life in good health, compared to 87.3% for males living in the least deprived areas. Similarly, in 2019-2021, females living in the most deprived areas spent 62.9% of their life in good health, compared to 85.3% for females living in the least deprived areas.
| Confidence Intervals | Confidence Intervals | Proportion of life spent in good health | ||||||
|---|---|---|---|---|---|---|---|---|
| Male HLE in years | 95% LL | 95% UL | Male LE in years | 95% LL | 95% UL | |||
| 2013-2015 | Scotland | 61.8 | 61.4 | 62.2 | 77.1 | 77.0 | 77.2 | 80.2 |
| Most deprived decile | 48.8 | 47.3 | 50.3 | 70.2 | 69.9 | 70.6 | 69.5 | |
| Least deprived decile | 71.3 | 70.0 | 72.7 | 82.5 | 82.2 | 82.8 | 86.5 | |
| 2014-2016 | Scotland | 62.2 | 61.8 | 62.6 | 77.1 | 77.0 | 77.2 | 80.7 |
| Most deprived decile | 48.8 | 47.2 | 50.3 | 70.0 | 69.7 | 70.3 | 69.7 | |
| Least deprived decile | 72.7 | 71.3 | 74.1 | 82.5 | 82.2 | 82.8 | 88.1 | |
| 2015-2017 | Scotland | 62.3 | 61.9 | 62.7 | 77.0 | 76.9 | 77.1 | 80.9 |
| Most deprived decile | 49.2 | 47.7 | 50.6 | 69.9 | 69.6 | 70.2 | 70.4 | |
| Least deprived decile | 71.4 | 69.9 | 72.9 | 82.6 | 82.3 | 82.9 | 86.5 | |
| 2016-2018 | Scotland | 61.9 | 61.5 | 62.3 | 77.1 | 77.0 | 77.2 | 80.3 |
| Most deprived decile | 48.4 | 46.9 | 49.9 | 69.7 | 69.4 | 70.0 | 69.4 | |
| Least deprived decile | 72.1 | 70.7 | 73.4 | 82.7 | 82.4 | 83.0 | 87.2 | |
| 2017-2019 | Scotland | 61.7 | 61.3 | 62.1 | 77.2 | 77.2 | 77.1 | 79.9 |
| Most deprived decile | 47.0 | 45.4 | 48.6 | 69.6 | 69.3 | 70.0 | 67.5 | |
| Least deprived decile | 73.0 | 71.7 | 74.3 | 82.9 | 82.6 | 83.1 | 88.1 | |
| 2018-2020 | Scotland | 60.9 | 60.4 | 61.4 | 76.8 | 76.7 | 76.9 | 79.3 |
| Most deprived decile | 46.8 | 44.8 | 48.8 | 69.1 | 68.7 | 69.4 | 67.7 | |
| Least deprived decile | 70.4 | 68.9 | 71.9 | 82.7 | 82.5 | 83.0 | 85.1 | |
| 2019-2021 | Scotland | 60.4 | 59.9 | 60.9 | 76.6 | 76.5 | 76.7 | 78.9 |
| Most deprived decile | 46.3 | 44.2 | 48.4 | 68.7 | 68.4 | 69.1 | 67.3 | |
| Least deprived decile | 72.1 | 70.8 | 73.4 | 82.6 | 82.4 | 82.9 | 87.3 | |
| Confidence Intervals | Confidence Intervals | Proportion of life spent in good health | ||||||
|---|---|---|---|---|---|---|---|---|
| Female HLE in years | 95% LL | 95% UL | Female LE in years | 95% LL | 95% UL | |||
| 2013-2015 | Scotland | 62.7 | 62.3 | 63.2 | 81.1 | 81.0 | 81.2 | 77.3 |
| Most deprived decile | 48.8 | 47.1 | 50.6 | 76.6 | 76.3 | 76.9 | 63.8 | |
| Least deprived decile | 72.6 | 71.1 | 74.2 | 84.7 | 84.5 | 85.0 | 85.7 | |
| 2014-2016 | Scotland | 63.3 | 62.9 | 63.8 | 81.1 | 81.1 | 81.2 | 78.0 |
| Most deprived decile | 50.6 | 48.9 | 52.2 | 76.2 | 75.9 | 76.5 | 66.3 | |
| Least deprived decile | 73.3 | 71.6 | 74.9 | 84.9 | 84.6 | 85.2 | 86.3 | |
| 2015-2017 | Scotland | 62.6 | 62.2 | 63.1 | 81.1 | 81.0 | 81.2 | 77.3 |
| Most deprived decile | 49.9 | 48.2 | 51.7 | 75.8 | 75.5 | 76.1 | 65.9 | |
| Least deprived decile | 73.2 | 71.6 | 74.8 | 85.1 | 84.9 | 85.4 | 85.9 | |
| 2016-2018 | Scotland | 62.2 | 61.7 | 62.7 | 81.1 | 81.0 | 81.2 | 76.7 |
| Most deprived decile | 48.5 | 46.5 | 50.4 | 75.8 | 75.5 | 76.1 | 63.9 | |
| Least deprived decile | 72.8 | 71.3 | 74.3 | 85.2 | 84.9 | 85.5 | 85.5 | |
| 2017-2019 | Scotland | 61.9 | 61.5 | 62.4 | 81.1 | 81.2 | 81.1 | 76.3 |
| Most deprived decile | 49.5 | 47.8 | 51.1 | 75.8 | 75.5 | 76.1 | 65.3 | |
| Least deprived decile | 71.6 | 70.0 | 73.2 | 85.6 | 85.3 | 85.8 | 83.6 | |
| 2018-2020 | Scotland | 61.8 | 61.3 | 62.3 | 81.0 | 80.9 | 81.1 | 76.3 |
| Most deprived decile | 49.0 | 47.1 | 51.0 | 75.6 | 75.3 | 75.9 | 64.9 | |
| Least deprived decile | 72.6 | 71.1 | 74.2 | 85.6 | 85.4 | 85.9 | 84.8 | |
| 2019-2021 | Scotland | 61.1 | 60.5 | 61.7 | 80.8 | 80.7 | 80.9 | 75.6 |
| Most deprived decile | 47.3 | 45.2 | 49.5 | 75.2 | 74.9 | 75.5 | 62.9 | |
| Least deprived decile | 73.1 | 71.6 | 74.6 | 85.7 | 85.4 | 85.9 | 85.3 | |
Premature mortality (under 75 years)
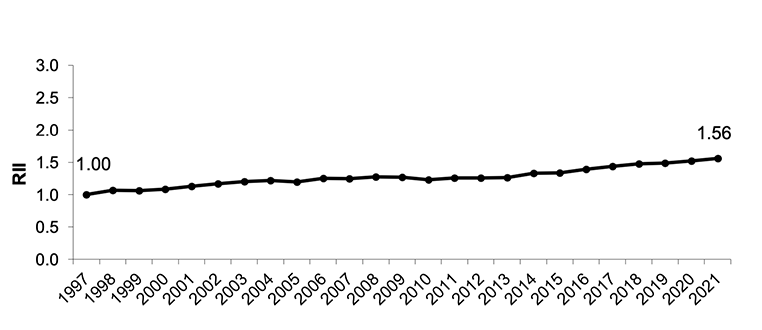
In 2021, the gap in premature mortality rates between the most and least deprived areas increased to its highest point since 2003 (684.2 per 100,000 and 703.5 per 100,000 respectively), and is higher than at the start of the time series (648.7 per 100,000 in 1997). Relative inequalities have widened over the long term and are now at the highest point in the time series (1.56).
In 2021, premature mortality rates were 4 times higher in the most deprived areas compared to the least deprived, an increase from 3 times higher in 1997.
The first case of COVID-19 in Scotland occurred on the 1st March 2020, with the first death caused by COVID-19 occurring in Scotland on the 13th March 2020[3]. Data published by National Records of Scotland found that in both 2020 and 2021 there were significant increases in avoidable mortality, defined as 'deaths which are considered either preventable or treatable through public heath interventions or timely and effective healthcare[4], largely due to COVID-19 deaths[4]. In addition, in 2020/21 COVID-19 drove an increase in winter deaths, responsible for almost two-thirds of additional deaths in winter 2020/21[5]. It is therefore likely that the COVID-19 pandemic will have had an impact on the premature mortality rates for 2020 and 2021.
Trends in premature mortality
Over 24,000 people in Scotland died before the age of 75 in 2021.
Over the long term there has been a reduction in the mortality rate among under-75s. However, the European Age-Standardised mortality rate (EASR) among under-75s in 2021 was 465.9 per 100,000 people, the highest rate since 2010.
| Year | Number of deaths | Target population size | Rate per 100,000 (EASR) |
|---|---|---|---|
| 1997 | 26,081 | 4,740,269 | 651.9 |
| 1998 | 25,857 | 4,729,975 | 643.3 |
| 1999 | 25,491 | 4,721,298 | 632.5 |
| 2000 | 24,593 | 4,708,667 | 607.3 |
| 2001 | 24,168 | 4,703,661 | 593.1 |
| 2002 | 24,219 | 4,701,958 | 588.9 |
| 2003 | 23,789 | 4,702,431 | 573.4 |
| 2004 | 22,896 | 4,714,233 | 546.2 |
| 2005 | 22,441 | 4,735,320 | 530.3 |
| 2006 | 22,237 | 4,752,425 | 520.4 |
| 2007 | 22,359 | 4,783,452 | 516.8 |
| 2008 | 22,005 | 4,811,453 | 501.3 |
| 2009 | 21,229 | 4,835,007 | 477.0 |
| 2010 | 20,997 | 4,858,058 | 467.4 |
| 2011 | 20,685 | 4,888,316 | 456.1 |
| 2012 | 20,446 | 4,895,114 | 445.3 |
| 2013 | 20,344 | 4,903,074 | 437.5 |
| 2014 | 19,961 | 4,914,362 | 423.2 |
| 2015 | 20,988 | 4,935,283 | 440.5 |
| 2016 | 21,313 | 4,962,391 | 439.7 |
| 2017 | 20,992 | 4,976,829 | 425.2 |
| 2018 | 21,601 | 4,983,364 | 432.0 |
| 2019 | 21,501 | 4,997,455 | 425.6 |
| 2020 | 23,370 | 4,996,183 | 457.4 |
| 2021 | 24,060 | 5,001,617 | 465.9 |
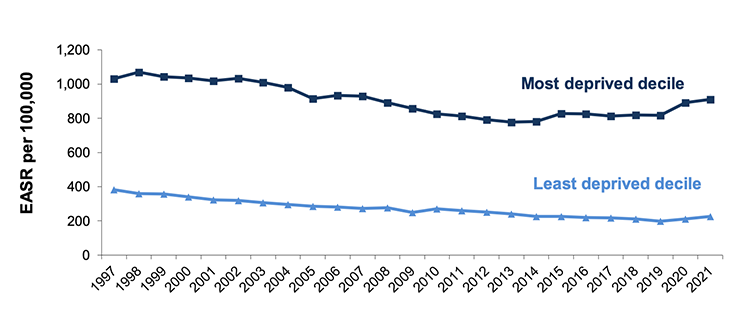
Inequalities in premature mortality, 2021
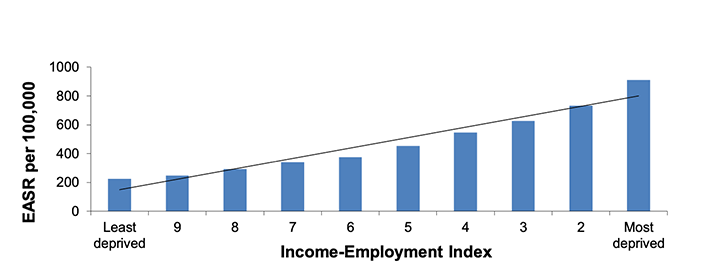
In 2021, the premature mortality rate in the most deprived areas was 909.7 per 100,000, four times higher than the rate in the least deprived areas (225.5 per 100,000).
Trends in relative inequalities
Over the longer term, relative inequalities have increased. The RII for 2021 is the highest in the time series at 1.56, compared with 1.00 at the start of the time series in 1997.
Between 1997 and 2014, premature mortality rates were three times higher in the most deprived areas compared to the least deprived; in the last six years premature mortality rates have been four times higher in the most deprived areas.
Trends in absolute inequalities
The gap in absolute inequalities in premature mortality between those living in the most and least deprived areas reached a peak in 2002 (713.4 per 100,000). Between 2002 and 2013 there was a general downward trend. Most notably, the absolute gap between the most and least deprived areas reduced every year between 2007 and 2013 (from 656.2 per 100,000 in 2007 to 536.0 per 100,000 in 2013). Since 2013 the gap has increased, and is currently at its highest point since 2003 at 684.2 per 100,000.
Analysis by NRS[6] for the period of March 2020 to January 2023 found that, after adjusting for age, people living in the most deprived areas were 2.3 times more likely to die with COVID-19 than those living in the least deprived areas. When looking at deaths from all causes the death rate is 1.9 times higher in the most deprived areas compared to the least deprived areas. As COVID-19 was one of the leading causes of death during this time period it suggests that the pandemic will have driven an increase in inequalities in premature mortality between those living in the most and least deprived areas in 2020 and 2021.
Contact
Email: morag.shepherd@gov.scot