Individual Training Accounts: evaluation
An evaluation of the Individual Training Account scheme.
Annex A: Analysis of the online survey
ITA applicants and recipients were surveyed to gain further understanding of the ITA users and how they use the programme.
The overall participant sample population was 21,956 contacts (12,685 for 2019/20; and 9,271 for 2021/22). The participant survey was launched on 1 April 2022 and closed on 1 May 2022, with 2,102 respondents overall (9.6% response rate) (1,160 for 2019/20 (9%); and 942 for 2021/22 (10%)). Participants were sent two reminders during April to complete the survey.
The overall applicant sample population was 1,757 contacts for 2021/22. Due to the way SDS' system temporarily stored applicant data, the applicant survey was distributed on a rolling basis and closed on 8 May 2022. There were 151 applicant responses, a 9% response rate. Applicants were sent one reminder during April to complete the survey.
Questions in the survey covered application journey, motivations for using the programme, reasons for not completing training (if relevant), outcomes and demographic classifications. Progressive then provided SQW with the results for each question in their raw format, and also broken down by demographics, use of ITA and by applicant or recipient status.
The data were cleaned. This included:
- Checking those who had answered the survey in under three minutes to check if they had consistently answered 'Don't know', 'Unsure' or 'Neither/nor'.
- Removing anyone found to be 'flatlining', i.e. providing the same answer to a range of questions or statement banks across the survey.
- Removing those who said they had never applied for an ITA.
- Excluding excessive outliers on numeric questions that were considerably deviated from average values.
- Upcoding was undertaken on responses where a respondent chose to provide their course name by open text rather than choosing one of the curriculum name options.
The final points worth noting are how the survey sample compares to the programme population as a whole. Contrasting the profile of those in the programme monitoring information to that of the survey we find there is under representation of ITA recipients aged 16-25 and 26-35, and overrepresentation of those aged 36 and older. This holds true for applicants as well as recipients. There is also overrepresentation of female recipients and under representative of male recipients – this also holds true for applicants but to a lesser degree.
For recipients and applicants more likely to disclose their ethnicity, there is slight minor underrepresentation of White and Asian / Asian British recipients, once adjusting for those who stated they preferred not to say. Finally, those reporting a disability are over represented in the survey and those out of work are vastly under represented – unemployed people account for 16% of survey respondents but 58% of the programme profile.
Survey profile
Of those who answered the survey, there were more women than men, half of respondents were aged between 25-44, 8% were minority ethnic and one in eight identified as disabled. Around two-thirds were in work – with half of respondents were working when they applied for an ITA, with an even split between full-time and one third had topped up their ITA above its £200 allowance. Just over half had received their ITA in 2019/20 and 42% in 2021/22; a further 7% listed as applicants were excluded from calculating totals relating to questions specifically about recipients.
Comparing the survey profile against that of the ITA population profile from the Management Information, which covers all people who booked courses, we conclude the survey profile:
- Under represents people aged 16-25 and 26-35, over represents people aged 36+. Same holds true for applicants.
- Over represents females and is under representative of male recipients. The same holds true for applicants but to a lesser degree.
- Slightly under represents White and Asian / Asian British people (after adjusting for prefer not to say) (although survey respondents were more likely to disclose their ethnicity than in the management information).
- Over represents those reporting a disability.
- Under represents those out of work. Those unemployed account for 16% of survey respondents, yet 58% of people who booked courses.
Most of these differences are not too large, although the low response from those who were unemployed is noticeable. In reporting results in the body of the report, we have therefore drawn on the management information where appropriate and in using the survey have sought to report differences within sub-groups, rather than across them, e.g. the unemployed group were.
| Survey Profile | ITA Population | |
|---|---|---|
| Male | 44% | 57% |
| Female | 53% | 43% |
| 16-35* | 31% | 57% |
| 36-55* | 48% | 35% |
| 56+* | 20% | 8% |
| Minority ethnic | 8% | 7%** |
| Disabled | 12% | 5% |
| Currently employed | 65% | 42% |
| Unemployed | 16% | 58% |
| Topped up their ITA | 34% | 24% |
Source: SQW analysis of survey and SDS data. ITA population is across all years of people who booked courses.*Age brackets of survey and ITA programme data differed by one year – brackets from the programme data are used. **Total does not include those answered 'Prefer not to say'.
How people found out about ITAs
The most common ways for a person to hear about ITAs was through the jobcentre / work coach (23%), through a training provider (20%), the SDS website or through family, friends or colleague (both 19%). Amongst those who topped up their ITA, hearing first from a training provider rose to 29%, while the jobcentre was more important for those who did not top up, 28%. These findings follow the logic that those who are employed are less likely to go to a jobcentre and are more able to top up.
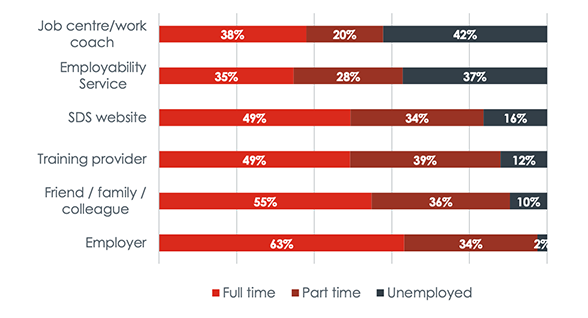
Source: SQW analysis of survey data. Note: respondents could select more than one option. Options with fewer than one hundred responses excluded.
Choosing a course
The ITA funding can be seen to have a good level of additionality, with 83% of respondents saying they definitely or probably would not have done the training without it. This figure is very consistent across all groups of age, gender and ethnicity, with the only exception being for 16-24 year olds where it drops to 74%, although this is still very high.
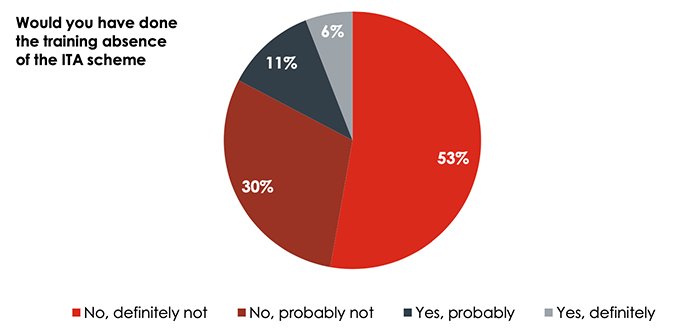
Source: SQW analysis of survey (n=2007)
ITAs also had a strong influence of which course a person chose. This is evidenced by 72% of people stating the funding had an influence, with over half of those surveyed saying it had had a major influence.
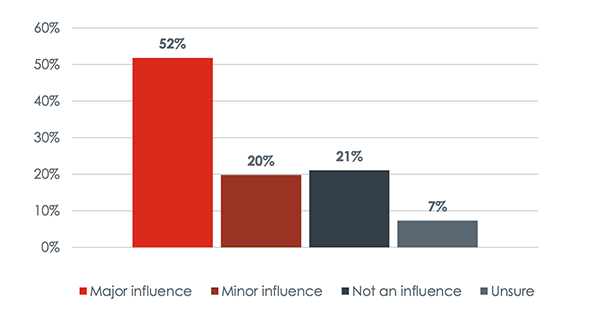
Source: SQW analysis of survey data (n=2102)
However, almost half (46%) found that their course had been restricted by the £200 funding limit, with around one in eight people saying it was very restrictive. Furthermore, if more funding had been available via the ITAs then over half of the respondents said they would have chosen a different course or training.
Of those who said they would have chosen a different course if more funding was available, 80% said the funding had provided less than half the cost of their preferred course. This would suggest a desire for people to use the ITA funding to help subsidise courses that may be more intensive or specialised.
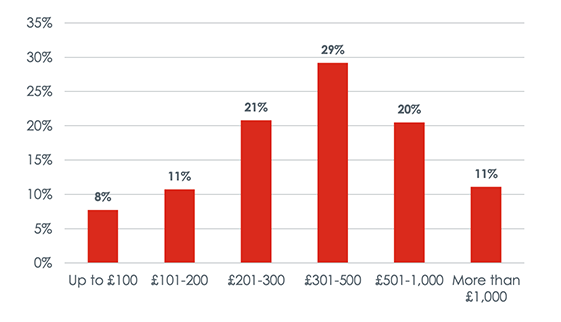
Source: SQW analysis of survey data (n=298)
Topping up funding
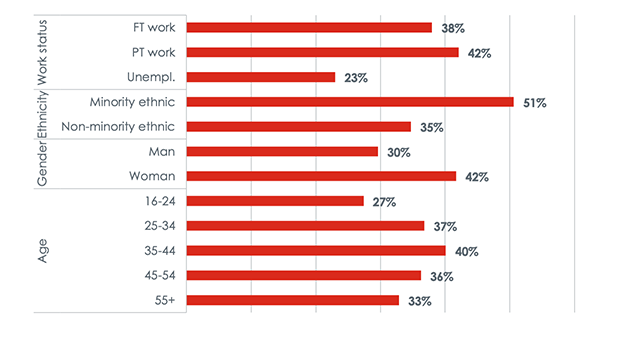
Over a third of survey respondents had topped up the funding (36%). The youngest and oldest cohorts were less likely to top up (27% and 33% respectively). Women were more likely to top up than men (42% vs. 30%) and ethnic minorities were more likely to top up compared to non-minority ethnics (51% compared to 35%).
Source: SQW analysis of survey data (n=2105)
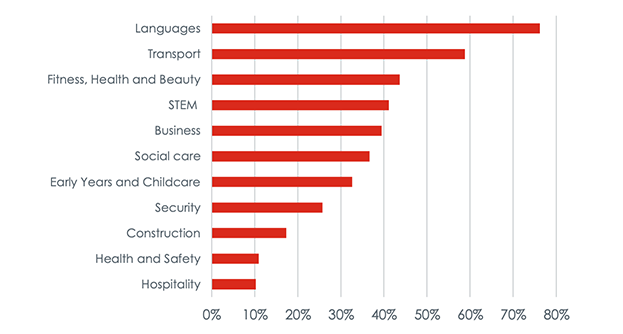
There was a mixture in the proportion of people topping up by course. Three quarters of people doing language courses and three fifths of people doing Transport had topped up their ITA, whereas for Hospitality and Health and Safety training this figure was only one-in-ten. When looking at how much was being topped up by course, one-third of those topping up Transport courses did so by over £200, whereas language courses had an even spread of those topping up between £50 - £200. Social Care and Early Years and Childcare were the only courses where over half of those topping up did so by over £200 – however the sample sizes at this level are low, so results should be taken with some caution.
Courses where people were more likely to top up by over £200 were more likely to say the ITA funding limit was not restrictive, with the opposite being true for those taking courses that were less likely to top up at all. This would suggest ITAs are being used to subsidise training costs of the more expensive courses and that the demand for training in cheaper courses is more responsive to how much funding is offered. In other words, courses have differing levels of price elasticity of demand, so varying levels of ITA funding cap will have more effects on some courses than others.
Source: SQW analysis of survey data (n=2007)
The ITA experience
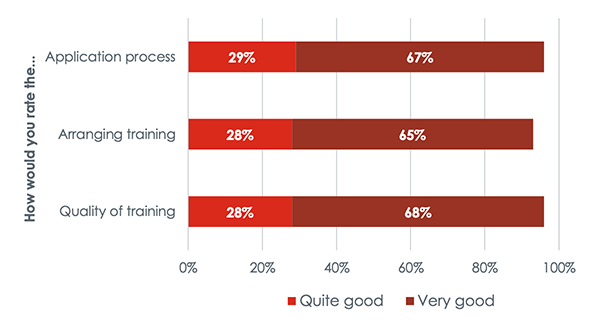
The majority of people had a positive experience throughout the programme journey from application to training. As shown in Figure A-7 below, over nine in ten people rated each part of the ITA process as quite good or very good, with all of the stages having a consistent distribution of ratings across all curriculum areas. For courses that had over 100 survey respondents giving feedback on the process, the lowest rating was for Languages (ESOL), which had 79% of people say the quality of the course was good, which is still remarkably high.
There is also a notable increase in the number of people answering 'very good' between 2019/20 and 2021/22. This increased by eight percentage points for the application experience, ten percentage points for arranging training and up one percentage point for the quality of the training.
Source: SQW analysis of survey data
Outcomes
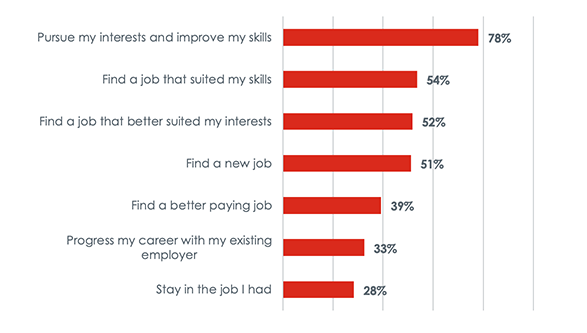
Nine out of ten people surveyed reported receiving at least one beneficial outcome as a result of the ITA programme. Benefits around improving skills and finding work that suited skills were most often cited, whilst outcomes relating to current employment were least mentioned.
Evidence suggests that ITAs had a relatively strong impact on helping unemployed people find new work and find work better suited to their skills. Indeed, of those who were unemployed at the time of applying for an ITA, three out of five said the programme had helped them achieve these outcomes. Survey respondents who were economically inactive were more likely to find the scheme had helped them pursue their interest and improve their skills than those in work or those unemployed (89% compared to 82% and 72% respectively).
The time of receiving an ITA had little effect on beneficial outcomes. Those receiving their ITAs in 2019/20 had very minor differences in outcomes compared to those receiving in 2021/22. The largest difference in outcomes between the two cohorts was a four percentage points increase in the 2021/22 group in saying the ITAs had helped them progress their career with their existing employer, and a three percentage point decrease in those saying it had helped them find a new job. Both of these outcomes are expected given the economic climate at the time.
Source: SQW analysis of survey data (n=1060). Respondents could select more than one option.
By demographics
Women were more likely to progress their career with same employer (34% compared to 31% for men) and pursue their interests and improve skills (84% compared to 71% for men); meanwhile ITAs were more likely to help the following groups find a job with a different employer:
- Young people (60% for 16-24 year olds compared to 39% of 55+)
- Men (62% compared to 43% for women)
- Minority Ethnic Groups (62% compared to 51% for non-minority ethnic groups).
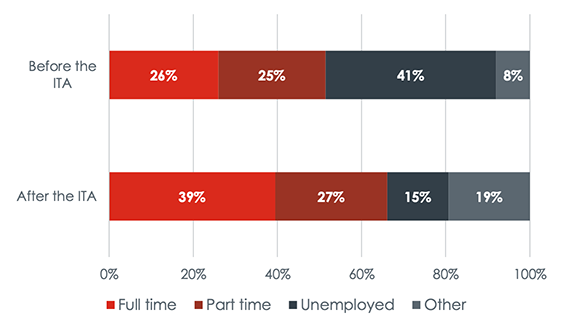
Meanwhile, almost one quarter of those who were unemployed at the time of their application reported that they were working full-time at the time of the survey and 17% were working part-time. Half of survey respondents agreed that their ITA had helped them find a new job, with younger people, men and ethnic minorities more likely to agree. The discrepancy between men and women stating the ITA had helped that find a new job was large, with 62% of men agreeing but only 43% of women. Young people, men and ethnic minorities were also more likely to agree that their ITA had helped them find a better paying job, to find a job that suited their skills, and find a job that better suited their interests.
There is some evidence to suggest ITAs are contributing to help people find work. The proportion of people in work rose from when they applied for an ITA to when they completed the survey from a half to two-thirds, whilst the number of people unemployed reduced by almost a third of its previous level. Of those reporting being unemployed when applying, almost half (47%) were in work after using their ITA, with three-quarters stating their main reason for applying to the programme was to find work.
Source: SQW analysis of survey data (n=2102)
Further development of ITAs
Over half of respondents did not wish to see any changes to the ITA scheme, indicating a good level of satisfaction from its users. This figure was consistent across demographics, recipient cohort and even top up status.
Areas for improvement
Of those who did want to see change three-quarters of people wanted to see an increase to the funding cap (equating to 15% of people overall). Interestingly, people who had topped up their ITA did not seem to see this as more of an issue than those who did not. On the other hand, men and ethnic minorities were more likely to want to see an increase to the funding limit than average.
The second most commonly supported area of improvement was to allow multiple applications for an ITA course per year, where just under one-in-ten people overall said this would improve the scheme. This was consistent across different groups of people.
How the scheme can help people complete their training
There was no definitive reason for why people did not complete their training following applying for an ITA. The most common reason given for not proceeding with the training was changes in circumstances (37%), with older age groups and women more likely to suggest this.
One-fifth of people who did not complete their training stated more funding would have encouraged them to do training, with the same proportion saying the ITA being valid for a longer period of time would have helped too.
Contact
Email: ceu@gov.scot