Coronavirus (COVID-19): impact on wellbeing - survey findings
Findings from wave 4 of a telephone survey we commissioned to better understand the impact of the COVID-19 pandemic on people in Scotland
1 Personal wellbeing
Key findings:
A third say they felt lonely at least some of the time in the week prior to the survey (a slight fall on March 2021).
Compared with March 2021, fewer people now report feeling 'less of a sense of purpose'.
People on low incomes and disabled people find it more difficult to quickly recover from adversity.
65% said that they felt lonely none, or almost none of the time in the week prior to the survey
Q How much of the time during the last week have you felt lonely?
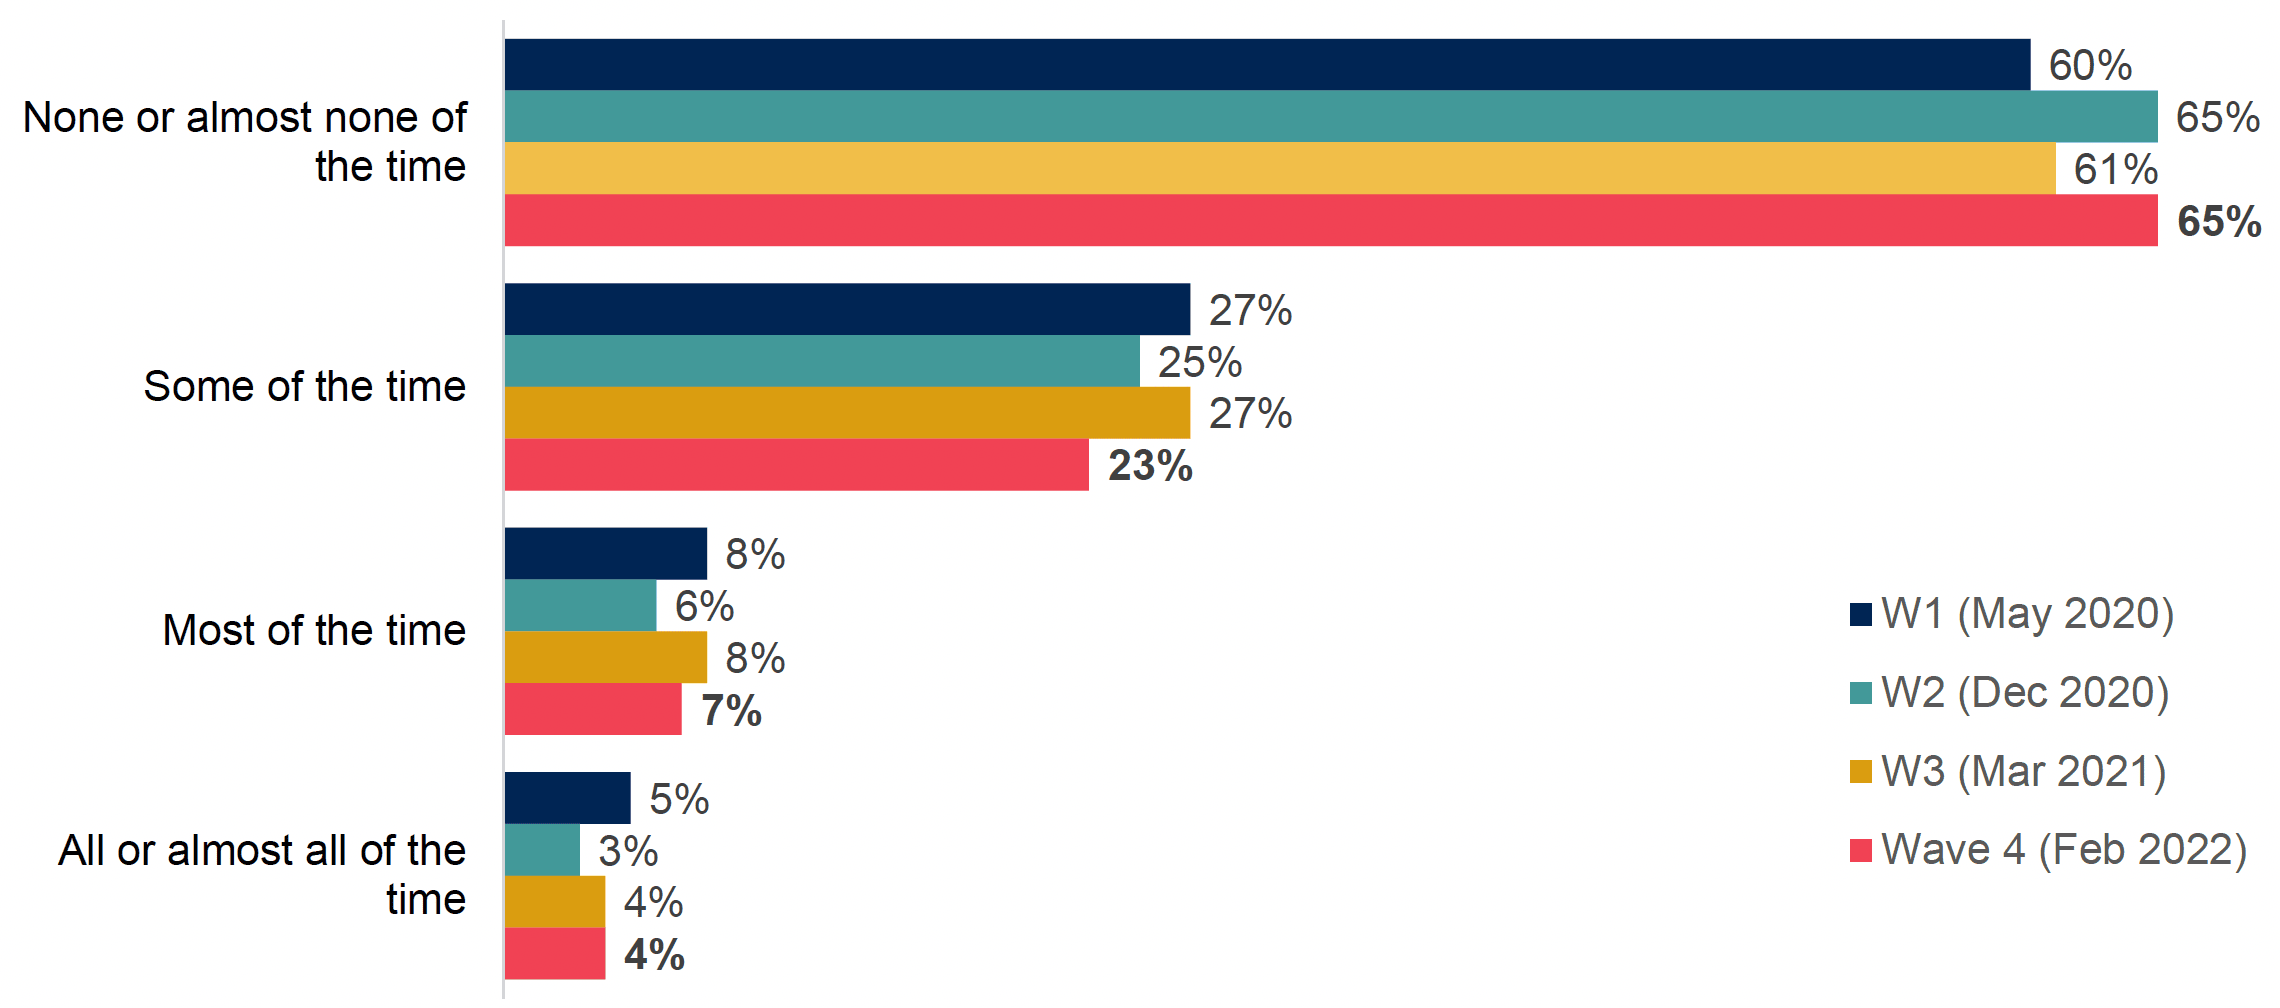
Base: W1 (1,000), W2 (1,004), W3 (1,000),W4 (1,006), All respondents
But 34% said they felt lonely at least some of the time
This was similar to December 2020, but a little lower than either May 2020 (40%) or March 2021 (39%), which were both conducted when lockdown or near lockdown restrictions were still in place (though the differences are modest – a reminder that Covid-19 restrictions are not the only factors affecting loneliness).
Felt lonely at least some of the time:
40% in W1 (May 2020)
34% in W2 (Dec 2020)
39% in W3 (Mar 2021)
34% in W4 (Feb 2022)
Groups more likely to report feeling lonely at least some of the time included:
- Women (39%, compared with 29% of men)
- 16-24 year-olds (44%, compared with 39% of 25-34 year-olds, 33% of 35-54 year-olds, 30% of 55-69 year-olds, and 33% of those aged 70 or older)
- Disabled people (55%, compared with 26% non- disabled people)
Average anxiety levels are in line with those from March 2021, with 41% reporting that they did not feel anxious at all
Q Overall, how anxious did you feel yesterday, on a scale of 0 to 10 where 0 is not at all anxious and 10 is completely anxious?
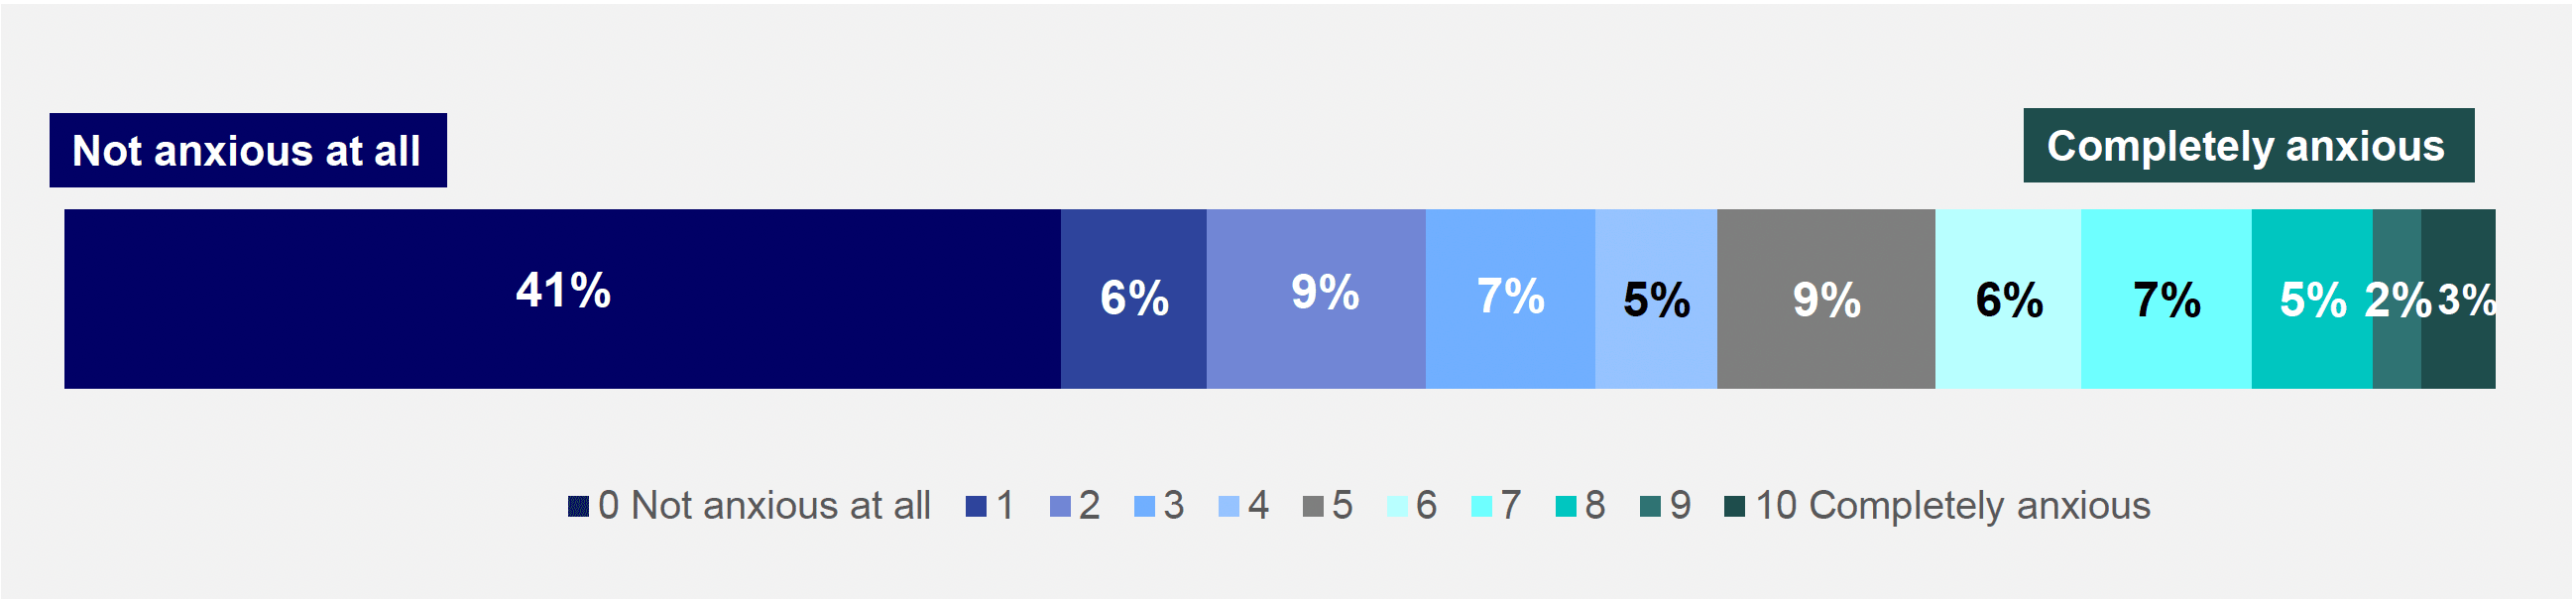
Base: 1,006 respondents age 16+ resident in Scotland; fieldwork = January 26 - February 11 2022
W1 mean score: 3.6
W2 mean score: 3.0
W3 mean score: 2.8
W4 mean score: 2.8
However, anxiety continues to be unevenly distributed
- Mean anxiety (2.8 overall) was higher among:
- People under 35 (3.5 among 16-24 year-olds, 3.4 among 25-34 year-olds, 3.0 among 35-54 year-olds, 2.3 among those 55-69, and 2.0 among those aged 70+ - very close to the mean scores by age at Wave 3)
- Women (3.1, compared with 2.4 for men)
- People on lower incomes (3.5 among those with incomes under £15,600, compared with 2.4 for those with incomes of £52,000 or more)
- Disabled people (4.4, compared with 2.2 among non-disabled people)
- Unpaid carers (3.4 among those who give unpaid regular help or support to others because of long-term ill health or disability or issues relating to old age, compared with
2.5 among those without such unpaid caring responsibilities)
There has been a significant drop since Wave 3 (March 2021) in the proportion who feel they have less of a sense of purpose at the moment
However, 40% still say they are sleeping badly, broadly in line with figures for December 2020 and March 2021
Q Which of the following statements apply to you?
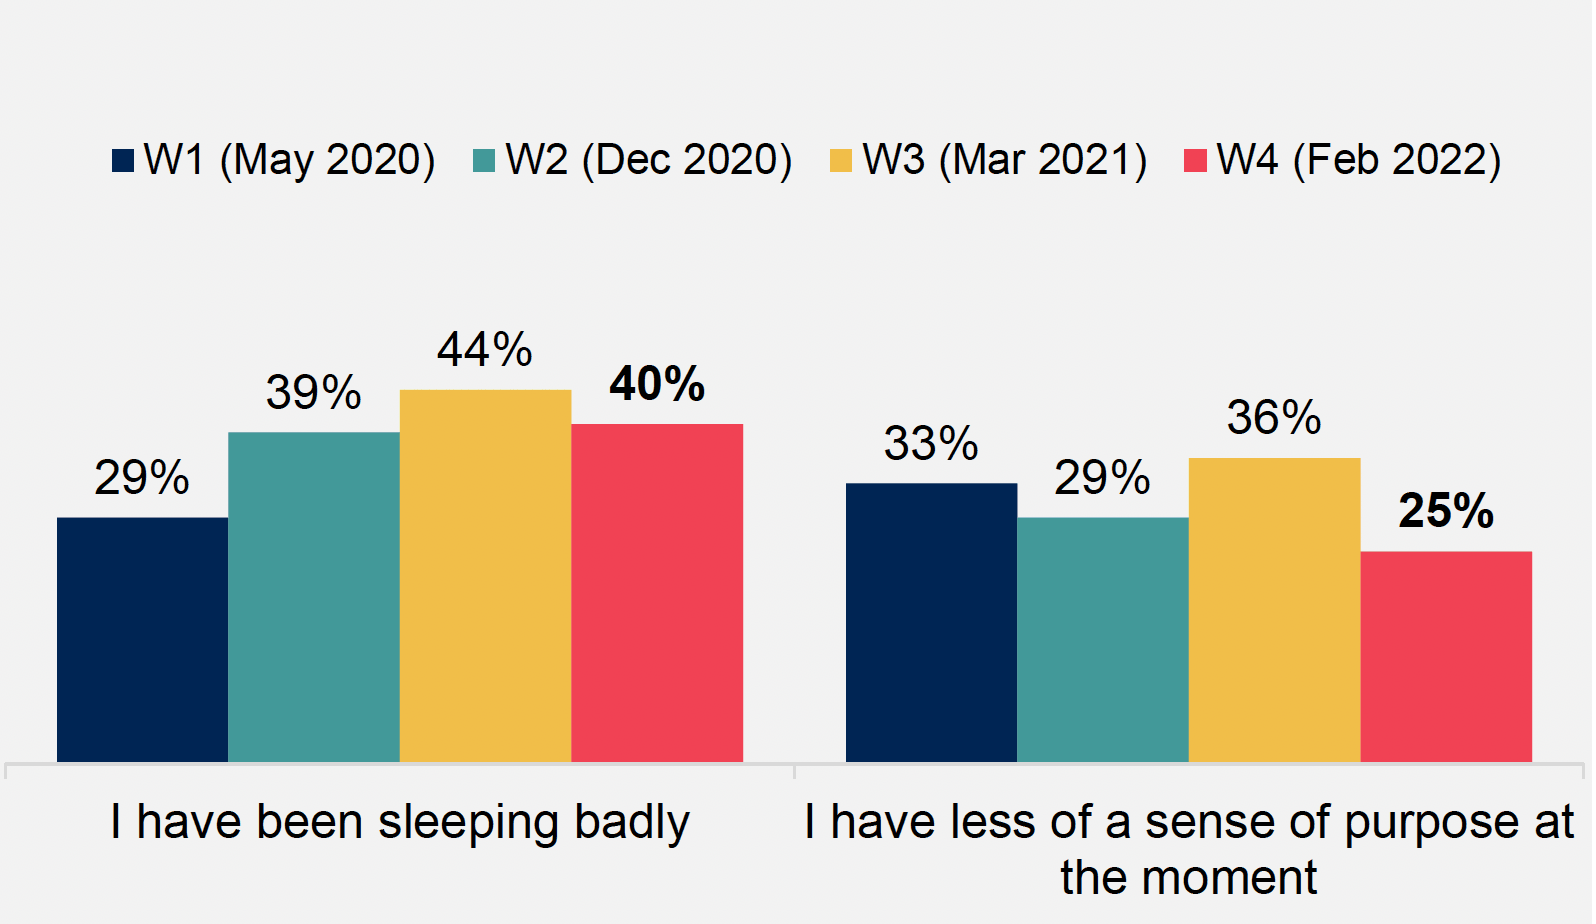
Base: 1,006 respondents age 16+ resident in Scotland; fieldwork = January 26 - February 11 2022
Groups who are more likely than average to report a loss of sense of purpose include:
- Disabled people (48%, vs 17% non- disabled people)
- Those not currently in work (excluding retired people) (40%, compared with 25% overall)
- People on lower incomes (40% of those on less than £15,600, compared with 19% of those on £52,000 or more)
Most people's responses to questions on dealing with adversity suggest a degree of resilience
76% agree that they tend to bounce back quickly after hard times, and 68% disagree that they tend to take a long time to get over setbacks in their life
Q Different people deal with stress in different ways. For each of the following, please say how strongly you agree or disagree …
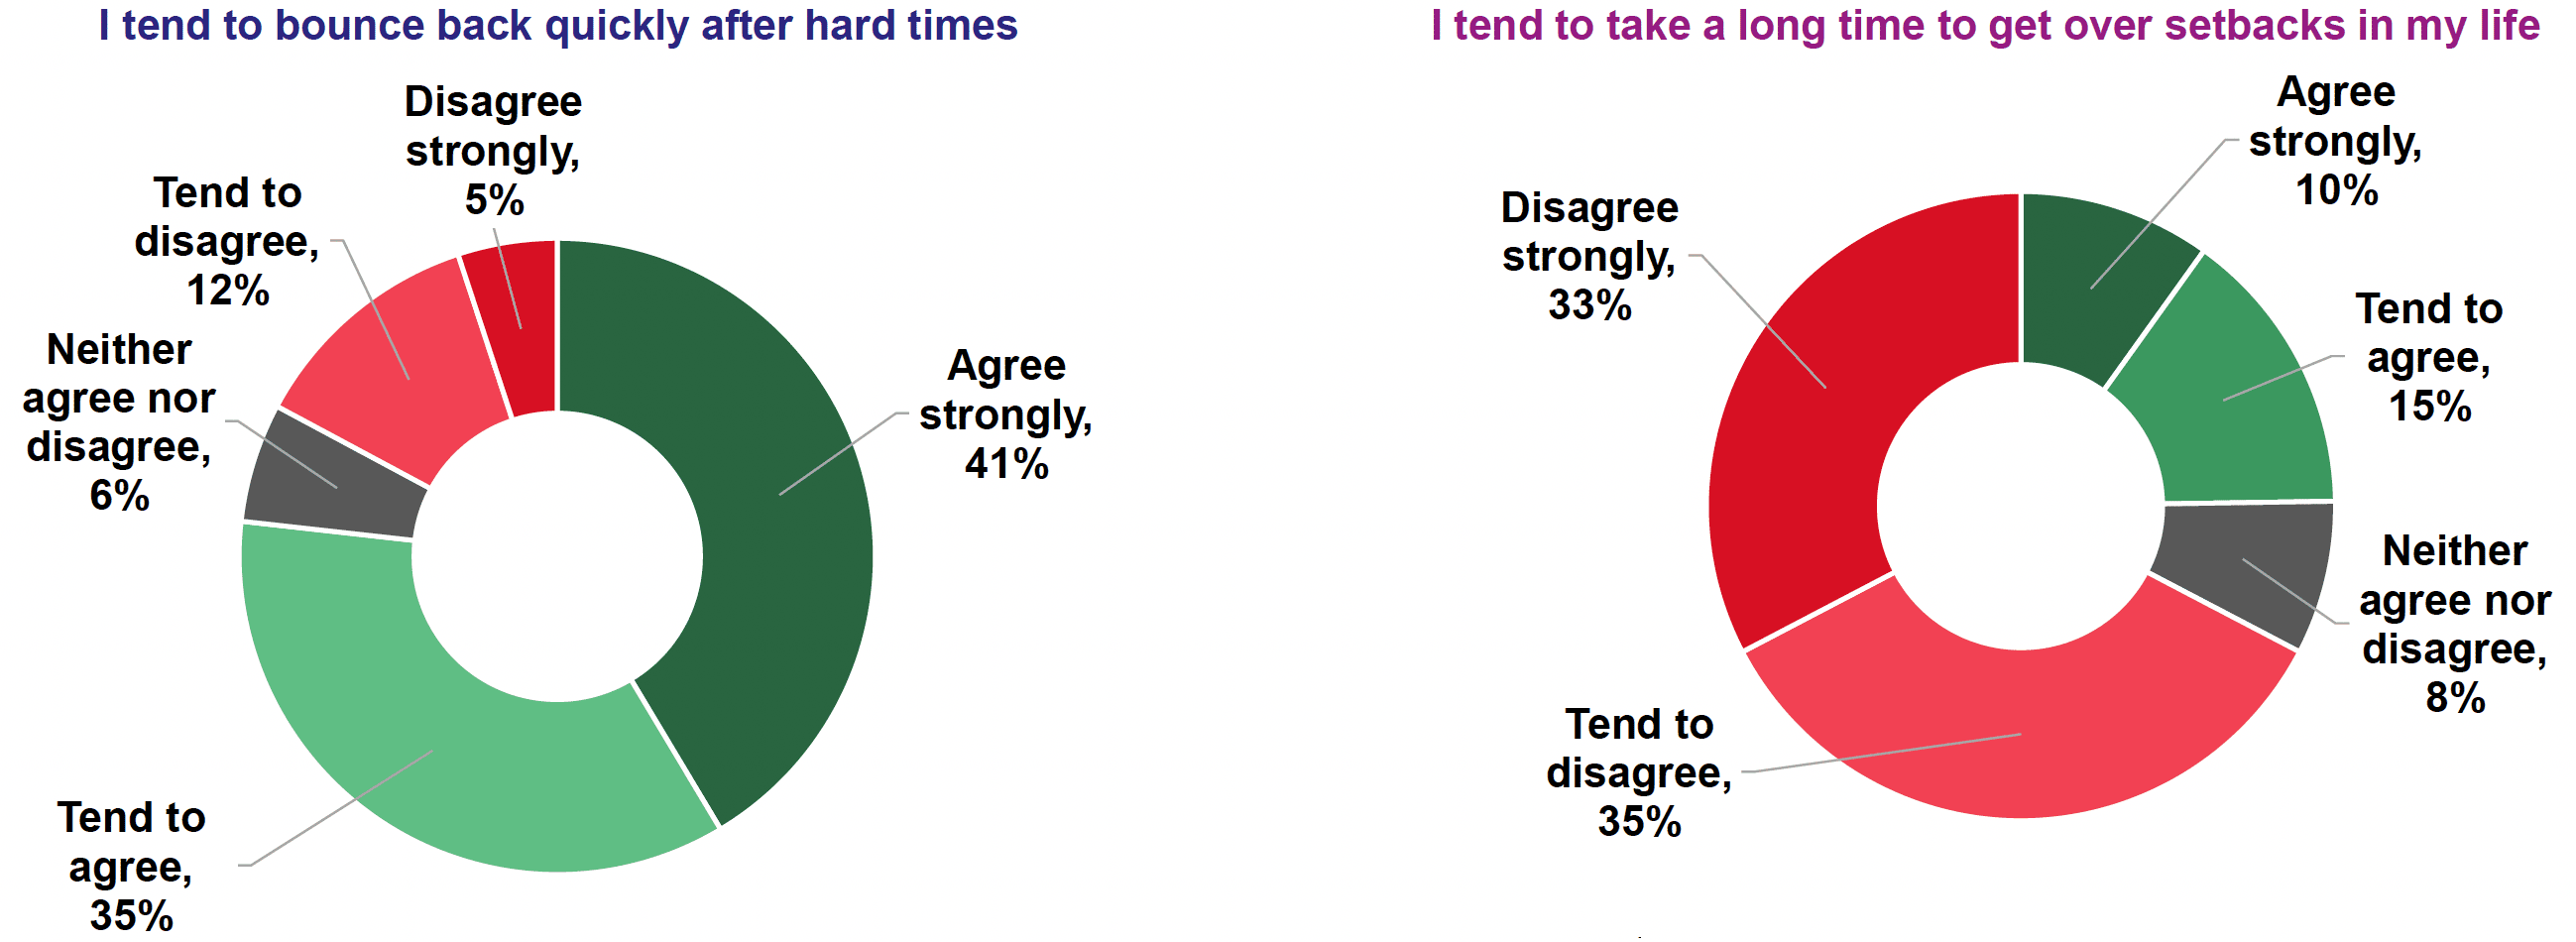
Base: 1,006 respondents age 16+ resident in Scotland; fieldwork = January 26 - February 11 2022
Lower resilience to adversity
- Disabled people were less likely to agree that they bounce back quickly from hard times (60%, compared with 82% of non-disabled people) and more likely to agree that they tend to take a long time to get over setbacks (41% vs 18% of those without).
- Women – 70% of women vs 83% of men agreed that they bounce back quickly from hard times.
- People on low incomes were more likely to agree they take a long time to get over setbacks (32%, vs 13% of those on the highest incomes).
vs.
Higher resilience to adversity
- People on the highest incomes are more likely to agree that they tend to bounce back quickly (89% of those on £52,000 or more, compared with 76% overall).
- Those from rural areas were more likely to agree that they bounce back quickly from hard times (84% vs 74% of those in urban areas).
- Those over the age of 70 were more likely to agree that they bounce back quickly from hard times (82% vs 76% overall) and disagree that they tend to take a long time to get over set backs in life (76% vs 68% overall).
Around half say they are watching TV or films, and following the news more often, compared with pre-pandemic
Q Compared before the Coronavirus outbreak started in the start of March 2020, are you doing the following things more, less, or the same amount these days?
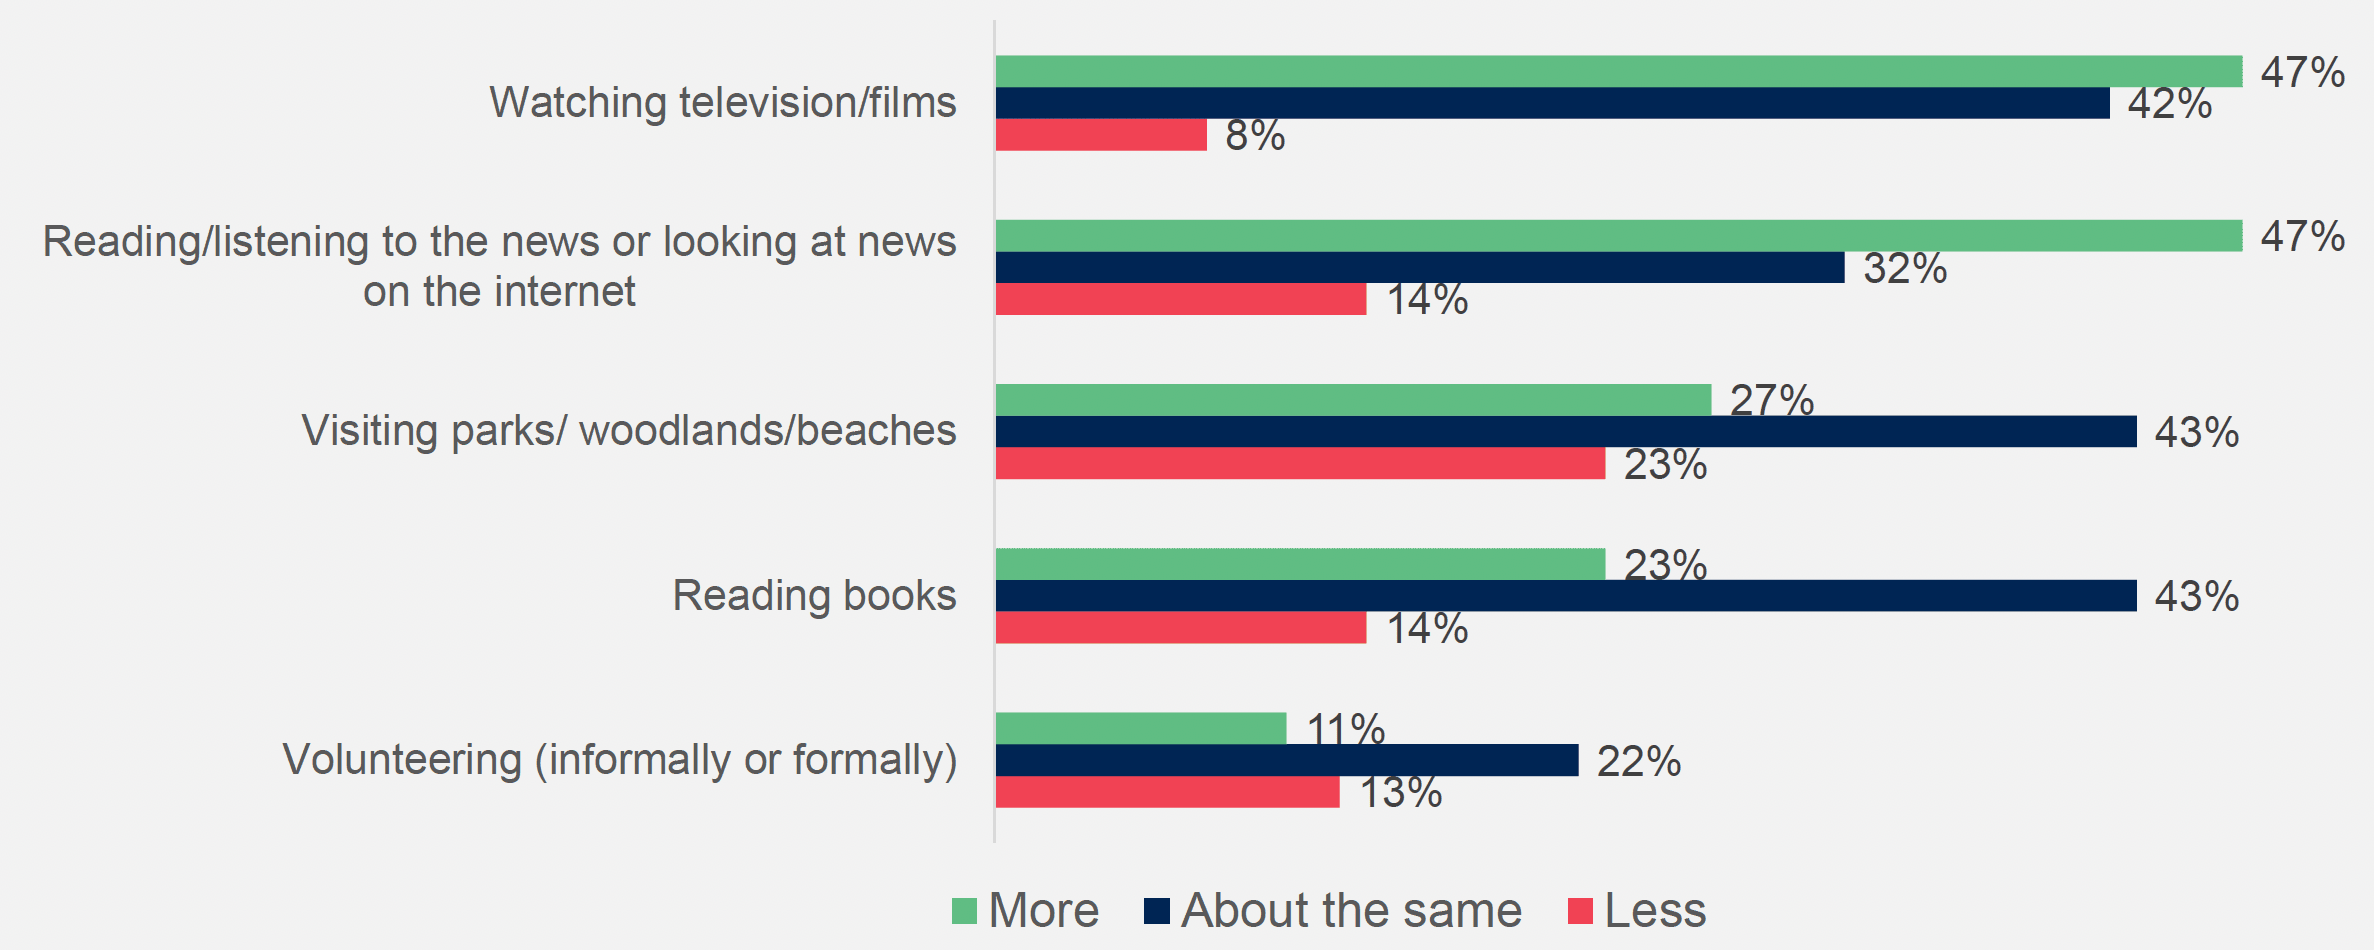
Base: 1,006 respondents age 16+ resident in Scotland; fieldwork = January 26 - February 11 2022. NB the % who said they 'did not do this anyway' are not shown.
Across a range of health-related behaviours (such as drinking or exercising), there is no clear pattern in terms of whether people are doing these more or less compared with pre-pandemic
Q Compared before the Coronavirus outbreak started in the start of March 2020, are you doing the following things more, less, or the same amount these days?
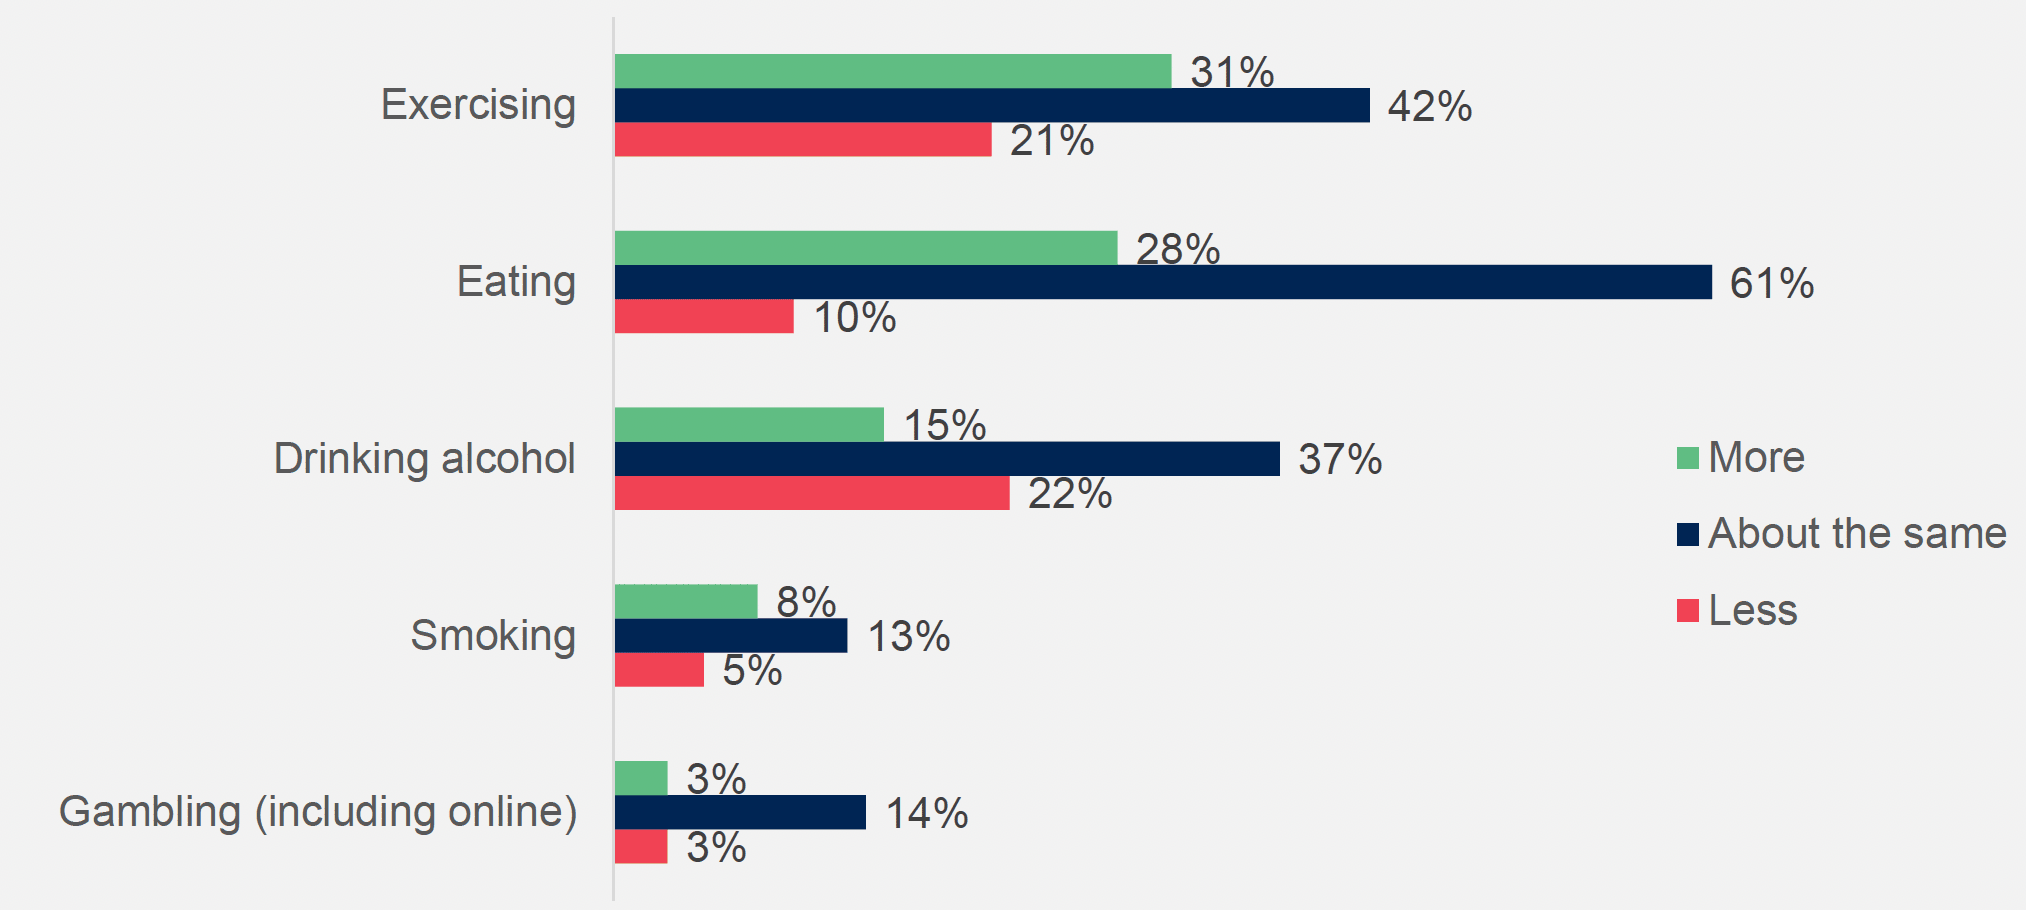
Base: 1,006 respondents age 16+ resident in Scotland; fieldwork = January 26 - February 11 2022. NB the % who said they 'did not do this anyway' are not shown.
The proportion reporting doing various things more often compared with pre-pandemic was very similar to December 2020
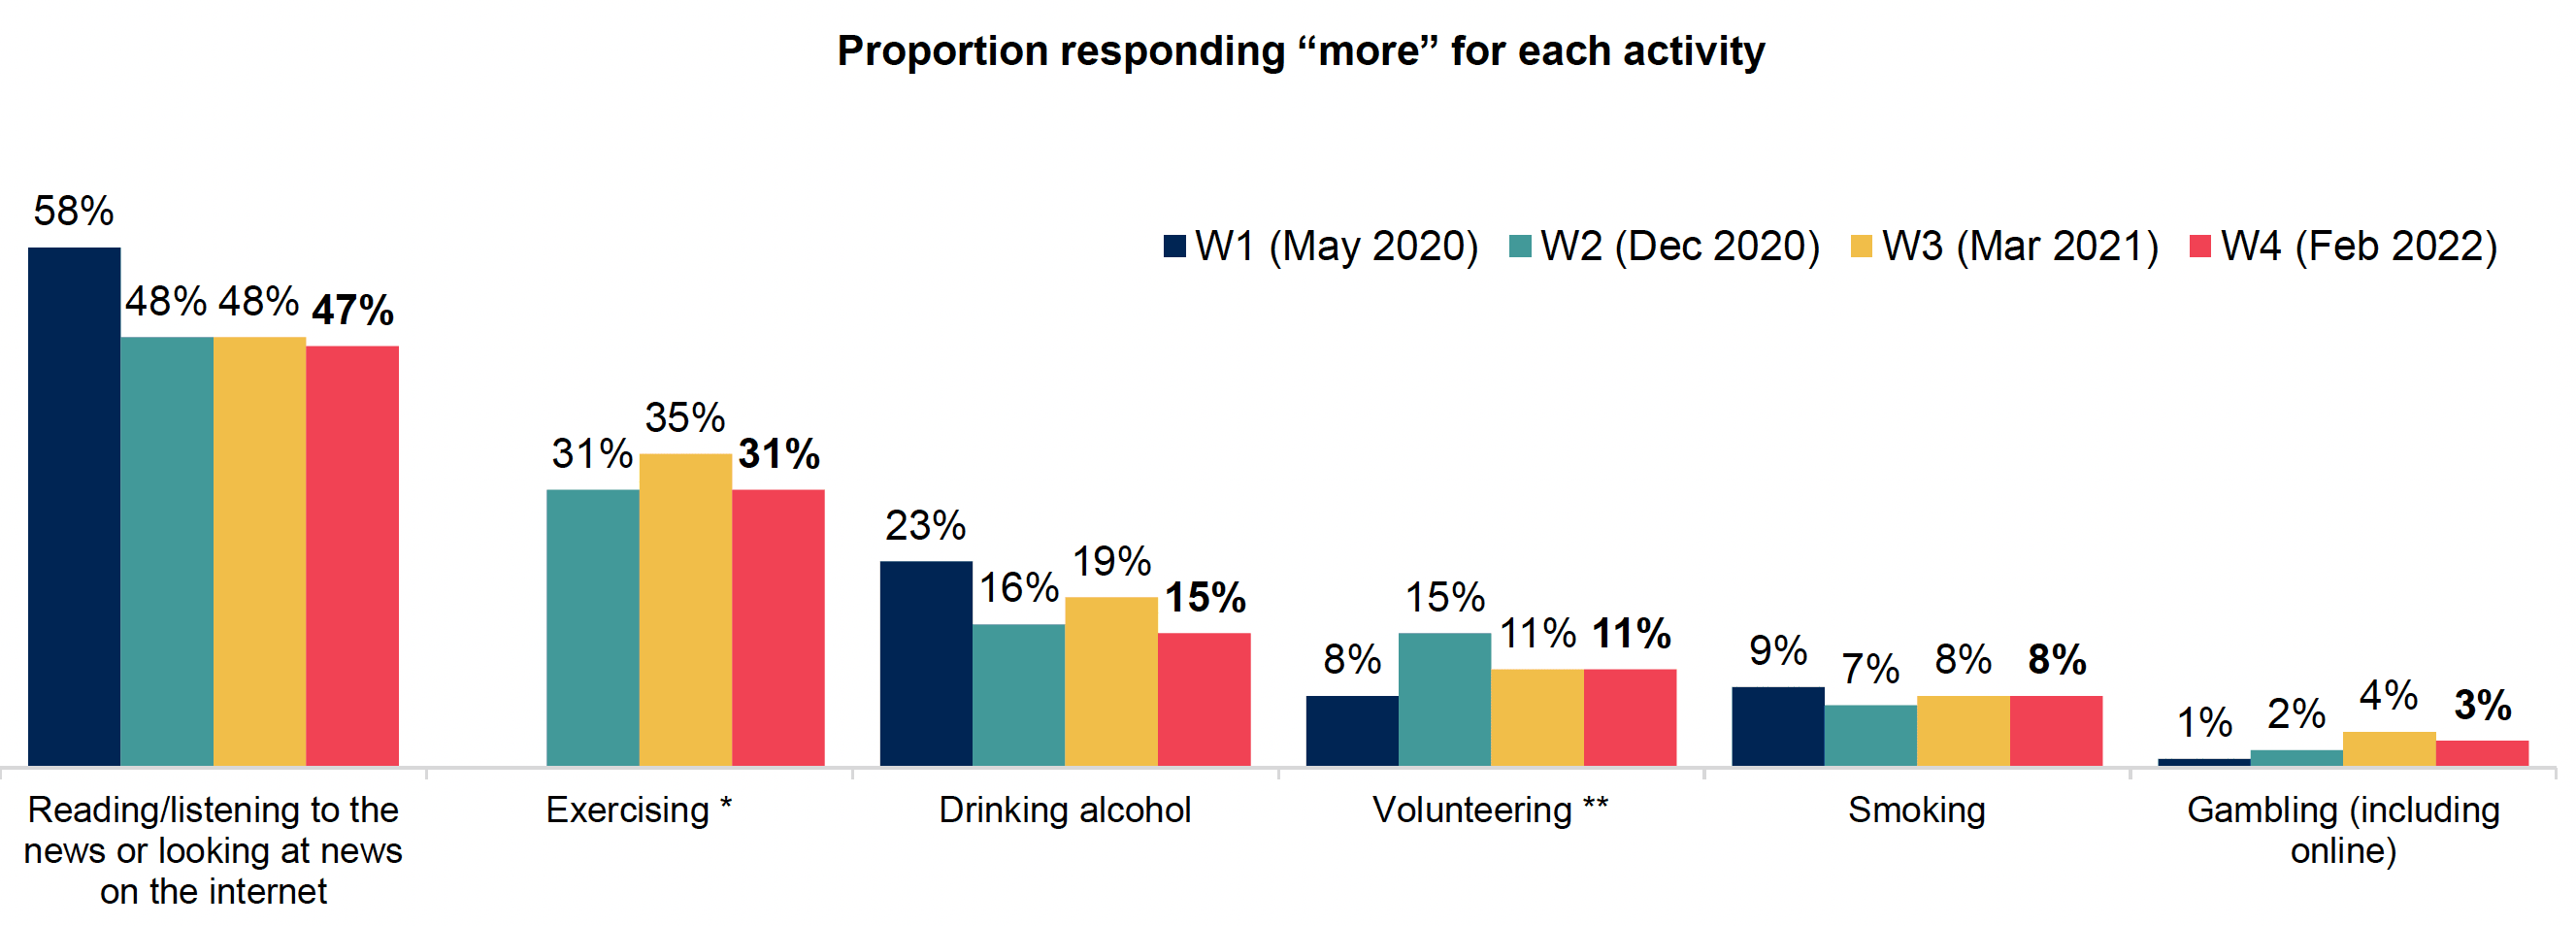
*not asked in Wave 1 ** NB in Wave 2, 'formally or informally' was added to 'volunteering'. This could partly explain the increase from wave 1 to wave 2 – people may be including a wider range of informal activities
Base: W1 (1,000), W2 (1,004), W3 (1,000), W4 (1,006)
Some groups were more likely to report changes in their behaviours
- Disabled people were more likely to say they were exercising less (29% vs 18% of non-disabled people), visiting parks/ woodlands/ beaches less (34% vs 18%), and smoking more (13% vs 6%) compared with pre-pandemic.
- Young people aged 16-24 were more likely to report cutting down on alcohol (31%, compared with 21-27% of those aged 25-69, and just 10% of those aged 70+) and exercising more (42%, compared with 35% of those aged 25-34, 31% of those aged 35-54, 27% of those aged 55-69, and 21% of those aged 70+).
- However, the youngest age group was also most likely to say they were smoking more (15% of 16-24 year-olds, compared with 13% of 25-34 year-olds, 8% of 35-54 year-olds, 3% of those aged 55-69, and 5% of those aged 70+).
Contact
Email: covid-19.behaviours@gov.scot