Housing Revenue Account (HRA) Statistics: Scottish Local Authority Housing Income and Expenditure 1997-98 to 2021-22 (actuals) 2022-23 (estimates)
An annual statistical publication which details Local Authority council housing income and expenditure including amount, type and balance at the end of the year.
6. Expenditure on housing management and on repairs and maintenance
(charts 5, 6, 7) (tables 10, 11, 12)
6.1 In 2021-22, the 26 Local Authorities with council dwellings spent, on average, £2,277 per house on management and maintenance, which is forecast to rise by 2.8% to £2,340 in 2022-23. As reported at earlier some councils reported that COVID-19 has affected repairs and maintenance.
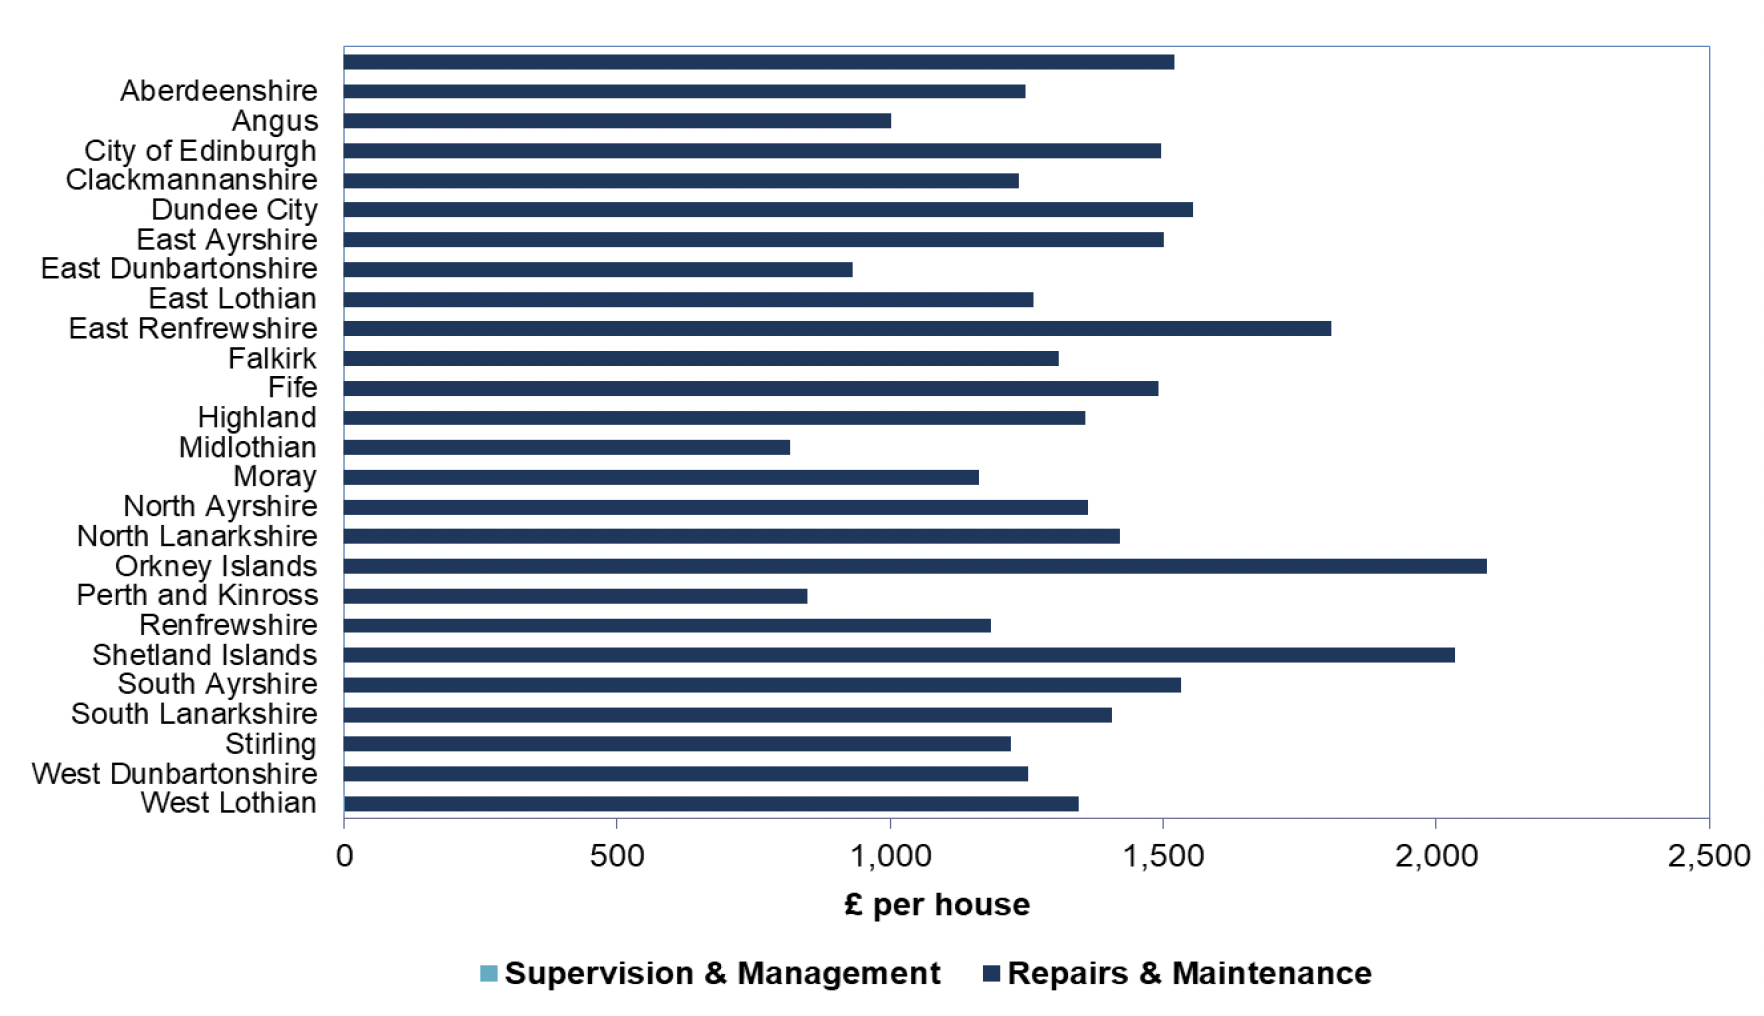
6.2Spending on management and maintenance for 2021-22 ranges from £1,695 per house in Midlothian to £3,162 in East Renfrewshire. Differing accounting practices and differing service provision amongst councils mean that the figures for individual councils may not always be directly comparable and the estimates for management and maintenance expenditure should be treated with caution.
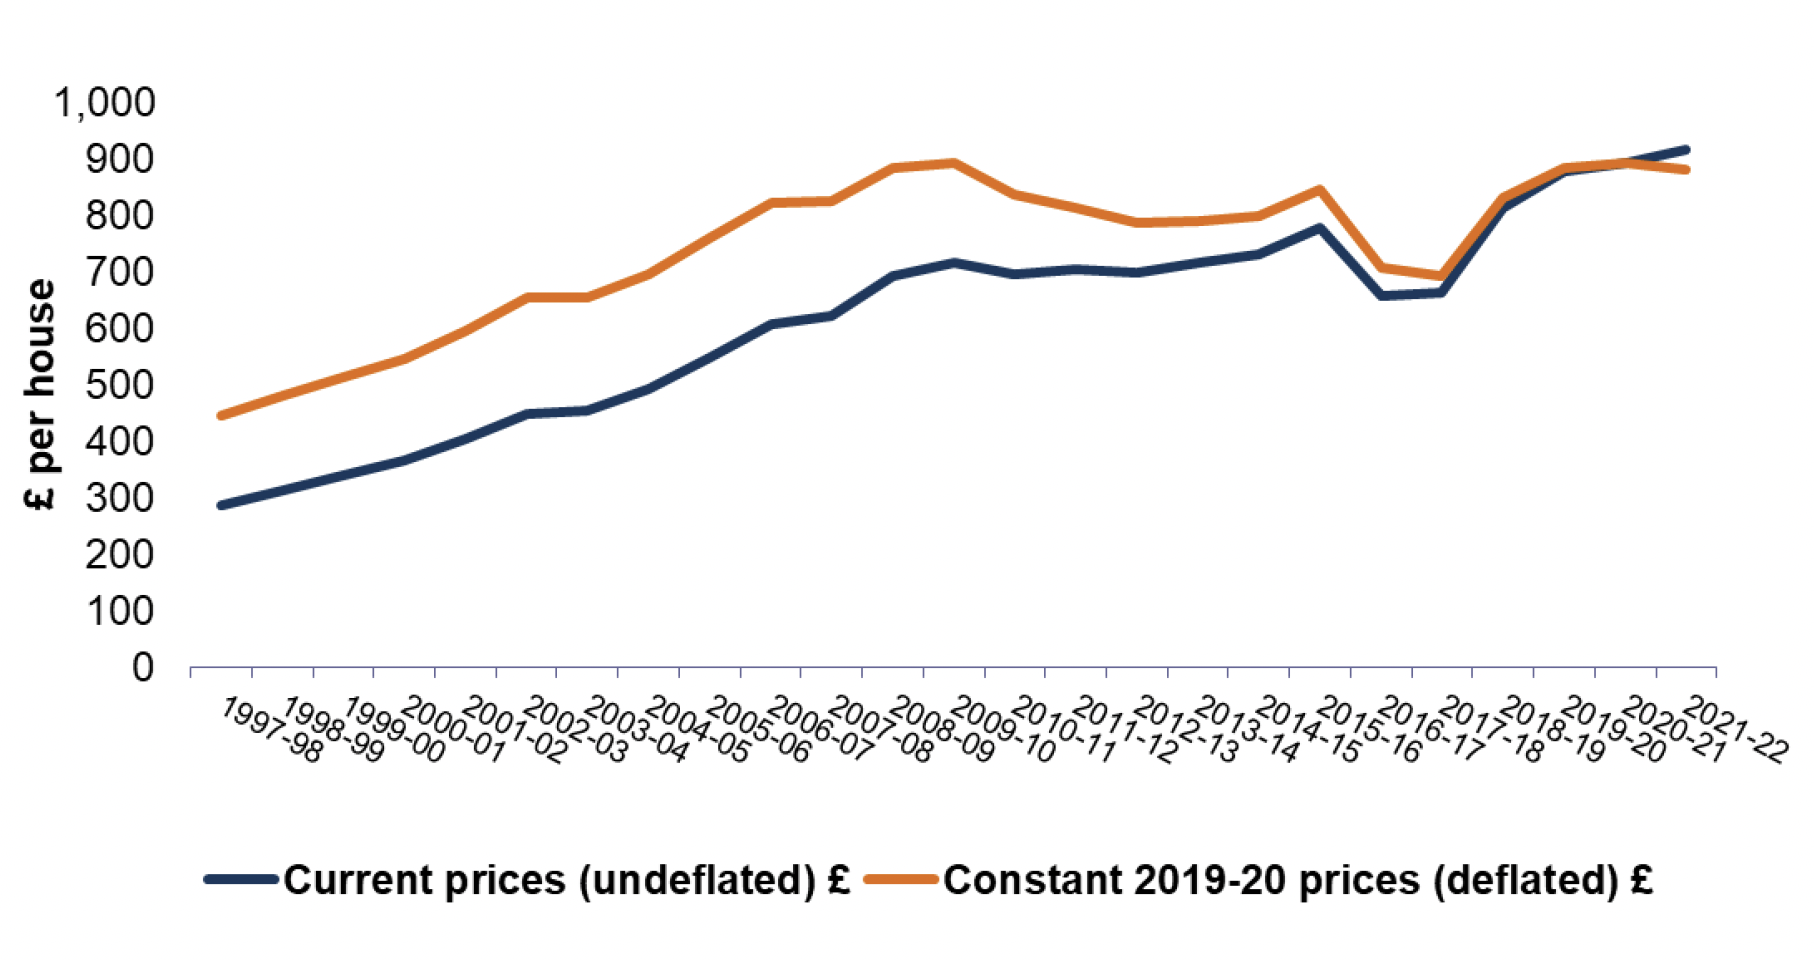
6.3 Supervision and management costs in 2021-22 were, on average, £915 per house and are forecast to increase to £997 per house in 2022-23. As Local Authorities differ in the extent to which central administration and related service costs are included, individual figures may not always be directly comparable.
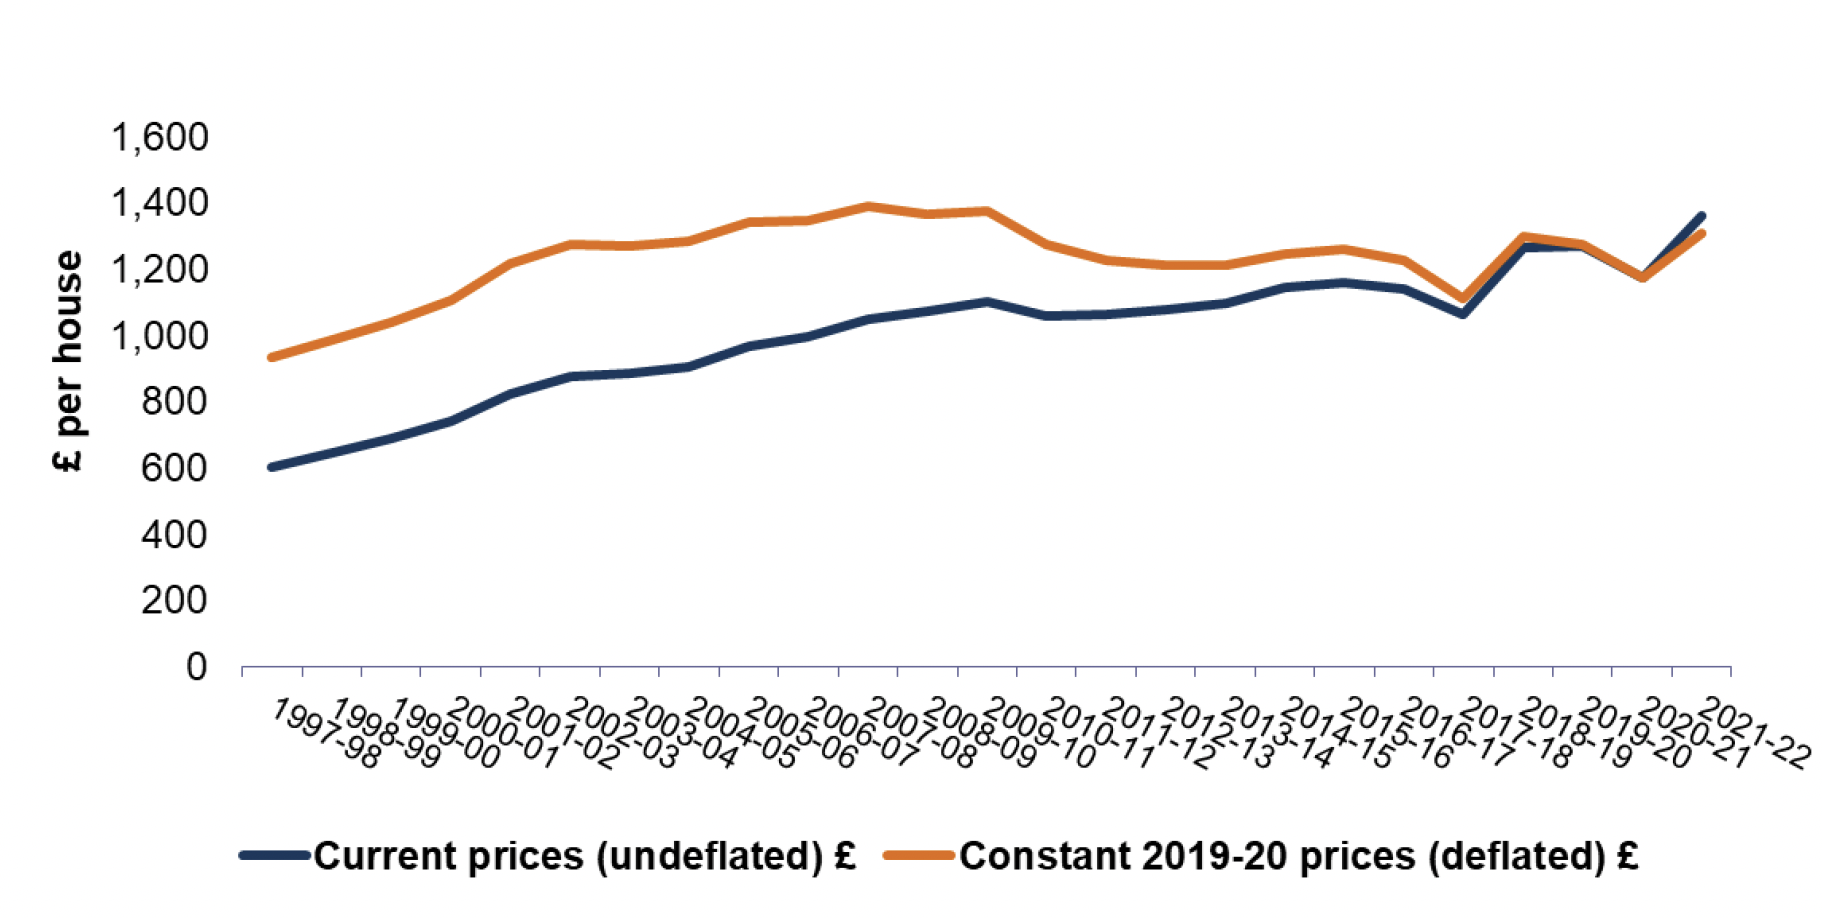
6.4 Average annual expenditure on repairs and maintenance was £1,362 per house in 2021-22 and is forecast to decrease to £1,343 or -1.3% per house in 2022-23. Spending on repairs and maintenance in 2021-22 ranges from £816 per house in Midlothian to
£2,092 per house in the Orkney Islands.
6.5 Please note that the HRA repairs and maintenance expenditure referred to in the above paragraphs is separate, and in additional to, the capital investment in council housing stock enhancements referred to elsewhere in this statistical publication.
Contact
Email: chma@gov.scot