Housing Revenue Account (HRA) Statistics: Scottish Local Authority Housing Income and Expenditure 1997-98 to 2021-22 (actuals) 2022-23 (estimates)
An annual statistical publication which details Local Authority council housing income and expenditure including amount, type and balance at the end of the year.
5. Rent levels and income from rents
(charts 3, 4) (tables 1a, 8, 9)
5.1 In 2021-22 of the 26 Local Authorities with their own housing stock raised a total of £1.24bn in income (net of losses from empty properties) from standard rents on dwellings and a further £27m in rent from other HRA properties such as garages.
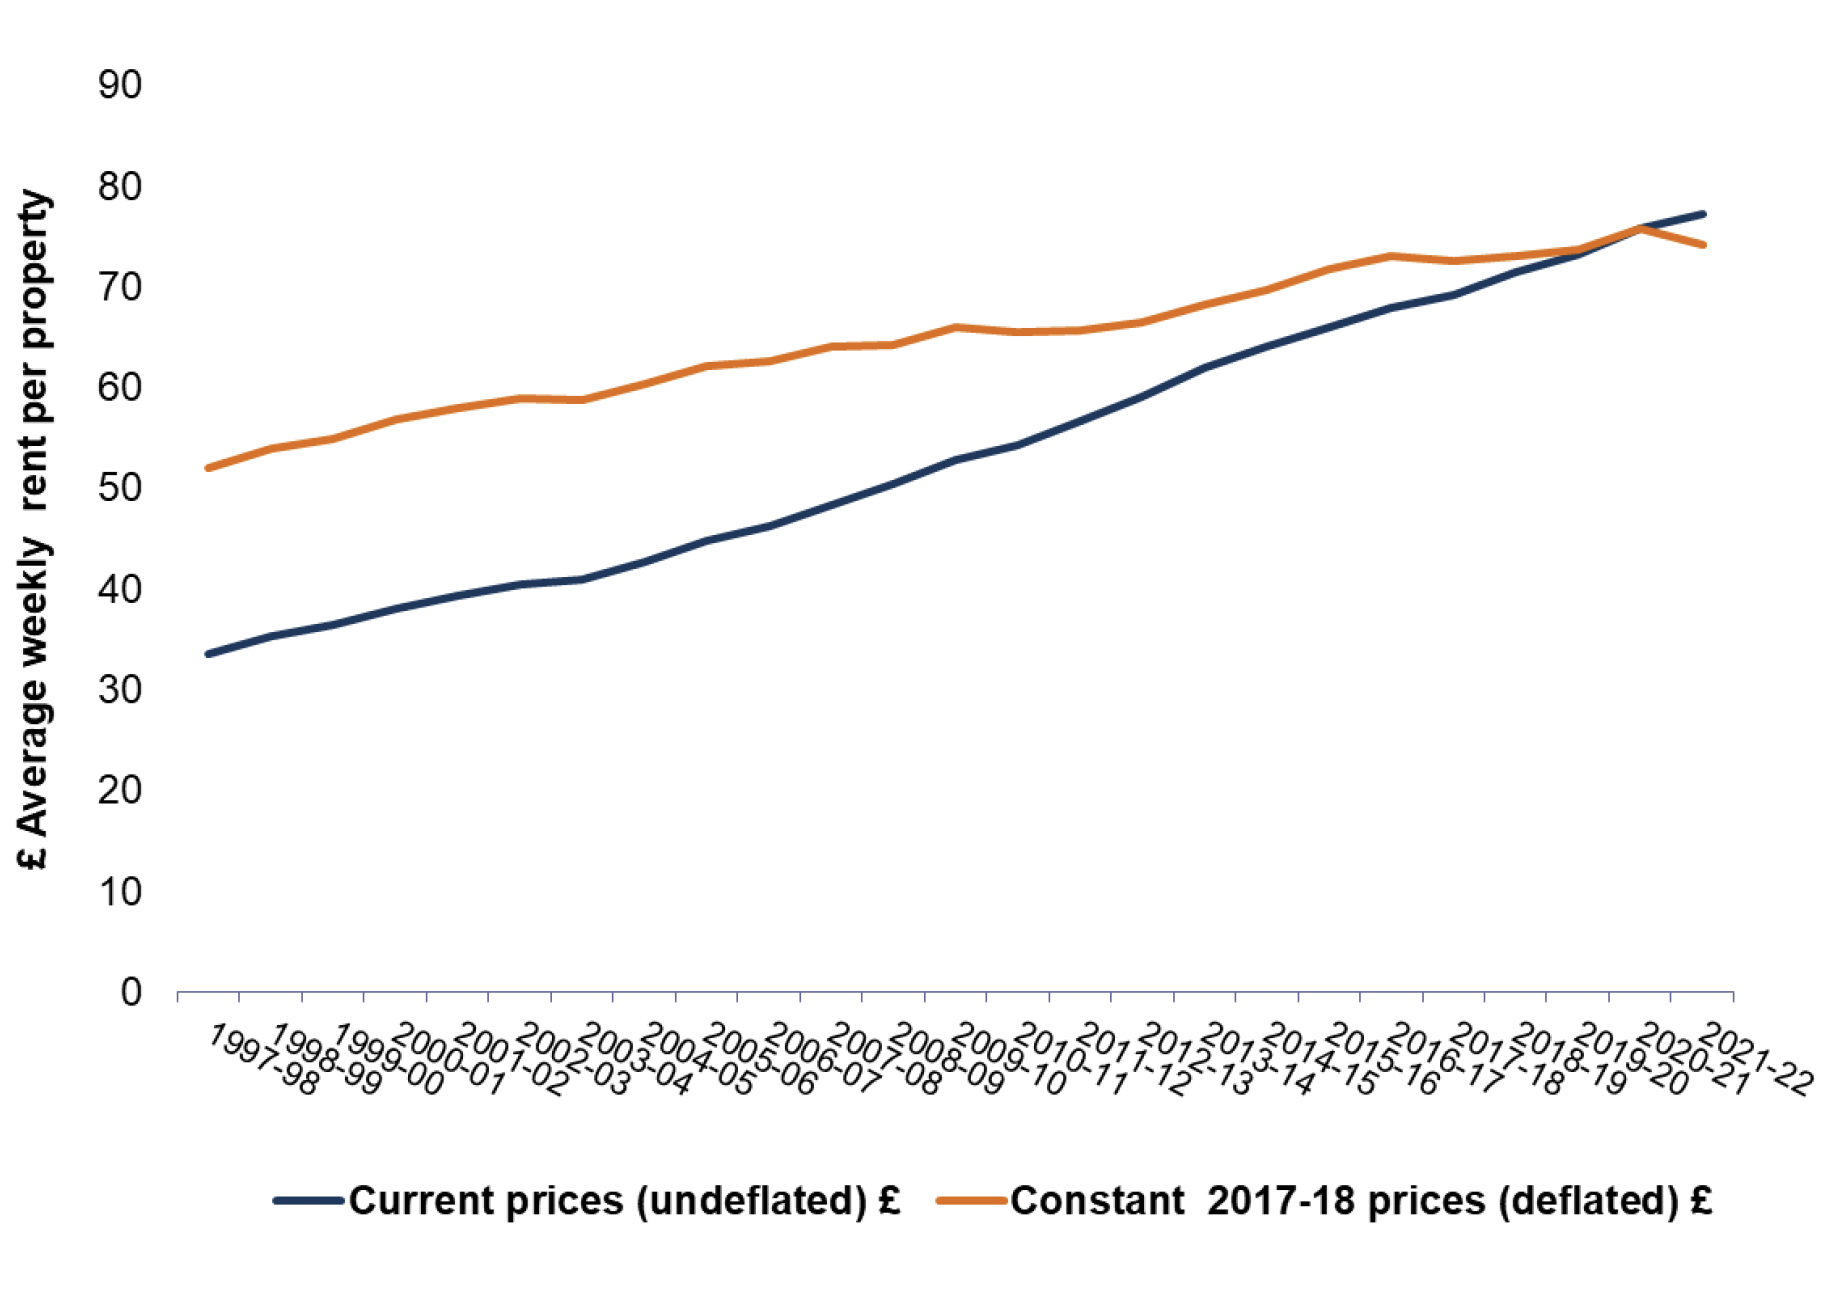
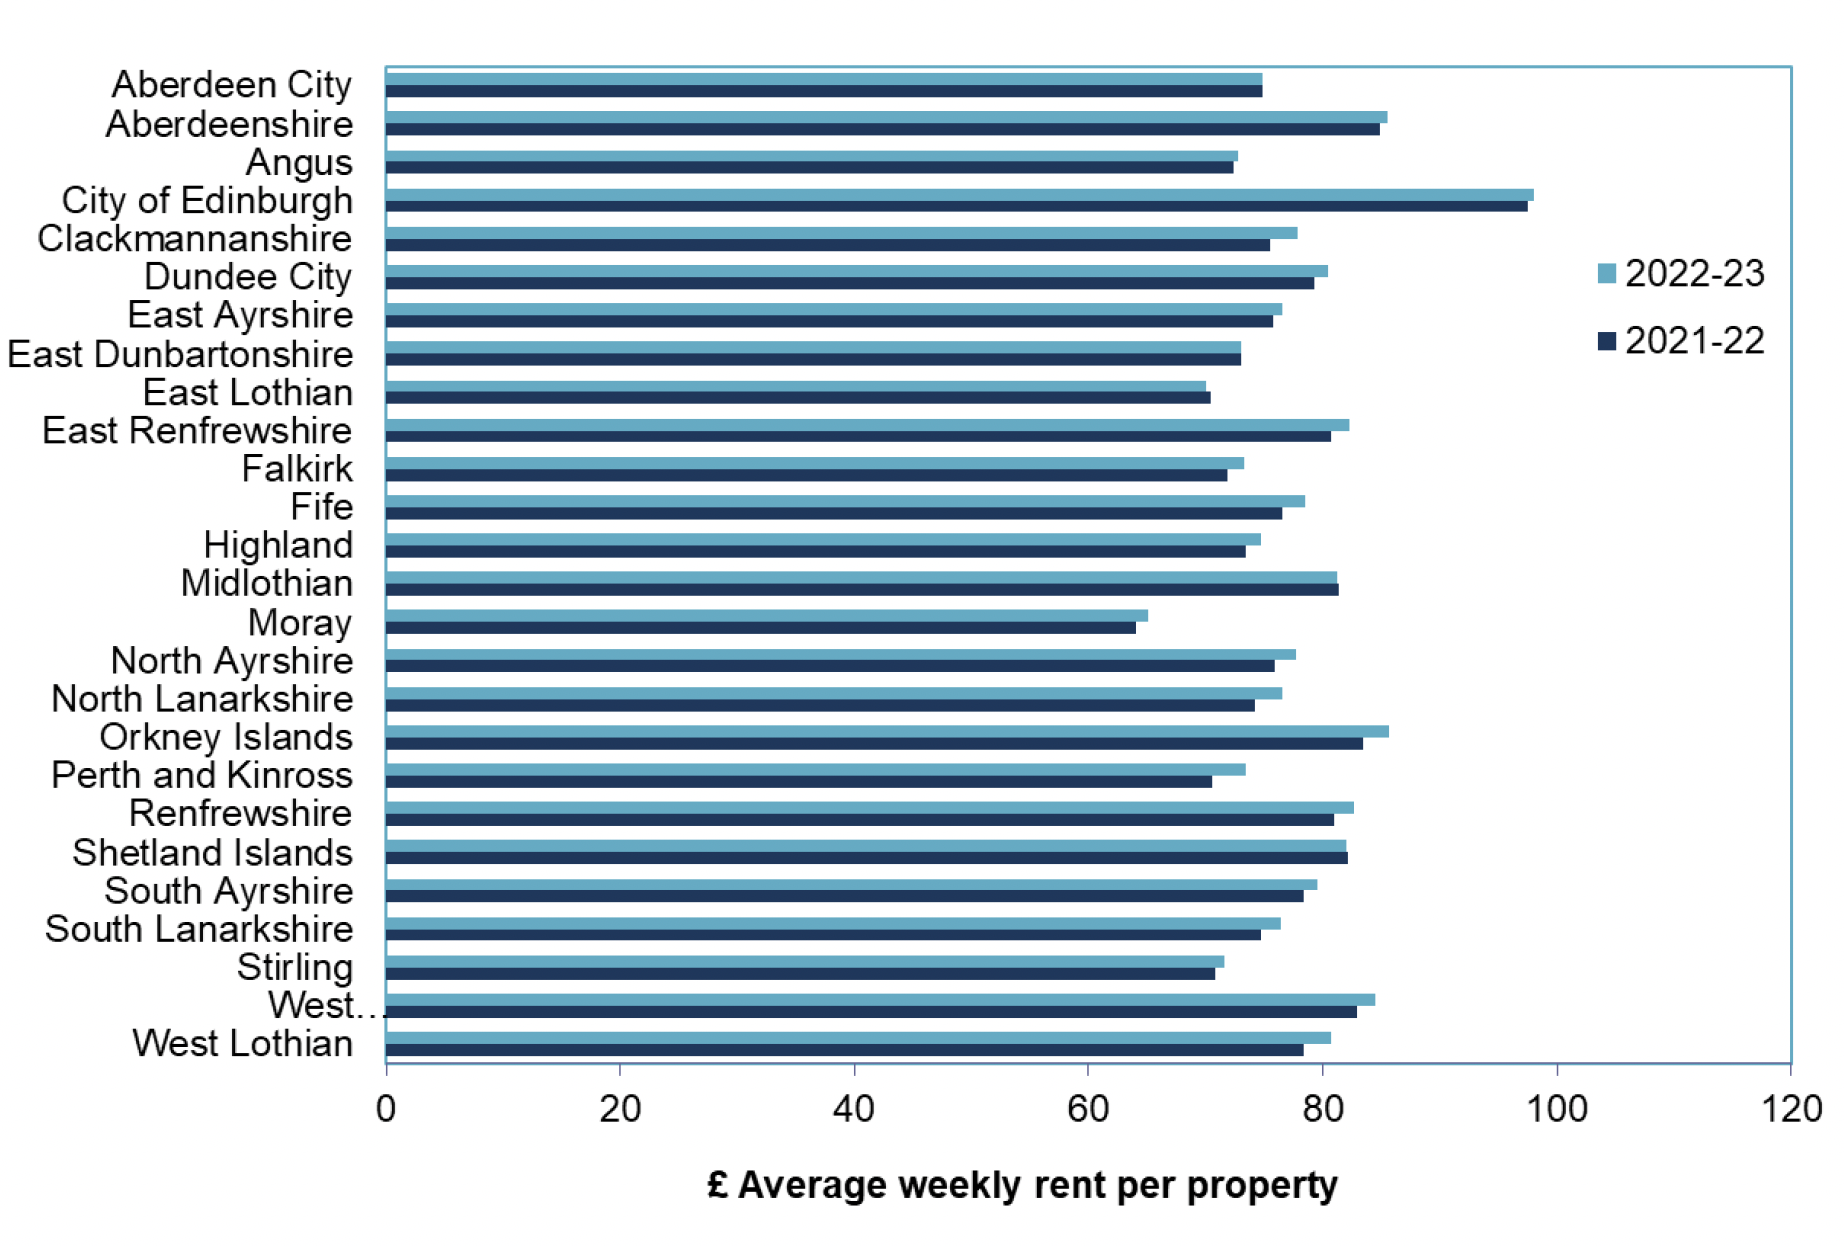
5.2 The average rent per dwelling (including both let and un-let properties) was £77.19 per week in 2021-22an increase of £1.40 since 2020-21. In the decade since 2012-13 average rents have increased by just under £8 or 12% in real terms i.e. over and above general inflation. In 2021-22 there is variation between councils in average rents, from £64.08 per week in Moray to £97.46 per week in the City of Edinburgh. As this rent data includes un-let house the actual amount of rent paid by tenants is likely to be slightly higher.
5.3 These figures may be lower than rents reported in other publications, for example, the rent figures produced by the Scottish Housing Regulator as rather than taking a weighted average of set rents charged to tenants, they instead reflect the amount earned by the council in respect of each property owned (calculated by dividing the Council's Standard Rental Income on houses by the total letting stock). This method takes into account the proportion of housing which spends some time un-let and those for which rent is not successfully collected.
5.4 Housing benefits accounted for a high proportion of council rental income. In 2021-22, rent rebate subsidy for council house tenants was £451m, representing 36% of total income from standard rents. In 2021-22, rent rebate subsidy as a proportion of standard rents varied from 25% in East Lothian to 64% in South Ayrshire.
Contact
Email: chma@gov.scot