
Government expenditure & revenue Scotland 2025-26
Government Expenditure and Revenue Scotland (GERS) is an Accredited Official Statistics publication. It estimates the revenue raised in Scotland and the cost of public services provided for Scotland.
Part of
3. Public Sector Expenditure
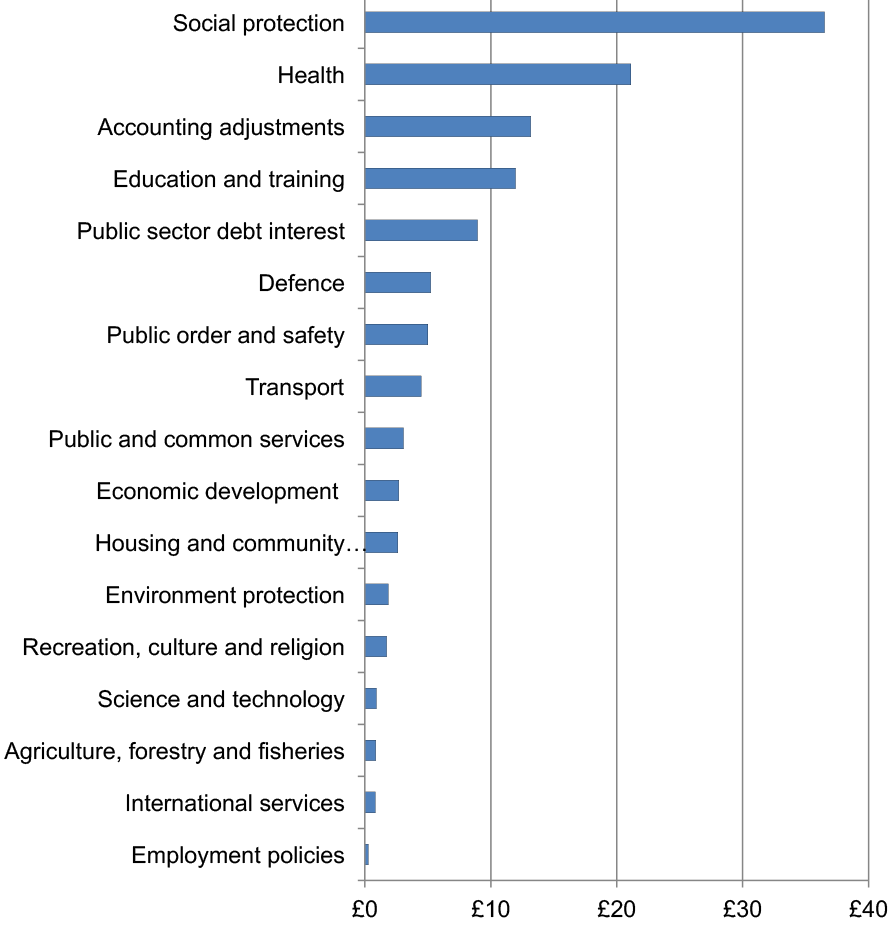
Chart 3.1 Social protection is the largest element of spend accounting for around 30 per cent of total spend
Total Public Sector Expenditure Scotland 2025-26
£ billion
Introduction
This chapter provides detailed estimates of public sector expenditure for Scotland. Expenditure is shown by type of spend, using a presentation based on the UN’s Classification of the Functions of Government (COFOG) e.g. health, education. Further information is provided in the Glossary. Current (day to day running costs) and capital expenditure (money spent on buildings or investments) are shown separately.
The primary data sources used to estimate Scottish public sector expenditure are explained on page 11.
Expenditure
Expenditure increased to £123.6 billion in 2025-26, from £117.9 billion in 2024-25. Overall, spending in 2025-26 grew slightly faster than the economy. Spending as a share of GDP increased to 53.1 per cent.
Public spending remains historically high, as a percentage of GDP, almost 9 percentage points higher than pre-pandemic.
|
Statistic |
2024-25 |
2025-26 |
Annual change |
|---|---|---|---|
|
Scotland (£ million) |
117,887 |
123,566 |
4.8% |
|
Scotland (% of UK Expenditure) |
9.1% |
9.1% |
0.0 p.p |
|
Scotland (% of GDP) |
52.1% |
53.1% |
1.0 p.p |
|
Scotland - excluding North Sea (% of GDP) |
55.6% |
55.9% |
0.3 p.p |
|
UK (% of UK GDP) |
44.0% |
44.3% |
0.3 p.p |
p.p – percentage point
The table above shows estimates of Scottish and UK public sector expenditure as a share of GDP. This provides an illustration of the relative size of public spending between countries and over time. (It is not an estimate of the contribution of public spending to the economy).
Excluding North Sea GDP, public sector spending as a share of GDP has remained broadly unchanged at 55.9% in 2025-26, it remains almost 8.0 percentage points higher than before the pandemic.
Expenditure per person
Expenditure for Scotland per person is higher than the UK average over the period.
The relative gap between Scottish and UK spending per person increased in 2025-26, with spend per person £2,720 (13.9%) higher in Scotland than the UK.
|
Statistic |
2024-25 |
2025-26 |
Annual change |
|---|---|---|---|
|
Scotland |
21,265 |
22,281 |
4.8% |
|
UK |
18,605 |
19,561 |
5.1% |
|
Difference Scotland minus UK |
2,659 |
2,720 |
2.3% |
As noted previously, water and sewerage services are provided by the public sector in Scotland, but by the private sector in England and Wales, leading to relatively higher spending in Scotland. This explains slightly less than one percentage point of the difference in spend.
Public sector expenditure by category
Spend, for Scotland, has increased by 4.8 per cent from 2025-26.
Social protection the largest element of spend, accounted for almost 30 per cent of total spend and increased by the greatest amount (+£2.1 billion).
This spend is discussed in more detail below.
Health accounts for just over 17 per cent of overall spending, with the second largest increase in spend (+1.5 billion)
Although spending increased in most areas. There were some areas with comparatively small annual decreases in level of spend, for example Education and training and Housing and Community amenities. Table 3.3 shows a breakdown of spending by category.
|
Expenditure |
£ million |
% of total expenditure |
|---|---|---|
|
Public and common services |
3,075 |
2.5% |
|
International services |
827 |
0.7% |
|
Reserved public sector debt interest |
8,868 |
7.2% |
|
Local government pension fund interest expenditure |
2,387 |
1.9% |
|
Defence |
5,234 |
4.2% |
|
Public order and safety |
5,003 |
4.0% |
|
Enterprise and economic development |
2,700 |
2.2% |
|
Science and technology |
922 |
0.7% |
|
Employment policies |
277 |
0.2% |
|
Agriculture, forestry and fisheries |
858 |
0.7% |
|
Transport |
4,471 |
3.6% |
|
Environment protection |
1,866 |
1.5% |
|
Housing and community amenities |
2,616 |
2.1% |
|
Health |
21,120 |
17.1% |
|
Recreation, culture and religion |
1,726 |
1.4% |
|
Education and training |
11,976 |
9.7% |
|
Social protection |
36,502 |
29.5% |
|
EU transactions |
-38 |
0.0% |
|
Accounting adjustments |
13,175 |
10.7% |
|
Total Expenditure |
123,566 |
100.% |
|
Expenditure Type |
2023-24 |
2024-25 |
2025-26 |
|---|---|---|---|
|
Current |
89.0% |
87.6% |
88.2% |
|
Capital |
11.0% |
12.4% |
11.8% |
Spending by different parts of the Public Sector
Table 3.5 below provides a breakdown of devolved expenditure by the Scottish Government, Scottish local government and public corporations (devolved), and reserved expenditure by other UK government bodies.
|
Function |
Devolved 2023-24 |
Devolved 2024-25 |
Devolved 2025-26 |
Reserved 2023-24 |
Reserved 2024-25 |
Reserved 2025-26 |
Total 2023-24 |
Total 2024-25 |
Total 2025-26 |
|---|---|---|---|---|---|---|---|---|---|
|
Public and common services |
2,073 |
2,029 |
1,951 |
1,314 |
1,004 |
1,125 |
3,387 |
3,034 |
3,075 |
|
International services |
1 |
0 |
0 |
845 |
836 |
827 |
846 |
836 |
827 |
|
Public sector interest expenditure |
2,229 |
2,304 |
2,387 |
8,768 |
8,625 |
8,868 |
10,997 |
10,929 |
11,255 |
|
Defence |
4 |
4 |
5 |
4,561 |
5,091 |
5,229 |
4,565 |
5,095 |
5,234 |
|
Public order and safety |
3,526 |
3,835 |
4,423 |
576 |
535 |
579 |
4,102 |
4,370 |
5,003 |
|
Enterprise and economic development |
1,189 |
1,221 |
1,132 |
1,590 |
1,291 |
1,569 |
2,779 |
2,512 |
2,700 |
|
Science and technology |
3 |
2 |
3 |
827 |
792 |
919 |
829 |
794 |
922 |
|
Employment policies |
0 |
0 |
0 |
370 |
300 |
277 |
370 |
300 |
277 |
|
Agriculture, forestry and fisheries |
819 |
805 |
802 |
38 |
52 |
56 |
857 |
856 |
858 |
|
Transport |
2,941 |
3,267 |
3,233 |
1,195 |
1,243 |
1,238 |
4,136 |
4,510 |
4,471 |
|
Environment protection |
1,184 |
1,355 |
1,355 |
337 |
397 |
511 |
1,521 |
1,753 |
1,866 |
|
Housing and community amenities |
2,664 |
2,768 |
2,592 |
19 |
33 |
24 |
2,683 |
2,802 |
2,616 |
|
Health |
17,917 |
19,483 |
20,936 |
293 |
164 |
185 |
18,210 |
19,647 |
21,120 |
|
Recreation, culture and religion |
1,150 |
1,174 |
1,160 |
418 |
462 |
566 |
1,568 |
1,636 |
1,726 |
|
Education and training |
11,350 |
12,163 |
11,955 |
19 |
22 |
21 |
11,369 |
12,185 |
11,976 |
|
Social protection |
11,569 |
12,488 |
12,823 |
20,844 |
21,886 |
23,679 |
32,413 |
34,374 |
36,502 |
|
EU Transactions |
0 |
0 |
0 |
66 |
-92 |
-38 |
66 |
-92 |
-38 |
|
Accounting adjustments |
9,322 |
9,818 |
10,351 |
2,319 |
2,529 |
2,824 |
11,641 |
12,347 |
13,175 |
|
Total |
67,942 |
72,718 |
75,108 |
44,398 |
45,170 |
48,458 |
112,340 |
117,887 |
123,566 |
|
Expenditure |
£ million |
% of total expenditure |
|---|---|---|
|
Public and common services |
24,870 |
1.8% |
|
International services |
10,331 |
0.8% |
|
Reserved public sector debt interest |
130,305 |
9.6% |
|
Defence |
65,418 |
4.8% |
|
Public order and safety |
55,719 |
4.1% |
|
Enterprise and economic development |
23,481 |
1.7% |
|
Science and technology |
11,268 |
0.8% |
|
Employment policies |
3,689 |
0.3% |
|
Agriculture, forestry and fisheries |
6,598 |
0.5% |
|
Transport |
48,923 |
3.6% |
|
Environment protection |
19,157 |
1.4% |
|
Housing and community amenities |
22,465 |
1.7% |
|
Health |
257,542 |
18.9% |
|
Recreation, culture and religion |
15,054 |
1.1% |
|
Education and training |
125,719 |
9.2% |
|
Social protection |
407,270 |
29.9% |
|
EU transactions |
-166 |
0.0% |
|
Accounting adjustments |
132,480 |
9.7% |
|
Total Expenditure |
1,360,122 |
100.0% |
Social protection spending in Scotland
Social protection spending is the largest single spending category and covers a range of different spend types.
The largest spending elements in Scotland within social protection are:
- state pension by the Department for Work and Pensions (DWP). Followed by
- DWP’s spending on other social security such as universal credit disability and incapacity related benefits, and housing benefit.
- Tax credits and child benefit are part of HMRC spending.
Scottish Government social security spend includes local authority administered spend including:
- the Scottish Welfare Fund,
- Council Tax Reduction Scheme, and
- Discretionary Housing Payments
It also includes Social security spend, from 2019 as set out in Chapter 4.
The Scottish Fiscal Commission has highlighted that spending on devolved social security in Scotland is growing faster than its equivalent in the UK, reflecting a range of factors including the introduction of new benefits and greater take up of devolved benefits as they replace those previously available. Scottish Government spending on social security (a subset of social protection devolved to the Scottish Government) grew by 11% in 2025-26, faster than overall social protection spend (6%).
Some UK social security expenditure, mostly associated with the state pension, is paid to non-UK residents. Scotland is allocated a population share of this spend.
|
Social protection spend |
2023-24 |
2024-25 |
2025-26 |
|---|---|---|---|
|
State pension |
10,543 |
11,731 |
12516 |
|
Housing benefit |
1,237 |
1,235 |
1,019 |
|
Universal credit |
3,903 |
4,971 |
6,537 |
|
Other DWP social security |
2,774 |
2,400 |
1,722 |
|
HMRC child benefit and tax credits |
1,423 |
1,082 |
961 |
|
Scottish Government social security |
5,422 |
6,038 |
6,709 |
|
Total Social security spending in Scotland |
25,302 |
27,458 |
29,465 |
|
Share of benefit spending outside UK |
429 |
463 |
462 |
|
Share of corporate spend |
102 |
124 |
150 |
|
Other social protection: Net public sector pensions |
129 |
-39 |
-299 |
|
Other social protection: Social care for the elderly |
3,429 |
3,710 |
4,014 |
|
Other social protection: Other |
3,021 |
2,659 |
2,711 |
|
Total social protection |
32,413 |
34,374 |
36,502 |
Source: HMT CRA (2024-25), Latest year are estimates, Table 3.3, 4.3 & 4.4.
Other social protection spending consists primarily of Local Authority expenditure on social care to families and children.
A more detailed breakdown of social security spending is published by DWP, available at the link below.
Benefit expenditure and caseload tables - GOV.UK (www.gov.uk)
Accounting adjustments
GERS expenditure figures are presented on a National Accounts basis, an international reporting standard used by governments to ensure international comparability.
This requires a number of adjustments to be included in total expenditure. These are primarily symmetric adjustments that also form part of revenue, and therefore have little impact on the net fiscal balance. Further information is set out in the online tables .
Contact
Email: economic.statistics@gov.scot