
Government expenditure & revenue Scotland 2025-26
Government Expenditure and Revenue Scotland (GERS) is an Accredited Official Statistics publication. It estimates the revenue raised in Scotland and the cost of public services provided for Scotland.
Part of
1. Public Sector Revenue
Chart 1.1: The three largest taxes with the largest revenue are, income tax, value added tax and national insurance contributions. North Sea revenue forms an important part of corporation tax for Scotland
Total Public Sector Revenue Scotland 2025-26
(£ billion)
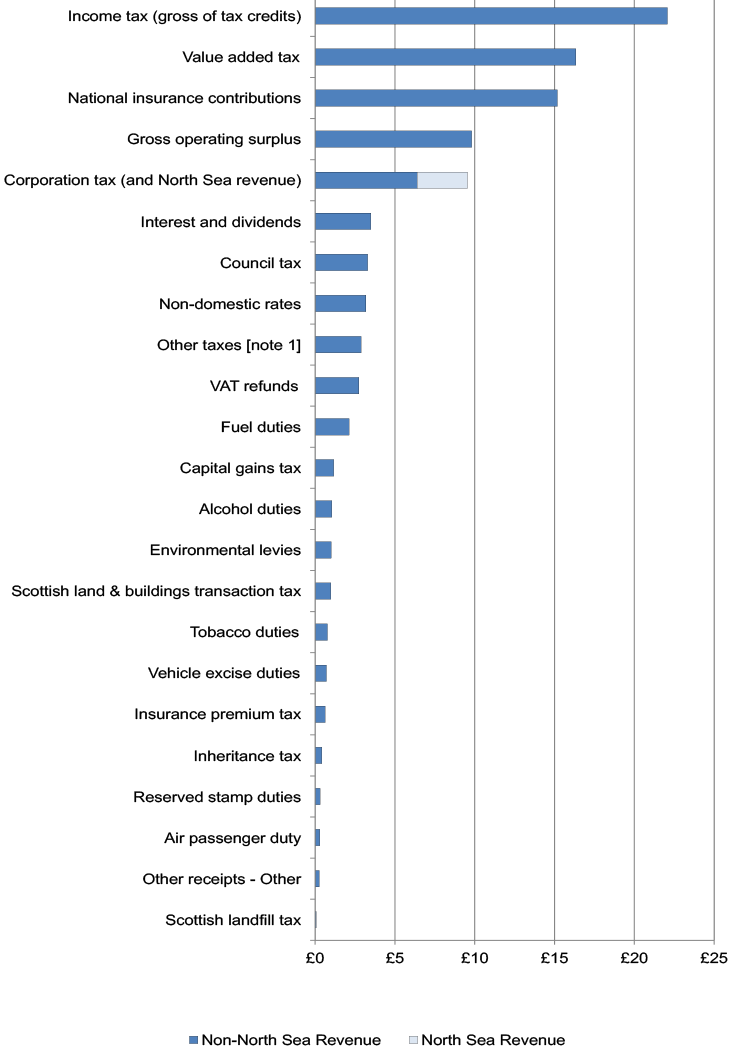
Note: Chapter 4 provides more information on current and future devolved taxes. Note that the income tax figures in this chapter cover all income tax, whilst those in Chapter 4 cover only non-savings and non-dividend income tax.
Introduction
This chapter provides detailed estimates of revenue raised from people and businesses in Scotland, based on UK public sector finance definitions.
Tax and non-tax revenue are reported separately. Non-tax revenues are primarily:
- non-cash items such as capital consumption, included for accounting purposes in gross operating surplus, and
- the operating surplus of public corporations such as Scottish Water.
Most public sector revenue from Scotland is collected at the UK level and it is not possible to identify separately the proportion of revenue receivable from Scotland. GERS allocates revenue to Scotland on a who pays basis. See the methodology publication for further details.
Since devolution and following the implementation of the Scotland Act 2012 and 2016, a number of taxes are devolved to the Scottish Parliament and Scottish values are available for these revenues. To date these include Council tax, Non-domestic rates, land and building transaction tax, landfill tax, and non-savings non-dividend income tax.
Total revenue
Revenues raised in Scotland in 2025-26 totalled £98.3 billion, an increase of £6.3 billion, 6.9 per cent over the year. This represents 8.0 per cent of UK revenue.
Total revenue includes a geographic share of north-sea revenue. In 2025-26. Scotland had around 80% of total UK North Sea revenue. Offshore revenue account for £3.2 billion (3.2 per cent) of all revenue raised in Scotland. See Chapter 2 for further explanation.
|
Statistic |
2024-25 |
2025-26 |
Annual change |
|---|---|---|---|
|
Scotland (£ million) |
91,945 |
98,262 |
6.9% |
|
Scotland - excluding North Sea (£ million) |
88,377 |
95,109 |
7.6% |
|
Scotland (% of UK revenue) |
8.1% |
8.0% |
-0.1p.p |
|
Scotland - excluding North Sea (% of UK revenue) |
7.8% |
7.7% |
-0.1p.p |
|
Scotland (% of GDP) |
40.6% |
42.2% |
1.6p.p |
|
Scotland - excluding North Sea (% of GDP) |
41.7% |
43.0% |
1.3p.p |
|
UK (% of GDP) |
38.8% |
40.1% |
1.3p.p |
Revenue per person
In the latest year, revenue per person in Scotland (£17,718) similar to the UK average (£17,720), when including North Sea revenue.
The difference between revenue per person in Scotland and the UK is variable and depends largely on North Sea revenue. Excluding North Sea revenue, revenue per person in Scotland was lower than the UK average by £514 in 2025-26.
|
Statistic |
2024-25 |
2025-26 |
Annual change |
|---|---|---|---|
|
Scotland |
16,585 |
17,718 |
1,133 |
|
Scotland - excluding North Sea |
15,941 |
17,150 |
1,208 |
|
UK |
16,421 |
17,720 |
1,300 |
|
UK - excluding North Sea |
16,356 |
17,664 |
1,307 |
|
Difference Scotland minus UK - Including North Sea |
165 |
-2 |
-167 |
|
Difference Scotland minus UK - excluding North Sea |
-415 |
-514 |
-99 |
Onshore revenue by category
Excluding North Sea revenue, Scotland’s revenue increased to £95.1 billion, an increase of 7.6 per cent, weaker than UK growth of 8.3 per cent.
Taking revenue from taxes alone (excluding those from the North Sea), revenue increased to £81.6 billion an increase of 8.1 per cent.
The three largest taxes, income tax, national insurance contributions, value added tax account for around two thirds of total non-North Sea revenue. Strong growth was seen across the UK for National Insurance contributions, (18.5 per cent in Scotland), reflecting changes to National Insurance contribution paid by employers which came into effect on 6 April 2025.
Of the remaining income from tax, there was strong annual growth in; capital gains tax, (77.5 percent), which followed increases in the tax by the UK Government (Capital Gains Tax — rates of tax - GOV.UK); and Council tax (11.8 per cent), as most councils increased the rate of council tax in 2025-26 following a freeze in 2024‑25. These were offset by falls in duties for tobacco (-5.6 per cent), alcohol (-0.9 per cent) and road fuel (-0.5 per cent), which reflected declining consumption[3].
|
Source of Revenue |
Scotland £ million |
Scotland % of total non-North Sea taxes |
UK £ million |
Scotland as % of UK |
|---|---|---|---|---|
|
Income tax (gross of tax credits) |
22,072 |
27.1% |
330,250 |
6.7% |
|
National insurance contributions |
15,174 |
18.6% |
204,972 |
7.4% |
|
Value added tax |
16,338 |
20.0% |
182,457 |
9.0% |
|
Onshore Corporation tax |
6,387 |
7.8% |
98,916 |
6.5% |
|
Fuel duties |
2,123 |
2.6% |
24,249 |
8.8% |
|
Non-domestic rates |
3,184 |
3.9% |
33,536 |
9.5% |
|
Council tax |
3,298 |
4.0% |
50,448 |
6.5% |
|
VAT refunds |
2,737 |
3.4% |
30,437 |
9.0% |
|
Capital gains tax |
1,168 |
1.4% |
24,293 |
4.8% |
|
Inheritance tax |
420 |
0.5% |
8,502 |
4.9% |
|
Reserved stamp duties |
303 |
0.4% |
22,798 |
1.3% |
|
Scottish land & buildings transaction tax |
983 |
1.2% |
983 |
100.0% |
|
Scottish landfill tax |
56 |
0.1% |
56 |
100.0% |
|
Air passenger duty |
294 |
0.4% |
4,489 |
6.5% |
|
Tobacco duties |
769 |
0.9% |
7,468 |
10.3% |
|
Alcohol duties |
1,041 |
1.3% |
12,432 |
8.4% |
|
Insurance premium tax |
625 |
0.8% |
9,033 |
6.9% |
|
Vehicle excise duties |
705 |
0.9% |
9,047 |
7.8% |
|
Environmental levies |
1,002 |
1.2% |
9,027 |
11.1% |
|
Other taxes1 |
2,879 |
3.5% |
37,316 |
7.7% |
|
Total Non-North Sea taxes |
81,559 |
100% |
1,100,709 |
7.4% |
|
North Sea (Population share) |
313 |
[N/A] |
3,928 |
8.0% |
|
North Sea (Geographical share) |
3,153 |
[N/A] |
3,928 |
80.3% |
|
Interest and dividends |
3,489 |
[N/A] |
42,991 |
8.1% |
|
Gross operating surplus |
9,812 |
[N/A] |
81,936 |
12.0% |
|
Other receipts |
249 |
[N/A] |
2,597 |
9.6% |
|
Total excluding North Sea |
95,109 |
[N/A] |
1,228,233 |
7.7% |
|
Total including population share of North Sea |
95,422 |
[N/A] |
1,232,161 |
7.7% |
|
Total including geographical share of North Sea |
98,262 |
[N/A] |
1,232,161 |
8.0% |
|
of which: revenue accounting adjustments |
10,722 |
[N/A] |
104,135 |
10.3% |
1 A description of the other taxes line is provided in the detailed methodology publication.
Scotland revenue as a share of the UK
Scotland’s share of UK total non-North Sea revenue in 2025-26 was 7.7% which is 0.3 percentage points lower than Scotland’s share of the UK population. In general, Scotland’s share of revenue has been declining over time in line with its declining population share.
Scotland’s estimated share of most large revenues is close to either its population or GDP share. However, there are some exceptions:
Revenues where Scotland’s share of UK revenue is relatively low are:
- those associated with property or assets, such as capital gains tax (4.8%), and inheritance tax (4.9%), reflecting that properties and assets in Scotland tend to have lower values than the UK average.[4]
- Scotland’s share of income tax (6.7%) is also relatively low with Scotland having relatively fewer taxpayers paying the highest rates of income tax[5].
- Scotland’s share of Onshore Corporation tax (6.5%) is likely to reflect the fact that financial services pay a relatively high share of UK corporation tax (accounting for 23% of corporation tax in 2024 compared to less than 10% of Gross Value Added) whilst Scotland relatively less of this industry.[6]
Revenues where Scotland has a relatively large share include:
- Gross operating surplus (GOS), which includes the surpluses of public corporations. Scotland is estimated to generate approximately 12.0 per cent of UK public sector GOS, higher than Scotland’s population share. Scotland’s GOS includes Scottish Water, which is a large contributor to UK public corporations’ GOS. The equivalent water companies in England and Wales are outside the public sector and hence do not contribute to UK GOS.
- Scotland tends to also have relatively high shares of duties associated with tobacco (10.3 per cent) and alcohol (8.4 per cent). This reflects lifestyle differences, for example the greater incidence of smoking,[7] and higher consumption of spirits[8] in Scotland compared with than the rest of the UK
|
Source of Revenue |
2022-23 |
2023-24 |
2025-26 |
|---|---|---|---|
|
Income Tax |
6.8% |
6.7% |
6.7% |
|
Corporation tax (excl North Sea) |
6.6% |
6.6% |
6.5% |
|
National insurance contributions |
7.5% |
7.4% |
7.4% |
|
Value added tax |
8.9% |
9.0% |
9.0% |
|
Council tax and non-domestic rates |
8.0% |
7.6% |
7.7% |
|
All other revenue |
8.9% |
8.8% |
8.7% |
|
Total current non-North Sea revenue |
7.9% |
7.8% |
7.7% |
Adjustments
In order to report revenue on a National Accounts basis, an international reporting standard used by governments, a number of accounting adjustments are included in the total revenue estimate. These are primarily symmetric adjustments that also form part of expenditure and therefore have little impact on the net fiscal balance.
Unlike the expenditure accounting adjustments, which are shown in separate expenditure lines, the revenue accounting adjustments are included within different revenue lines, as is set out in Table A.9 in the online tables. In order to aid transparency, a revenue accounting adjustments line is shown at the bottom of Table 1.3 and 1.5 . This is a sub-total of revenue and is not additional to the revenue totals reported in the tables.
|
Source of Revenue |
Scot 2023-24 |
Scot 2024-25 |
Scot 2025-26 |
UK 2023-24 |
UK 2024-25 |
UK 2025-26 |
|---|---|---|---|---|---|---|
|
Income tax |
18,802 |
20,593 |
22,072 |
276,997 |
305,904 |
330,250 |
|
National insurance contributions |
13,558 |
12,802 |
15,174 |
179,907 |
172,422 |
204,972 |
|
Value added tax |
15,047 |
15,523 |
16,338 |
168,433 |
173,374 |
182,457 |
|
Onshore Corporation tax |
6,019 |
6,146 |
6,387 |
90,778 |
93,681 |
98,916 |
|
Fuel duties |
2,185 |
2,132 |
2,123 |
24,922 |
24,359 |
24,249 |
|
Non-domestic rates |
3,033 |
3,146 |
3,184 |
29,486 |
32,463 |
33,536 |
|
Council tax |
2,896 |
2,950 |
3,298 |
44,489 |
47,417 |
50,448 |
|
VAT refunds |
2,549 |
2,642 |
2,737 |
27,955 |
29,352 |
30,437 |
|
Capital gains tax |
620 |
658 |
1,168 |
14,494 |
13,687 |
24,293 |
|
Inheritance tax |
372 |
409 |
420 |
7,535 |
8,286 |
8,502 |
|
UK stamp duties |
165 |
277 |
303 |
16,792 |
20,604 |
22,798 |
|
Land & buildings transaction tax |
775 |
895 |
983 |
775 |
895 |
983 |
|
Scottish landfill tax |
69 |
56 |
56 |
69 |
56 |
56 |
|
Air passenger duty |
291 |
294 |
294 |
3,846 |
4,131 |
4,489 |
|
Tobacco duties |
924 |
815 |
769 |
8,969 |
7,909 |
7,468 |
|
Alcohol duties |
1,048 |
1,050 |
1,041 |
12,515 |
12,545 |
12,432 |
|
Insurance premium tax |
580 |
619 |
625 |
8,382 |
8,940 |
9,033 |
|
Vehicle excise duties |
612 |
653 |
705 |
7,853 |
8,378 |
9,047 |
|
Environmental levies |
927 |
939 |
1,002 |
8,222 |
8,250 |
9,027 |
|
Other taxes |
2,836 |
2,831 |
2,879 |
35,622 |
36,307 |
37,316 |
|
Total Non-North Sea taxes |
73,311 |
75,430 |
81,559 |
968,041 |
1,008,90 |
1,100,709 |
|
North Sea (Population share) |
439 |
356 |
313 |
5,473 |
4,450 |
3,928 |
|
North Sea (Geographical share) |
4,370 |
3,568 |
3,153 |
5,473 |
4,450 |
3,928 |
|
Interest and dividends |
3,621 |
3,332 |
3,489 |
45,289 |
44,726 |
42,991 |
|
Gross operating surplus |
9,020 |
9,395 |
9,812 |
74,623 |
78,094 |
81,936 |
|
Other receipts |
222 |
221 |
249 |
2,339 |
2,316 |
2,597 |
|
Total excluding North Sea |
86,174 |
88,377 |
95,109 |
1,090,292 |
1,134,096 |
1,228,233 |
|
Total including population share of North Sea |
86,613 |
88,733 |
95,422 |
1,095,765 |
1,138,546 |
1,232,161 |
|
Total including geographical share of North Sea |
90,544 |
91,945 |
98,262 |
1,095,765 |
1,138,546 |
1,232,161 |
|
Of which, revenue accounting adjustment |
9,656 |
10,145 |
10,722 |
93,467 |
98,420 |
104,135 |
Contact
Email: economic.statistics@gov.scot