Free personal and nursing care, Scotland, 2010-11
Presents the latest figures for free personal care (FPC) and free nursing care (FNC).
4. Expenditure
This section presents the total expenditure on free personal and nursing care payments for the years 2003-04 to 2010-11, for clients in a Care Home or receiving a home care service.
4.1 Care Homes
From 1 July 2002, personal and nursing care services became free for people aged 65 and over resident in care homes. In practice this means that everyone aged 65 and over who has been assessed as requiring personal and/or nursing care services in a care home receives £145 per week for personal care and £65 per week for nursing care.
The weekly payments for personal care and nursing care have been increased in recent years. From the 1st April 2010 the payments were £156 and £69.
The expenditure data on free personal and nursing care relates only to self-funders who previously would have paid for all of their care. The figures therefore allow us to estimate the additional cost to Local Authorities in Scotland, following the implementation of this policy, in relation to care homes.
Figure 5 : Expenditure in Care Homes
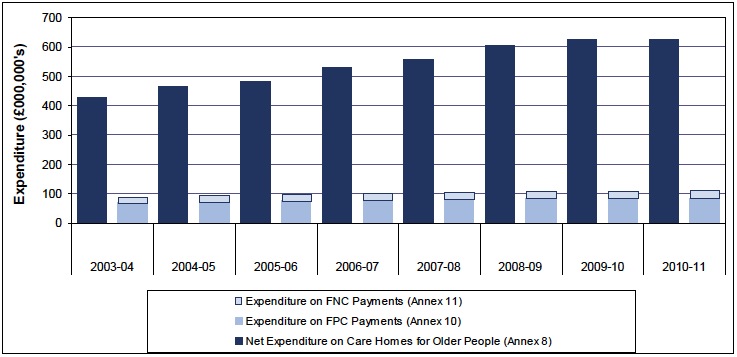
Table 3: Expenditure on Care Homes for Older People, 2003-04 to 2010-11 £ Millions
| 2003-04 | 2004-05 | 2005-06 | 2006-07 | 2007-08 | 2008-09 | 2009-10 | 2010-11 | |
| Net Expenditure on Care Homes for older people (Annex 8) | 424.9 | 466.0 | 479.6 | 528.7 | 556.3 | 602.0 | 624.9 | 626.8 |
| Free Personal Care payments (Annex10) | 67.7 | 72.4 | 75.6 | 77.1 | 81.0 | 82.3 | 84.3 | 85.3 |
| Free Nursing Care payments (Annex 11) | 18.7 | 20.6 | 21.7 | 22.1 | 23.2 | 23.6 | 23.4 | 23.1 |
| Expenditure on FPNC in care Homes (Annex 9) | 86.4 | 93.0 | 97.3 | 99.2 | 104. | 106.0 | 107.6 | 108.4 |
| Expenditure on FPNC as percentage of Net Expenditure on Care Homes for older people | 20.3% | 20.0% | 20.3% | 18.8% | 18.7% | 17.6% | 17.2% | 17.3% |
Source: Free Personal and Nursing Care Expenditure Survey, Local Government Finance LFR3.
Table 3 shows that expenditure on free personal care for self-funders in care homes has shown an increase each year from £68 million in 2003-04 (first full year of the policy) to over £85 million in 2010-11.
Expenditure on free nursing care for self-funders in care homes has also risen each year from nearly £19 million in 2003/04 (first full year of the policy) to nearly £24 million in 2008/09. This has decreased over the last two years £23 million in 2010-11.
The total expenditure for FPNC in care homes has risen from over £86 million in 2003-04 to over £108 million in 2010-11. This increase reflects the increasing number of self-funders up until 2008-09 and the annual increases in the FPNC payments from April 2008. Expenditure on Free Personal and Nursing Care payments to self-funders accounts for around a sixth of total net expenditure on Care Homes.
4.2 Home care
From 1 July 2002, all personal care services provided to people in their own homes became free of charge. Prior to this date, local authorities had discretion to charge for these services and a variety of charging policies operated across the country. Any charges were subject to a financial assessment which meant that in practise many people received these services for free prior to the introduction of free personal care. With the introduction of free personal care these services became free for all clients. Local authorities can still charge for domestic services such as help with shopping or housework.
Since 2002, information has been collected on the cost of providing personal care services at home. It should be noted that these costs do not tell us the additional cost of this policy as many people would have received these services for free prior to 2002 as noted above. It is estimated that at least £64.5 million was spent by Local Authorities on providing personal care services in 2001-02, the year before the policy was introduced. Details of how this was estimated are available from:
www.scotland.gov.uk/Topics/Health/care/17655/SutherlandReview/Reports-Used/Care-Cost-Sub-Group
Figure 6: Expenditure on Home Care services

Table 4: Expenditure on Home Based Services for Older People 2003-04 to 2010-11 £ Millions
| 2003-04 | 2004-05 | 2005-06 | 2006-07 | 2007-08 | 2008-09 | 2009-10 | 2010-11 | |
| Net Expenditure on Home Care services for older people (Annex 10) | 223.8 | 247.9 | 287.4 | 305.0 | 335.5 | 377.8 | 398.5 | 406.7 |
| Expenditure on Personal Care at home (Annex 11) | 132.8 | 158.0 | 189.1 | 228.2 | 267.5 | 276.9 | 317.4 | 342.1 |
| FPC Expenditure as a percentage of total net expenditure on Home Care services | 59.3% | 63.7% | 65.8% | 74.8% | 79.7% | 73.3% | 79.6% | 84.1% |
Source: Free Personal and Nursing Care Expenditure Survey, Local Government Finance LFR3.
Table 4 shows total expenditure on personal care services at home has increased each year from nearly £133 million in 2003-04 (first full year of policy) to just over £342 million in 2010-11, an increase of nearly 158 per cent.
Expenditure on personal care services accounted for 59 per cent of overall net expenditure on home care services in 2003-4. This increased each year to 80 per cent in 2007-08, decreasing in 2008-09 to 73 per cent. The percentage has increased over the last two years to 84 per cent in 2010-11 and this is a 42 per cent increase when compared to 2003-04.
The more than doubling of spend on free personal care since it’s introduction is reflected in the shift away from care being provided in either care homes or hospital towards more care being provided in peoples own homes. At the same time there has been an increase in the proportion of clients receiving personal care services as home and care workers are increasingly providing personal care services rather than domestic services. These increases in expenditure will be linked to the following National indicators:
Contact
Email: Swstat@scotland.gsi.gov.uk