Free personal and nursing care, Scotland, 2010-11
Presents the latest figures for free personal care (FPC) and free nursing care (FNC).
3. People receiving Free Personal Care and Free Nursing Care
This section presents the latest available data on people receiving free personal care and nursing care in a care home and people receiving free personal care at home. Where available provisional figures for 2011/12 have been provided, these figures have not been validated.
3.1 Care Homes
Since 2002, the Scottish Executive has collected information on the number of residents aged 65+ supported by local authorities in care homes. These residents may be mainly funded by their local authority or may be a self-funder receiving the appropriate weekly payment towards their care homes fees. All of these residents receive personal care services for free.
Figure 3:Care Home residents
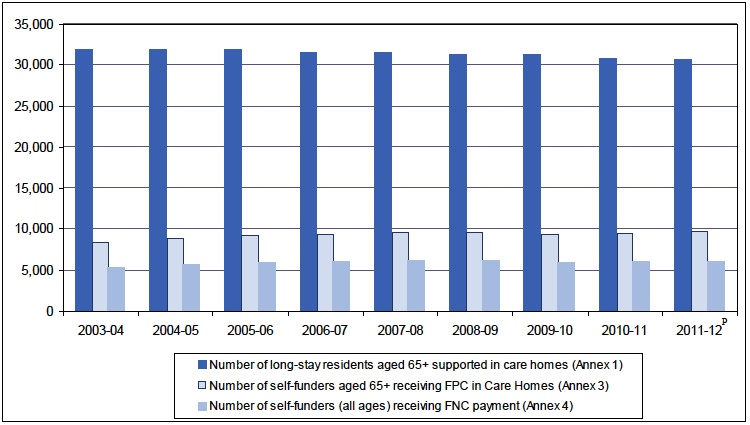
PProvisional data
Table 1: Care Home residents, 2003-04 to 2011-12
| 2003-04 | 2004-05 | 2005-06 | 2006-07 | 2007-08 | 2008-09 | 2009-10 | 2010-11 | 2011-12p | |
|---|---|---|---|---|---|---|---|---|---|
| Number of long-stay residents aged 65+ (Annex 1)1 | 31,890 | 31,860 | 31,810 | 31,440 | 31,470 | 31,280 | 31,220 | 30,810 | 30,580 |
| Number of self-funders aged 65+ receiving FPC (Annex3)1 | 8,350 | 8,900 | 9,180 | 9,370 | 9,510 | 9,570 | 9,320 | 9,480 | 9,650 |
| Number of self-funders (all ages) receiving FNC (Annex 4)1 | 5,270 | 5,690 | 5,890 | 6,060 | 6,130 | 6,180 | 5,960 | 6,000 | 6,040 |
| Self-funders aged 65+ receiving FPC as proportion of all long-stay residents | 26.2% | 27.9% | 28.9% | 29.8% | 30.2% | 30.6% | 29.9% | 30.8% | 31.6% |
| Proportion self-funders aged 65+ receiving FPC & FNC | 63.1% | 63.9% | 64.2% | 64.7% | 64.5% | 64.6% | 63.9% | 63.3% | 62.6% |
Source: Community Care Quarterly Key Monitoring return.
1All figures are yearly averages rounded to the nearest 10.
PProvisional data
Table 1 shows that the average number of long-stay residents aged 65+ in care homes in Scotland reduced slightly since the introduction of free personal and nursing care. In 2003-04 there were nearly 31,900 older people in care homes reducing to around 30,800 in 2010-11. The provisional figures for 2011-12 suggest that this trend is continuing as the number of long-stay residents aged 65+ has reduced further.
In contrast, table 1 shows that the number of self-funding residents who receive the FPC payment for free personal care has increased each year from around 8,400 in 2003-04 to just under 9,600 in 2008-09. In 2009-10 there was a decrease in the residents to nearly 9,300, followed by increases in both 2010-11 & 2011-12 to just over 9,600.
The trend is the same for the proportion of long-stay residents who are self-funders. The proportion increased from 26 per cent in 2003-04 to 31 per cent in 2008-09 and has fluctuated around 30-32 per cent since then. Around two-thirds of self-funding residents receive the FNC payment in addition to the FPC payment.
A possible reason for the decreases shown in 2009-10 is the introduction of the National Eligibility Criteria and Waiting Times for the Personal and Nursing Care of Older People[1] during 2009-10.
3.2 Home Care
Prior to 1 July 2002, people aged 65 and over could be charged for personal care services provided in their own home. They can however be charged for domestic services such as help with shopping or housework but any charge would be subject to a financial assessment.
Figure 4: Home care clients

PProvisional data
Table 2: Home Care clients, 2003-04 to 2011-12
| 2003-04 | 2004-05 | 2005-06 | 2006-07 | 2007-08 | 2008-09 | 2009-10 | 2010-11 | 2011-12P | |
|---|---|---|---|---|---|---|---|---|---|
| Home Care clients aged 65+ (Annex 5)1 | 57,760 | 57,880 | 57,190 | 56,700 | 55,340 | 54,720 | 53,660 | 51,760 | NA |
| Home Care clients aged 65+ receiving personal care services at home (Annex 6)1 | 32,870 | 36,300 | 40,750 | 40,410 | 42,260 | 44,200 | 46,260 | 46,720 | 46,530 |
| Average weekly hours of personal care at home (Annex 7)2 | 226,000 | 242,900 | 259,600 | 272,900 | 299,400 | 333,100 | 350,100 | 370,000 | 378,300 |
| Proportion of all home care clients aged 65+ receiving personal care | 56.9% | 62.7% | 71.3% | 71.3% | 76.4% | 80.8% | 86.2% | 90.3% | NA |
| Average number of hours personal care each week | 6.9 | 6.7 | 6.4 | 6.8 | 7.1 | 7.5 | 7.6 | 7.9 | 8.1 |
Source: Community Care Quarterly Key Monitoring Return, H1 Home Care return.
1All figures are rounded to the nearest 10, 2011-12 data not available at time of publication.
2All figures are average weekly hours (based on last week of each quarter) rounded to the nearest 100.
PProvisional data
Following the introduction of free personal care, the number of older people receiving home care services in Scotland increased from just under 57,800 in 2003-04 to nearly 57,900 in 2004-05. In 2005-06, the numbers fell slightly to just under 57,200, followed by further falls each year to under 51,800 in 2010-11.
In contrast Table 2 shows for the same period that the number of home care clients receiving personal care services has increased each year from nearly 32,900 clients in 2003-04 to just over 46,700 in 2010-11, this is an increase of about 42 per cent. The provisional figures available for 2011-12 show a slight decrease of around 200 clients to around 46,500.
The estimated number of hours of personal care provided has increased substantially from a weekly average of 226,000 hours in 2003-04 to 370,000 in 2010-11, this is an increase of just under 64 per cent. The provisional figures available for 2011-12 show that this trend is continuing with a further increase of over 8,000 hours. The average hours provided each week has increased by one hour from 6.9 hours in 2003-04 to 7.9 hours in 2010-11.
Over the last eight years there has been a shift away from care homes towards more care being provided in peoples own homes. At the same time there has been an increase in the proportion of clients receiving personal care services. In 2003-04, 57 per cent of clients received personal care services. This has increased to 90 per cent in 2010-11. This increase is linked to the following National indicators:
- Improve support for people with care needs
- Increase the percentage of people aged 65 and over with high levels of care needs who are cared for at home.
The Scottish Executive publishes home care statistics annually. The latest figures, for 2011, are available from: http://www.scotland.gov.uk/Topics/Statistics/Browse/Health/Publications
Contact
Email: Swstat@scotland.gsi.gov.uk