Family migration: understanding the drivers, impacts and support needs of migrant families
This report by the independent Expert Advisory Group on Migration and Population analyses the rules around family migration in Scotland and the UK and recommends future action.
4 Migrant Families in the UK: Survey Data
This chapter explores in more detail the trajectories or life-courses of migrant families and their members. It draws on two main surveys: Understanding Society, and the UK Labour Force Survey. In both cases, we analysis cohorts of migrants and households who migrated to the UK after 1990 or 2000. As discussed in Chapter 3, this increases the relevance of the analysis to migrants in Scotland, given the concentration of migration to Scotland over this more recent period.
1. Migrant households
In this section we draw on data from the Understanding Society (US) longitudinal survey (University of Essex 2020). Although this is one of the largest longitudinal surveys in the world, it contains a relatively small sample of migrant households (around 50) in Scotland. But given that the evidence from the APS suggests strong similarities between migrants to Scotland and to other parts of the UK at least since 2000, the statistics which follow focus on the characteristics of migrant households that have moved to the UK since 2000. Note that in what follows, we concentrate on households rather than families, but this distinction should be borne in mind when interpreting the results, noting that the number of multi-family households is relatively small.
Understanding Society allows for more detailed analysis of household characteristics, and its various waves allow us to analyse the economic and social trajectories of migrants after their arrival in the UK. It also enables us to better understand how adults belonging to migrant families comprise a mixture of foreign-born and UK-born individuals. This is illustrated in Figure 10 which shows how foreign-born individuals are distributed across the 30,000 households which comprise Wave A of US. The lower share of foreign-born individuals in Scotland recorded in the APS is reflected in the lower share of households with any foreign-born individuals in US.
Also evident from Figure 10 is that the overseas born are more likely to live alone or in households with native-born individuals, than they are to live with other foreign-born individuals. Among the 5,300 households that include at least one foreign-born individual, around 1,160 (22%) comprise a single individual with or without children, while around 3,600 (68%) households include one foreign-born individual and one or more UK-born. A further 9.8% of migrant households comprise two or more individuals of whom two or more have been born outside the UK. Overall, among the relatively small share of UK households that include foreign-born individuals, those that comprise a mixture of foreign-born and UK-born are in a considerable majority.
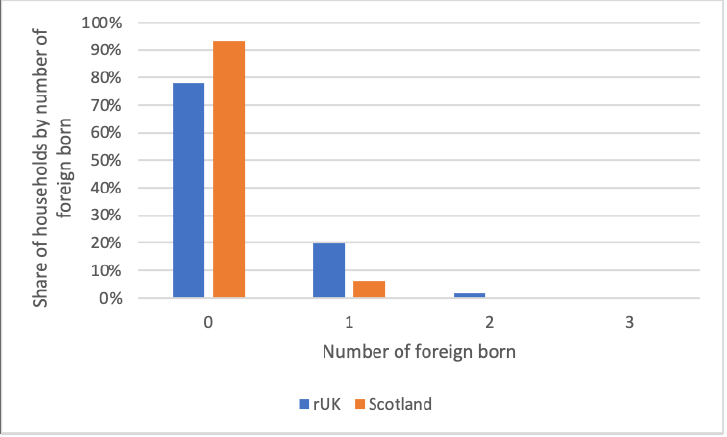
Source: Understanding Society Wave A
Figure 11 compares the distribution of household types for the native-born with those of at least one migrant that has arrived since 2000. This is the Understanding Society equivalent of Figure 9, which showed the distribution of household structure using the APS. Again, because relatively few of those that have migrated since 2000 include pensioners, the ‘native-born’ category only includes individuals where the first two adults are aged between 24 and 57.
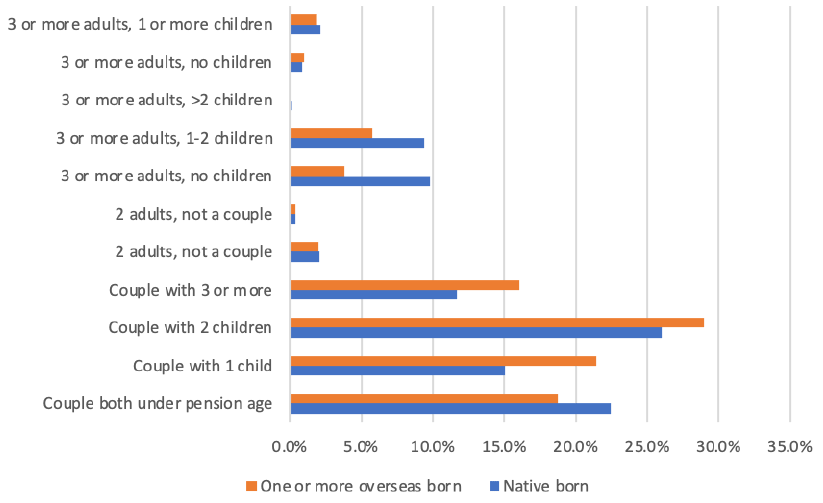
Source: Understanding Society Wave G
Single-person households and couples with no children are more common among the native-born, while Understanding Society confirms the APS finding that migrant households are more likely to include children. Their greater fertility may reflect fertility rates at their country of origin, or it may be that couples with children are more likely to migrate, motivated by the desire to provide better life opportunities for their children (see Chapter 1). Further analysis would be required to explore these hypotheses. Non-migrant households are more likely to include three or more adults.
Figure 12 shows that migrant households tend to rely more heavily on rented accommodation than do native households, confirming the findings of Chapter 3. Only a relatively small share of migrant households own their accommodation outright. The reliance on renting increases with the number of adults born outside the UK: the larger the number of family members born outside the UK, the greater the reliance on rented accommodation. Rental accommodation is concentrated on private (both furnished and unfurnished) and local authority rentals. The proportion buying their accommodation with a mortgage is broadly the same, irrespective of country of birth.
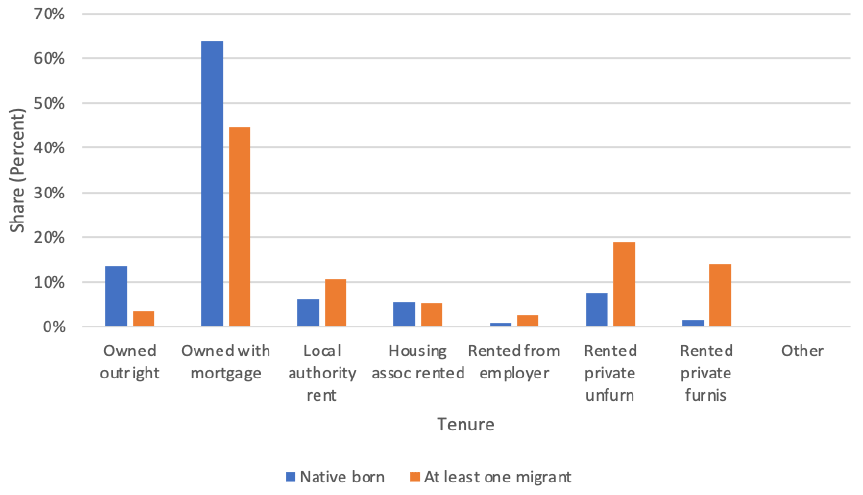
Source: Understanding Society Wave G
2. Family trajectories
In order to understand patterns of family mobility and integration in Scotland and the UK, it is important to analyse the life trajectories of migrant families (Kulu and Gonzalez-Ferrer 2014). This section investigates partnership and childbearing changes among immigrants in the UK. We use data from the Understanding Society study. As we saw above, Understanding Society is a large annual longitudinal study that was launched in 2009. The main immigrant and ethnic minority groups were over-sampled in the study, thus providing a sufficient sample size to study ethnic differences in attitudes and behaviour. Information was also collected on individuals’ partnership, fertility and employment histories, allowing us to investigate immigrant employment and family changes in the UK over a long time period.
We focus on a sample of 4,982 foreign-born individuals in the UK who arrived in the UK between 1990 and 2016. Their trajectories can be followed for five years since immigration to the UK. We analysed the evolution of their partnership and childbearing histories after migration. To increase the sample size for longitudinal analysis we also included those who arrived in the 1990s. Our further analysis showed that the patterns with and without arrivals in the 1990s were very similar.
Around 60% of immigrants currently living in the UK arrived in the UK as single individuals, and 40% came as married (Figure 13). However, there has been a small change over the years. The share of individuals who arrived as unpartnered has slightly declined, whereas the proportion of married individuals has increased. This is likely to reflect changes in entry rules, notably the increased prominence of EU migration which allowed much greater flexibility for family migration, as well as the importance of Skilled Worker routes which allowed entrants to bring dependants (see Chapter 2). Although most people arrived as single or married, there are also individuals in non-marital unions and people who are separated, suggesting that immigrants reflect wider changes in partnership patterns that have taken place in the origin and destination societies, such as an increase in non-marital unions, separation and re-partnering.
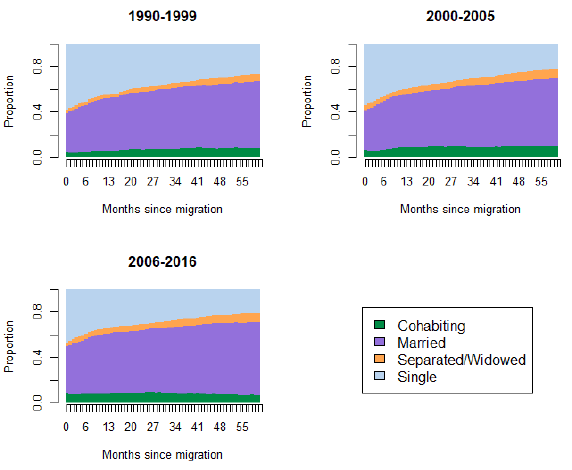
Note: time since migration in months; N=4,982. Source: Authors’ calculations based on the UKHLS data
Childbearing histories provide additional information on immigrant families at arrival in the UK and following migration. Unsurprisingly, most people moved to the UK as childless individuals and became parents only later (Figure 14). The share of childless migrants seems to have slightly declined over the years (a few percent points), whereas those with children has slightly increased, which corresponds to observed partnership changes.
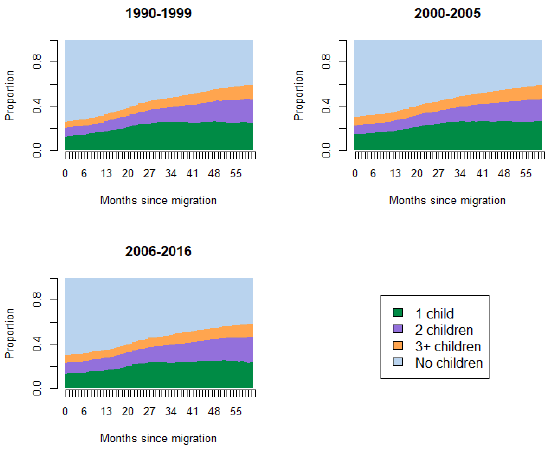
Note: time since migration in months. Source: Authors’ calculations based on the UKHLS data
Classification of immigrants’ family trajectories provides the opportunity to investigate the heterogeneity within the migrant population and to also determine factors that have shaped migrant family trajectories in the UK. Based on their partnership status and family size at arrival and trajectories after migration we can classify immigrants into three broad groups (Figures 15 and 16). The first group (Type 1) consists of individuals who arrived in the UK as singles and childless and stayed unpartnered (and childless) in the first five years after migration (and formed unions and had children later, five to ten years after migration; not shown). These are individuals who came to the UK as young adults (in their late teens and early twenties) to study or work; they formed more than a quarter (28%) of migrants who arrived between 1990 and 2016. We can call this group ‘single and childless’.
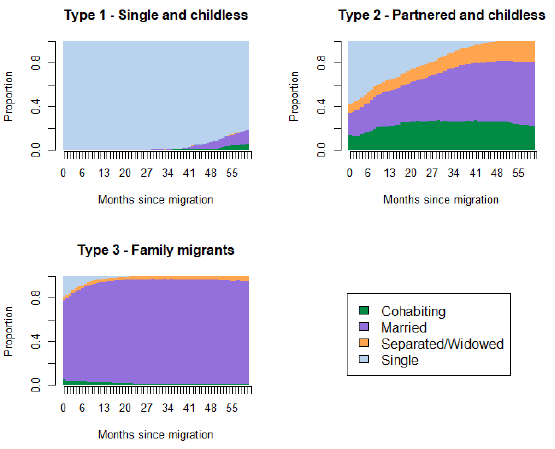
Note: time since migration in months. Source: Authors’ calculations based on the UKHLS data
The second group (Type 2, 30%) includes immigrants who arrived as single or partnered individuals, but experienced significant partnership changes during the first two to three years following migration: many formed non-marital unions, some of which became later marriages, some of which dissolved. They arrived as childless; most of them stayed childless for the first three years and some had children thereafter. They are the ‘partnered and childless’ group. The third group (Type 3, 42%) consists of migrants who were already married when they arrived in the UK. They came with children; some had another child in the next three to five years. We call them ‘family migrants’.
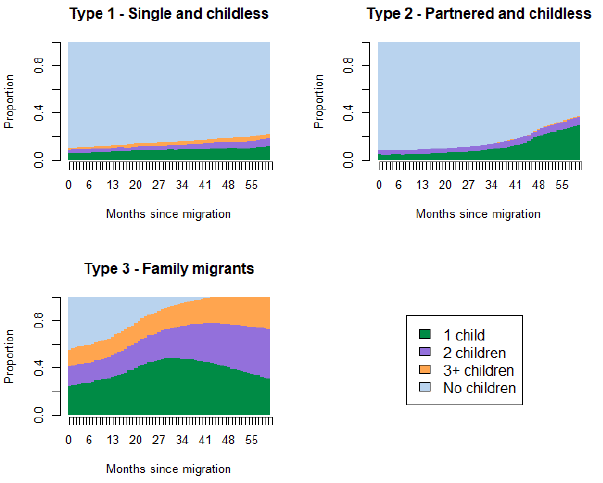
Note: time since migration in months. Source: Authors’ calculations based on the UKHLS data
Next, we investigate how individual characteristics predict belonging to one of the three partnership and fertility groups. We report determinants of the ‘single and childless’ (Type 1) and ‘family migrants’ (Type 3) groups. Women were significantly less likely to arrive as single and childless than men and more likely to be married and have children at arrival (Figure 17). (The value of -0.1 means that they were 10 per cent points less likely to arrive as unpartnered and childless, everything else being equal.) This is not surprising given that (traditional) labour migration with family reunification has been an important trend in immigration to the UK over the last decades. The age gradient is as expected: unpartnered childless migrants were younger, whereas family migrants were older at arrival.
The educational differences are less clear, although there were more individuals with low levels of education among family migrants. The analysis by immigration cohort supports that the single and childless group has slightly declined over time, although the change has been small. Interestingly, non-EU migrants were more likely to arrive as family migrants and less likely to arrive as single and childless than those who came from EU countries. Finally, the patterns seem to be relatively similar in Scotland and the rest of the UK.
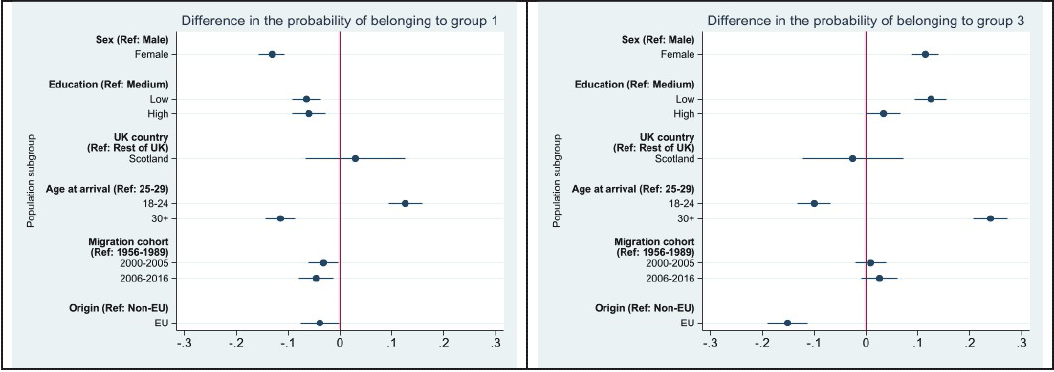
Source: Authors’ calculations based on the Understanding Society data
3. Qualifications and employment
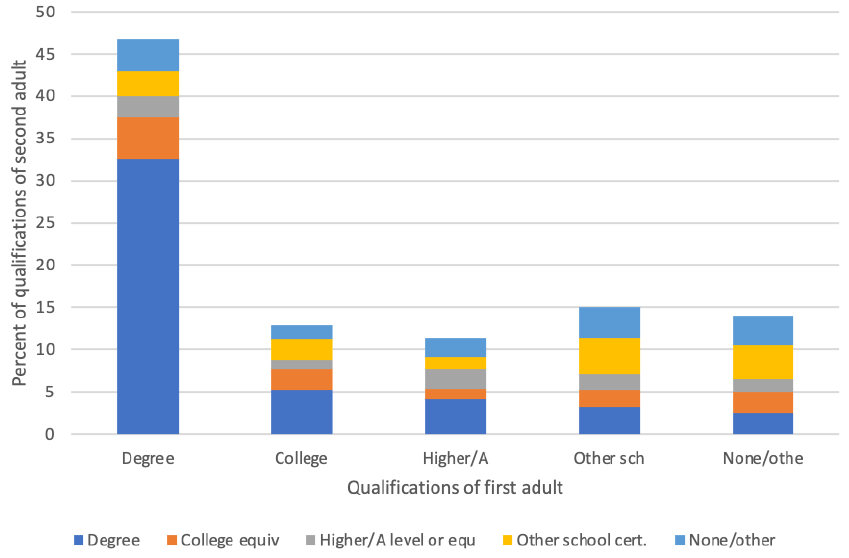
The Understanding Society data we introduced earlier in the chapter allows us to analyse the highest educational qualification held by adult respondents. And because qualifications held by all adult family members are recorded, it is possible to determine the mix of qualifications within the household. Thus, for example, we can determine the proportion of households in which at least two adults hold degrees, or in which one holds a degree and the other has no educational qualification. These combinations are portrayed in a 3D chart where the height of each column represents the proportion of adults 1 and 2 who hold each combination of highest educational qualification. Figure 18 shows two such charts, one for households with either no-one born abroad or where an adult was born abroad but came to the UK before 2000, and one for those households where at least one individual was born abroad and has come to the UK since 2000.
Source: Understanding Society Wave G
The charts show that not only do a high proportion of migrants hold degrees, it is also likely that other members of the household also hold a degree. This is particularly true for migrant households with two or more members born abroad. For natives, it is almost as likely that households have two members with no qualifications as it is to have two members with degrees. Figure 18 shows clearly how the UK has benefited from an influx of well-qualified migrants since 2000. This data also indicates the importance of ensuring adequate childcare for migrant families, given that these households are more likely to include two highly qualified parents.
Another implication that can be drawn from these results is that ‘educational mixing’ is not more prevalent among migrants than among the native-born: around 42% of migrants share their household with an adult with the same highest qualification. For migrant households, the likelihood of two adults having the same level of qualification is slightly higher at 45%. Educational sorting has implications for the evolution of inequality: increased migrant flows are unlikely to reverse the trend towards reduced educational mixing which is a driver of inequality.
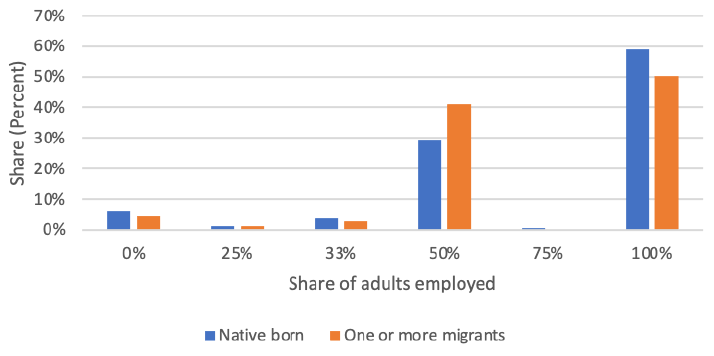
Employment status can also be analysed using US. Focusing again on those who have migrated since 2000, Figure 19 shows the distribution of the number of adults employed as a share of all adults within a household. Again, native-born households are restricted to those where the first two adults are aged between 24 and 57. In just under 60 per cent of native-born households, all (100%) of adults are employed. Only 50% of migrant households fall into this category. Having one employed adult is more common among migrant households, with 40 per cent of migrant households falling into this category, compared with around 30 per cent of native households. Less than 5% of migrant households have no-one working, compared with 6% of the native-born.
As we saw in Chapter 1, these difficulties may be reinforced by reduced availability of support from a wider family network which may be available to natives but less so to migrants. Given the high levels of qualification within migrant households as shown in Figure 18, there is a case for investigating the impediments to raising employment levels within migrant households.
Source: Understanding Society Wave G
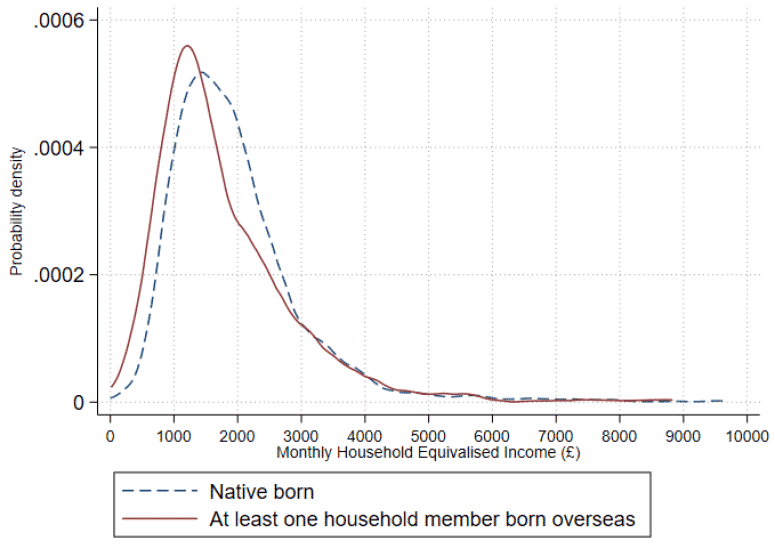
Understanding Society also contains a detailed analysis of household income sources before and after tax – including wages, benefits, investments and rental income. Measures of net income are the usual source of comparisons of living standards. Comparisons of net income are generally adjusted for household composition using OECD equivalence scales. The resultant distributions of net income for native-born and households where at least one household member was born overseas and has come to the UK since 2000 are shown in Figure 20. It uses kernel densities to approximate the monthly distribution of net equivalised income for both types of household. Again, only those native-born households where the first two adults are aged between 24 and 57 have been included in the comparisons.
Source: Understanding Society Wave G
The distributions of net equivalised income is broadly similar, but both the mode and median income are slightly lower among migrant households. There are several possible explanations. Firstly in relation to wage income, migrants are less likely to benefit from a career history accepted by UK employers. Secondly, it may be the case that migrants are ‘under-employed’, meaning that they accept employment for which they are overqualified and in consequence earn less than their educational qualifications might suggest. Thirdly, migrants are likely to have less access to social support because of migration rules restricting access to public funds, and their lack of UK-based employment history. Finally, migrants are unlikely to come to the UK with a store of wealth which could be used to generate investment or rental income. Thus, in comparison to native-born households, there are plausible explanations of the differences in the distributions of net household income.
Employment trajectories
We can also analyse employment patterns by exploring how migrants’ employment trajectories have evolved in the UK since arrival, comparing these trajectories across different family statuses. This analysis of employment is based on the Understanding Society data, though using a smaller sample (N=1,828), given that information on employment histories was only collected for part of the Understanding Society sample. Drawing on this data, we first of all derive a general picture of employment patterns across all types of family status. We can see that more than a half of immigrants who arrived since 1990 commenced work after arrival (either full- or part-time). Around one-fifth began their studies, and the remaining portion stayed out of the labour market. Regarding the time since migration, the proportion of individuals employed full-time increases at the expense of students (and also part-time employees), suggesting that some migrants came to study first, and then subsequently entered the labour market.
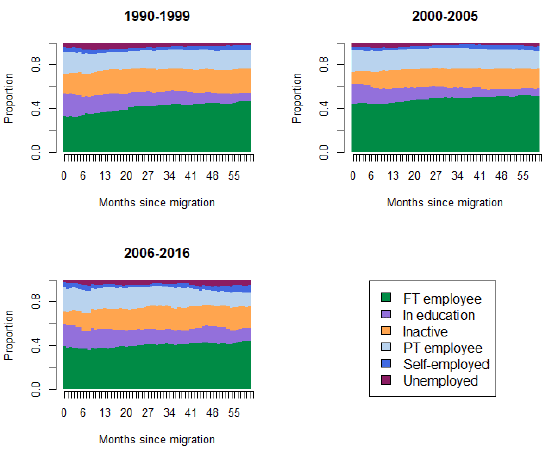
Note: time since migration in months; N=1,828. Source: Authors’ calculations based on the Understanding Society data.
We now classify the employment trajectories of immigrants after arrival in the UK according to family status (see section 2). Type 1 describes individuals classified as ‘single and childless’; Type 2 refers to ‘partnered and childless’ immigrants, who arrived as single or partnered individuals, but experienced significant partnership changes over the first two or three years following migration; and Type 3 are ‘family migrants’ who were already married when they arrived in the UK. The groups and their determinants are very similar to those obtained when using a larger sample (see Chapter 3) – hence, we only show and briefly discuss employment histories for the three migrant groups.
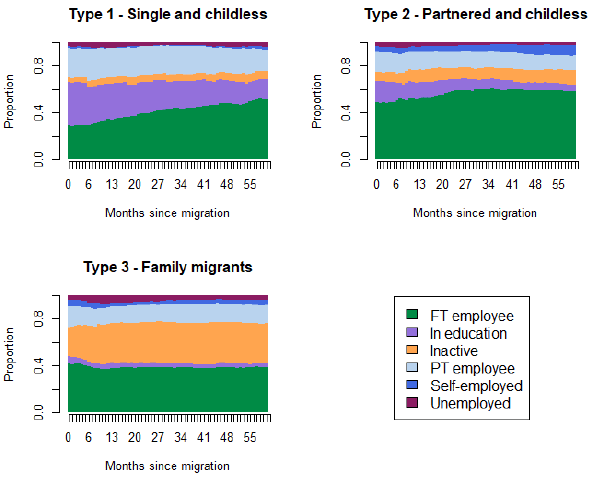
Note: time since migration in months. Source: Authors’ calculations based on the Understanding Society data.
Most individuals classified as ‘single and childless’ (Type 1) arrived in the UK to study, as expected (Figure 22). This group shows a very high share of students and part-time workers. However, this share gradually declines as many become employed full-time after their studies. Among the ‘partnered and childless’ group, full-time employment is the dominant category, although there are also part-time employees and students within this group. The ‘family migrants’ (Type 3) also exhibit diversity in their employment patterns. However, two categories dominate: some people work full-time, but many have stayed out of the labour market. Our further analysis shows that most women in Type 3 are not active in the labour market or education, whereas most men work full-time (Figure 23). This corroborates the findings from the first part of this chapter about the higher propensity for migrants to have one partner working (usually the man), with the woman staying at home. Interestingly, among unpartnered childless migrants a significant portion of women arrived because of studies.
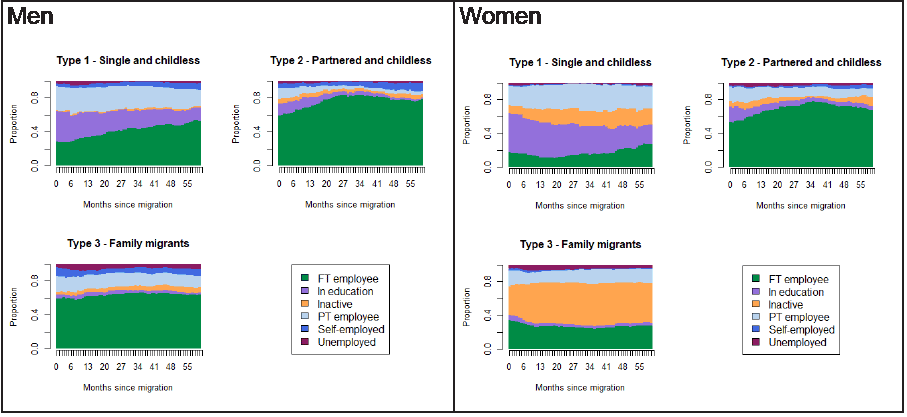
Note: time since migration in months. Source: Authors’ calculations based on the Understanding Society data
4. Well-being
Finally, we consider whether migrant households’ well-being differs from those of native-born families. Migration is often perceived to offer a route to enhanced well-being, through increasing income and more general life opportunities for migrants and their families. However, the link between migration, income and increased well-being is not strong (Olgiati, Calvo and Berkman 2013). Migration is a stressful event that can have a negative impact on well-being, especially where there is a significant difference between pre-migration expectations and post-migration outcomes.
Using Understanding Society, we compared a standard measure of well-being – life satisfaction – for migrants and UK-born using the same definitions for these categories as previously described. We were also able to calculate average well-being within each household since the life satisfaction question is asked of all adults. We also examined the variation of well-being within households. The results show no significant differences between average life satisfaction in native-born and migrant households or in its variance. However, we note that there may be important cultural differences in relations to understandings and perceptions of life satisfaction (Lau, Cummins and McPherson 2005). For these reasons, these survey findings need to be treated with caution.
For the native-born, well-being has been relatively stable over time. We do not know whether the same is true of those who have migrated to the UK. They may have experienced a substantial increase in well-being since their arrival – or a substantial fall. Although this finding is interesting and may suggest that migrants gradually reflect the characteristic of the native-born population, it does not imply that migration has not been beneficial for the well-being of those who have migrated to the UK.
Summary
- Survey data suggests that of those migrant households that have moved to the UK since 2000, the majority are ‘mixed’: 68% of households that include at least one foreign-born national also include one or more UK-born national.
- The data confirms our analysis in Chapter 3 that migrant households are more likely to include children; and also that migrant households rely more on rented accommodation than do non-migrant households.
- Around 60% of migrants currently living in the UK arrived in the UK as single individuals (with many marrying or becoming parents later); 40% arriving as married. However, the share of those arriving as single has declined slightly, which may reflect a change in immigration rules. Women are significantly less likely to arrive as single and childless than men – they are more likely to be married with children at arrival.
- EU migrants were more likely to arrive as family migrants than those who came from other countries, reflecting more lenient rules on family migration under EU free movement.
- A high proportion of migrants who arrived after 2000 possess degrees. Moreover, for migrant households, and especially those with two or more members born abroad, there is a greater likelihood that more than one members who hold degrees – suggesting highly qualified couples.
- However, migrant households are also less likely to have all members employed. Instead, they are more likely to see 50% of the household working, typically reflecting a pattern of a male bread-winner and a female staying at home to care for children. This finding appears to confirm analysis presented in Chapter 1 about the challenges for women in navigating limited childcare possibilities with sustaining work.
- Migrant households are less likely to have no-one employed at all, reflecting the fact that most migrants enter as labour migrants. However, despite higher qualifications, migrant households enjoy slightly lower incomes than non-migrant households. Explanations for this difference might include impediments in having skill and qualifications recognised by employers, less knowledge of the labour market, or limited access to public funds.
Contact
Email: population@gov.scot