Family migration: understanding the drivers, impacts and support needs of migrant families
This report by the independent Expert Advisory Group on Migration and Population analyses the rules around family migration in Scotland and the UK and recommends future action.
3 Migrant Families in Scotland
This chapter provides an overview of migrant families and households in Scotland. It starts by examining what we know about migrant families in Scotland, including the family profile of those who arrived in Scotland between 1990 and 2011, and the distribution of migrant families across Scotland. In part two, we analyse migrant households in Scotland and the UK, comparing them to non-migrant households.
1. Migrant families in Scotland
We start by drawing on the 2011 census to provide an overview of family type in Scotland, comparing immigrants to the Scottish-born population. We use the 2011 census microdata on individuals aged 19 and older who were born outside Scotland. We focus on so-called ‘lifetime migrants’ who arrived in Scotland between 1990 and 2011.
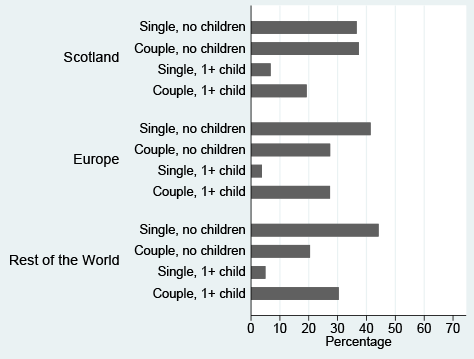
Note: The classification is based on the following 2011 census variables: living arrangements (LARPUK11) and dependent children (DPCFAMUK11).
Source: The 2011 census microdata, individuals aged 19 and older; N= 267,072
Most (adult) people born in Scotland are either singles or couples without children (Figure 1). The family profile of migrants is somewhat different. There are fewer childless couples and more couples with one or more children. This result is largely expected, as on average immigrants are younger than the Scottish-born population; many of them are at the typical age for people to form a family or have dependent children. Most importantly, if we included individuals who either are in a union and/or have dependent children, then about 60% of immigrants are living in families.
The analysis of individuals living in unions and those living with dependent children by age suggests that overall the patterns are very similar among immigrants and the Scottish-born populations, and the differences we observe (in Figure 1) are mostly attributed to the younger age structure of immigrants. The share of people in Scotland living either in a co-residential or marital union increases with age and it is the highest among people aged 30 to 59: 70% of them are living in unions (Figure 2). Most migrants from the rest of the world have a slightly higher proportion of partnered individuals than those born in Scotland. But overall, the partnership patterns are not that different across population subgroups. The same is true when we look at the share of individuals (partnered or not) who have one or more (dependent) children. This share is the highest among individuals aged 30 to 49 and it is slightly higher among immigrants from the rest of the world than for the Scottish-born population or immigrants from Europe.
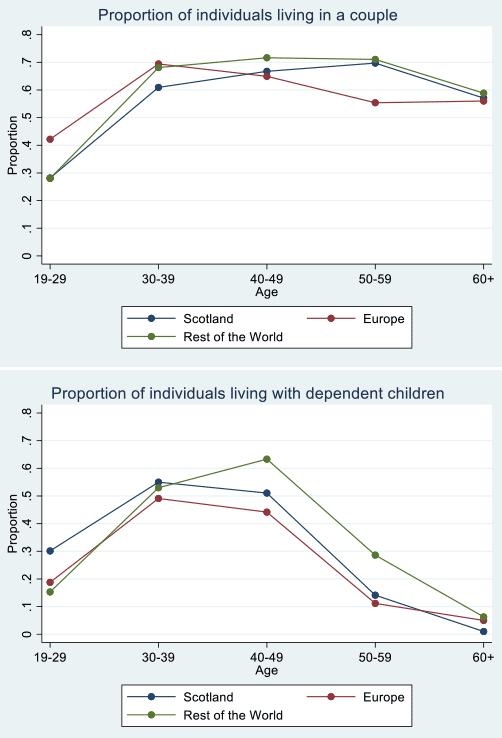
Source: The 2011 census microdata
The census data can also tell us about home ownership among migrant families. Home ownership in Scotland and the UK is considered an important investment, a source of financial security and a status symbol. About 65-70% of Scottish-born population aged 30 and older were homeowners in 2011. Immigrants are significantly less likely to own a home than the non-migrant population in Scotland across all age groups, although the differences decline by age (Figure 3). Among immigrants, those from Europe have lower home ownership rates than migrants from the rest of the world. The analysis of patterns by family type shows that the proportion of homeowners is the lowest among singles and the highest for couples, especially with children for all groups, as expected, but overall this is lower for overseas migrants than the Scottish-born population and it is the lowest among (continental) European migrants (Figure 3).
Several factors may explain this pattern of ownership. First, migrant households will generally have had less experience of the UK housing market. Second, they may not wish to fully commit to remaining in the UK: rental accommodation provides more flexibility should they wish to return to their country of origin.
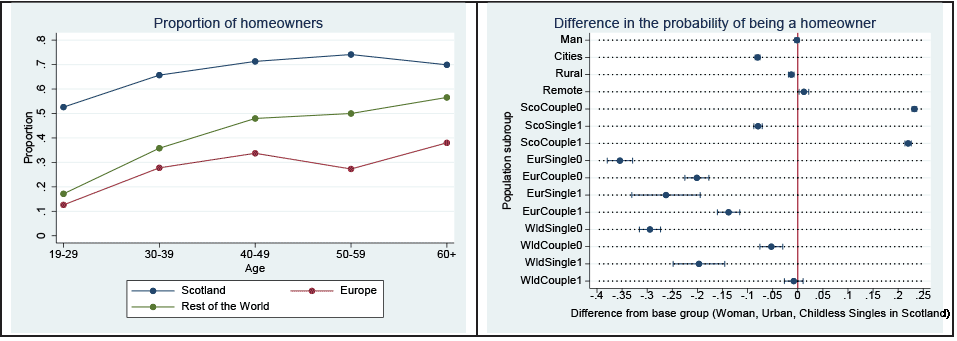
Source: The 2011 census microdata
The census data also provide information on the number of persons per room for each household as a measure of (over)crowdedness. Two categories can be distinguished: individuals living in households with less than 0.5 persons per room and those with more than 0.5 persons per room. About 54% of Scotland’s population belong to the former and 46% to the latter category. The proportion of individuals living in a household with more than 0.5 persons per room is the largest among the 19-29 age group and it declines by age as expected (Figure 4). Migrants from Europe and the rest of the world have a slightly higher share of individuals living in households with more than 0.5 persons per room (or less space per person) than the Scottish-born population. In terms of family type, couples with children have less space per person than other families for all three groups.
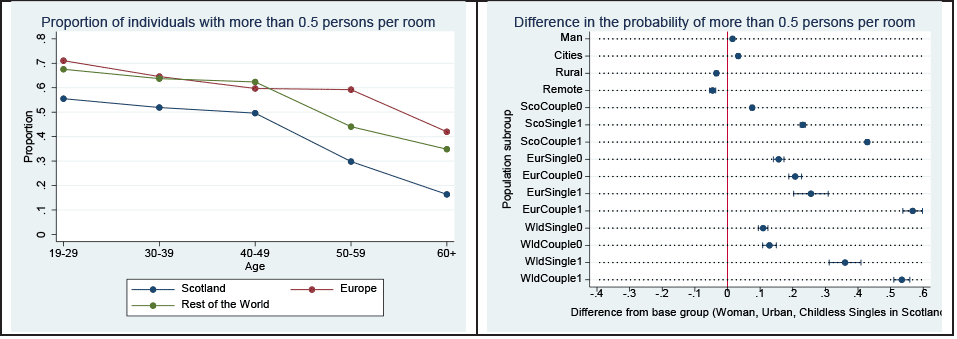
Source: The 2011 census microdata
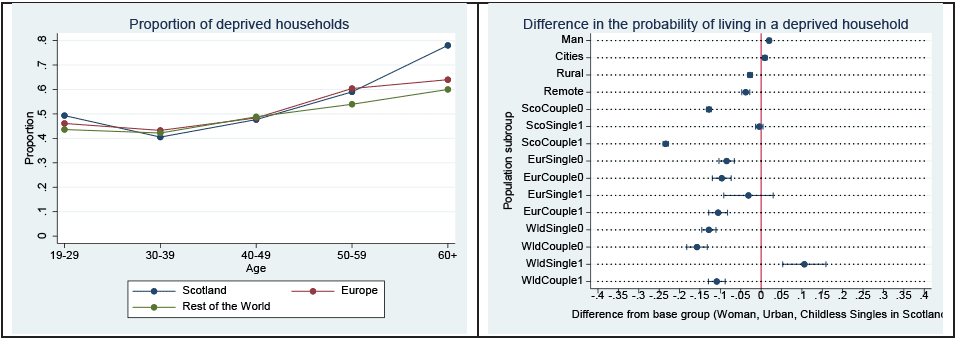
Finally, the share of deprived households is used to compare migrant families with non-migrants in Scotland. Deprivation is a summary measure, based on census data; according to this measure, a household can be deprived in any of the following four dimensions: employment, education, health and disability, housing. Although a high deprivation score should not be interpreted as a direct indicator of poverty, the measure still highlights households that face socio-economic challenges and potential issues.[4] The proportion of individuals living in deprived households increases by age (Figure 12). This pattern is largely driven by poorer health and housing conditions (e.g. the lack
of central heating) among the older population compared to younger people. Lower qualifications among older people may also play a role. There seems to be no significant difference between migrants and non-migrants in Scotland in the deprivation score, despite migrants having slightly poorer housing conditions in terms of space. A closer look at the patterns reveals that all migrant groups have lower deprivation levels in the youngest (19-29) and oldest age groups (60+); although on average, this group has a lower share of deprived individuals than the Scottish-born population.
Previous EAG analysis has shown that migrants have a larger share of individuals with degrees, and they are more likely to be in employment and have better health (EAG 2021). However, as we have seen, they have slightly poorer housing conditions. Deprivation patterns vary across family type. The differences are the smallest among European immigrants, whereas they are larger among Scottish-born population and immigrants from the rest of the world. It is notable that single-parent migrants from the rest of the world exhibit the highest deprivation levels. Clearly, this pattern of disadvantage among single-parent migrant families’ needs attention and also further investigation, including establishing whether this finding is related to specific groups (e.g. asylum-seekers and refugees) and/or dimensions (e.g. unemployment, poor housing conditions).
Source: The 2011 census microdata
2. Distribution of migrant families across urban and rural Scotland
In this section we examine available statistical evidence on patterns of overseas migration of families and young people into different parts of Scotland. Understanding the distribution of families across parts of Scotland is important, given the particular challenges faced by rural and remote areas. In previous reports we have drawn attention to the fact that remote rural areas exhibit both the most negative demographic trends, and the strongest ageing processes (EAG 2019). The explanation lies in long established age selective out-migration dynamics, which have reduced the capacity for natural increase. In-migration (both domestic and international), with a particular focus upon young people and families, is a crucial part of mitigating this negative cycle. Unfortunately, the stand-out finding is that overseas migration of young people and families is disproportionately focused upon the cities, and that remote rural areas, where the need is greatest, receive relatively smaller numbers of migrant families.
The most comprehensive source of data on overseas migrants is still the 2011 Census, which allows us to analyse urban and rural patterns. Using data-zone data aggregated to the 2016 Scottish Government urban/rural classificationit is possible to show (Table 2) that in the larger cities 113 persons per 1,000 head of population had been born outside the UK. In small towns and rural areas the ratio was much lower, generally below 45 per 1,000. It is worth noting that the
data shown in Table 2 excludes students living in halls of residence. If it were possible to include overseas students living in such accommodation this would likely increase the contrast between city and small town/rural Scotland.
| Per 1,000 head of population | One-Person Household (HH) | Multi-Person HH Without Children | Multi-Person HH With Children | Student HH | Other Multi-Person HH | Total Migrant HH |
|---|---|---|---|---|---|---|
| Large Urban Areas | 17.44 | 32.32 | 44.79 | 11.39 | 7.38 | 113.33 |
| Other Urban Areas | 5.34 | 14.64 | 20.87 | 1.47 | 2.11 | 44.44 |
| Accessible Small Towns | 4.65 | 14.31 | 20.31 | 0.19 | 1.05 | 40.51 |
| Remote Small Towns | 5.62 | 16.54 | 21.93 | 0.28 | 2.48 | 46.85 |
| Very Remote Small Towns | 6.30 | 15.11 | 17.40 | 0.22 | 2.66 | 41.69 |
| Accessible Rural Areas | 4.68 | 16.04 | 18.76 | 0.28 | 1.14 | 40.91 |
| Remote Rural Areas | 5.29 | 18.45 | 17.92 | 0.22 | 1.65 | 43.52 |
| Very Remote Rural Areas | 6.20 | 16.97 | 15.01 | 0.16 | 1.68 | 40.02 |
| Scotland | 9.36 | 21.00 | 28.43 | 4.48 | 3.69 | 66.95 |
Source: 2011 Census Table LC 2409SC, aggregated to eightfold Scottish Government urban/rural classification2016
Notes: These data include only people living in households; those living in communal accommodation (including student halls of residence) are excluded. Same-sex civil partnerships included in column two.
Disaggregation of the population into different types and sizes of household reveals that in the cities the highest ratio (almost 45 per 1,000) was among multi-person households with children (married couples, co-habitees, and single-parent households). Multi-person households without children accounted for another 32 per 1,000, and single person households for 17 per 1,000. Persons born outside the UK in all-student households accounted for just over 11 per thousand.
It is striking that in the Other Urban Areas and the Small Towns the incidence of families (multi-person households with/without children) were consistently about half those in the large cities, and those for students were considerably lower. In the remote rural and very remote rural parts of Scotland the incidence of migrant multi-person families was even lower, and those without dependent children outnumbered those with.
The 2011 Census also provides data on the age of arrival of all persons born outside the UK, expressed as a proportion of the total population (Figure 6). These data relate to the entire population (not only those living in households), and show very clearly the different order of magnitude of in-migration to the large cities compared with the rest of Scotland. Figure 6 reveals more clearly the importance of student migration to University cities – more than 45 persons per thousand, born outside the UK, arrived when they were between the ages of 16 and 24.
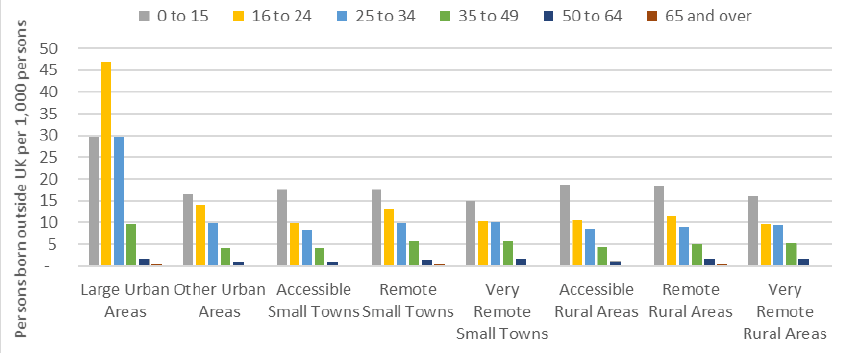
Source: 2011 Census Table LC 2802SC, aggregated to eightfold Scottish Government Urban/rural classification2016
The striking thing about the parts of the graph representing the other seven urban/rural categories is the similarity of the age of arrival profiles. Those arriving as children (0-15) are consistently the largest group, with each successive age group accounting for smaller numbers. This underlines the importance that families play in migration outside the large urban areas of Scotland. However, the overall incidence of migrants within the population is consistently about half that of the large cities. Numbers are particularly low in the very remote small towns and very remote rural areas, and slightly higher in the accessible small towns, accessible rural, and remote rural areas. While such small differences should not be over-interpreted, they may reflect employment opportunities and perceptions of the challenges of integration within very small communities. Whatever the explanation, it is worth noting again that such areas are exactly those in which family migration could have the greatest impact upon age structures and demographic sustainability.
More recent data is available from National Records of Scotland, although this is not broken down by urban/rural categories. This data shows us the age profile of in, out, and net migration during the five years 2014-15 to 2018-19[5]. During this (pre-COVID) period, children (0-15) accounted for around 14% of (overseas) in-migrants and 13% of out-migrants. It is not really possible to estimate the number of families from this, but if we assume that each child is accompanied by at least one parent this perhaps suggests that at least one third of all migrants arrive as part of a family.
Expressed as a ratio to the total child population of Scotland (Figure 7), overseas in-migrant children account for roughly 6 per 1,000. Net migration of children equates to roughly 2.5 per 1,000. The number of migrants increases dramatically in the 16-24 age group – in-migrant numbers peaking at 2,500 per year, at age 23, and out-migrant numbers at about 1,100 at 26. It seems reasonable to assume that this is primarily the effect of student migration, but may also be employment-related. Expressed as a share of the total population, the in-migrant peak is 37 per 1,000, and that of out-migrants is (less than) half of that, at 17. Net migration has two peaks, at 19 years (24 per 1,000) and 23 (20 per 1,000). There is a long ‘tail’ through the older age cohorts, net migration turning negative at around 60 years.
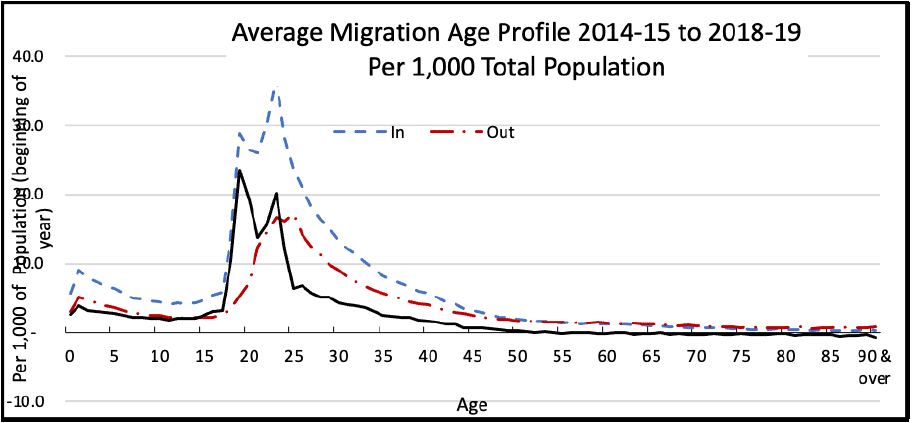
Source: NRS Spreadsheet: Migration between Scotland and overseas by age
There are two sources which can give us some indirect impressions of the differential impact of recent migration across Scotland. They relate to the number of applications to the EU Settlement Scheme (EUSS) (Table 3), and the number of births to mothers born outside the UK (Table 4). Both of these are based on Council Area data, which we have aggregated to the RESAS urban-rural classification.
Approximately 14% of EUSS applications between August 2018 and December 2019 related to children under 18 (Table 3). This is very similar to the proportion of children (under 16) in Figure 7. This equates to just over 18 applications per 1,000 persons in the 0-18 cohort of the population. The ‘incidence’ of EUSS applications (for both children and adults) is substantially higher in the larger cities (36 per 1,000 for children) than in other parts of Scotland. In the ‘urban with substantial rural’ council areas (across the Central Belt), the ratio falls to about 12 per 1,000, whilst in Mainly Rural Council Areas it is just under 14. The lowest ratio (less than 9) is found in the Islands and Remote Rural areas.
| EUSS applications per 1,000 | % of EUSS applications | ||||||
|---|---|---|---|---|---|---|---|
| Under 18 | 18 to 64 | 65+ | Total | Under 18 | 18 to 64 | 65+ | |
| Larger Cities | 35.57 | 60.74 | 5.07 | 48.21 | 12.72 | 85.67 | 1.55 |
| Urban with Substantial Rural | 11.74 | 19.29 | 1.72 | 14.38 | 16.22 | 81.46 | 2.32 |
| Mainly Rural | 13.98 | 25.60 | 2.17 | 18.13 | 14.67 | 82.60 | 2.69 |
| Islands and Remote Rural | 8.55 | 18.98 | 2.56 | 13.06 | 11.65 | 83.50 | 4.85 |
| Scotland | 18.36 | 33.66 | 2.61 | 24.86 | 13.92 | 84.01 | 2.00 |
Source: NRS Spreadsheet Local Area Migration: EUSS by Age Group and NRS mid-year population estimates
The vital events data (Table 4) suggests a similar pattern. 32% live births in the larger cities are to mothers born outside the UK. In the two ‘mixed’ groups of Council Areas the percentage falls
to about 11%, and in the Remote Rural and Islands to less than 10%. Interestingly, in the Larger Cities non-EU born mothers account for a substantially larger share, whilst elsewhere in Scotland the EU is the more common birthplace for mothers born outside the UK. This is likely to reflect the fact that EU migrants were more evenly distributed across all parts of Scotland, including rural areas (EAG 2019). This contrasts with non-EU migrants, most of whom entered through Tier 2 or Tier 4 (skilled migrant and student routes), and were thus more likely to settle in urban areas where higher-skilled jobs and universities were located. It supports earlier EAG findings that skills and income thresholds are likely to lead to a concentration of migrants (and their families) in urban areas (EAG 2019).
| % of live births | |||
|---|---|---|---|
| EU | Non-EU | Total overseas | |
| Larger Cities | 12.49 | 19.95 | 32.44 |
| Urban with Substantial Rural | 5.96 | 5.11 | 11.07 |
| Mainly Rural | 7.33 | 4.18 | 11.51 |
| Islands and Remote Rural | 5.17 | 4.52 | 9.69 |
| Scotland | 8.25 | 9.29 | 17.54 |
The above analysis suggests that family migration from overseas has been, in recent years, a significant contributor to Scotland’s demographic sustainability, though it is not easy to distinguish it from the apparently much larger effect of migration for higher education. The evidence suggests that family migration has been disproportionately focused on the Larger Cities and Central Belt, and that its contribution to slowing decline in rural areas, especially remote and island areas, is relatively weaker.
3. Comparing migrant households in Scotland and the UK
We now draw on survey data to explore in more detail the characteristics of migrant households in Scotland and the UK. In line with the definition of migrant families in the Introduction, we take a migrant household to be one where at least one of the adults within the household was born outside the UK. A tighter definition would require all adults to be foreign-born. As we shall see, this latter category covers a much smaller group than does the looser definition.
Most quantitative analysis of the impact of migration on the UK economy uses either the Labour Force Survey (LFS) or the Annual Population Survey (APS). These are regular quasi-panel studies that collect information on country of birth and year of entry to the UK. Most researchers use the individual version of the APS. However, it is a household survey which collects information on all household members within the sample. The APS household files also contain household rather than individual weights to ensure that household population aggregates are reproduced by the dataset. We use the APS to provide some estimates of broad aspects of the population of migrant households within the UK.
What household information can be gleaned from this data source? What follows is drawn from a combination of the 2018 and 2019 APS data files. Together, they comprise 654,613 individual
records of which 86,057 relate to residents in Scotland (the Scottish data is over-sampled). Within the Scottish sample, 5,594 individuals were born outside the UK. In the rest of the UK (rUK), there were 68,421 whose birthplace was outside the UK. Around 11% of those responding to the APS in the rest of the UK were foreign-born, whereas only 6.5% of respondents resident in Scotland were born outside the UK. The APS suggests that Scotland has a much smaller proportion of foreign-born residents than is the case in rUK.
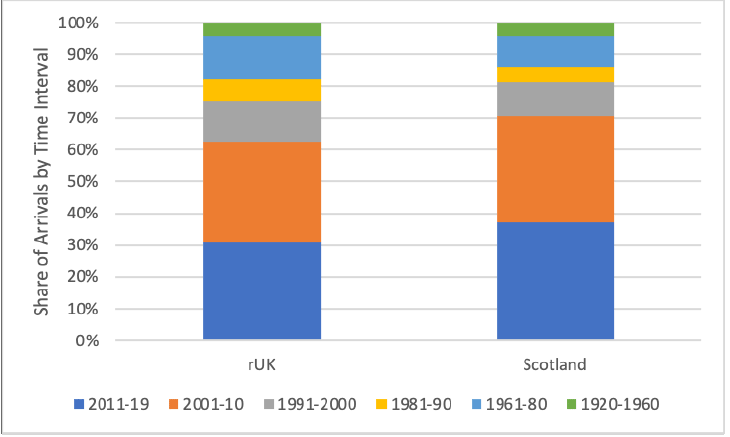
Figure 8 uses the APS to show when migrants arrived in Scotland and in the rest of the UK (rUK). Migration from the rest of the world into Scotland was more concentrated in recent years compared to migration into rUK. More than 70% of those born overseas arrived in Scotland between 2000 and 2019, while only 60% of those moving to rUK did so over this period.
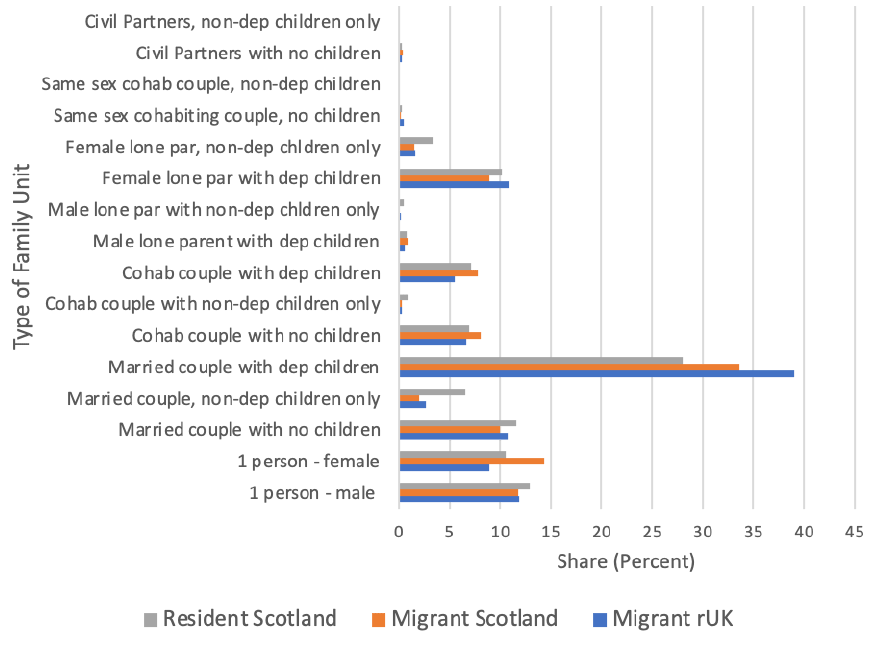
The APS also contains information on households and families. Households may comprise more than one family unit. Households share some living accommodation, but more than one family can exist within a household if they are largely economically independent of each other. Figure 9 compares the distribution of native-born and migrants to Scotland and migrants to rUK by type of family unit. Reflecting the concentration of migration to Scotland since 2000, we define migrant households from the APS dataset as those where the person responsible for the accommodation (the household reference person, or HRP) has come to the UK since 2000. This person was aged between 24 and 57 in 95% of cases. We constructed comparator groups of resident Scottish and rUK households by similarly restricting the age of the person responsible for the accommodation in rUK to between 24 and 57.
It is evident that there are no substantial differences in the distribution of types of family unit between migrants to Scotland, migrants to rUK and the Scottish resident population. Migrant family units in Scotland are somewhat more likely to have dependent children than non-migrant residents, but less likely than migrants to other parts of the UK. Family units comprising single females are more likely to be migrants to Scotland than the resident population or migrants to other parts of the UK. Overall, aside from these relatively small differences that may not be statistically significant, it appears that the types of family established by migrants coming to Scotland does not differ substantially from that of the resident population, nor that of residents coming to other parts of the UK.
Summary
- According to survey data, 60% of migrants in Scotland live in families – in a union and/or with children. This is higher than the proportion for the Scottish-born population, reflecting the younger age structure of migrants.
- Migrants in Scotland are significantly less likely to own their own homes, and also enjoy less space than the Scottish-born population. The tendency to rent, rather than purchase, a home is likely to reflect uncertainty over length of stay, and lack of familiarity with the UK housing market.
- However, migrants in the younger and older age groups have slightly lower deprivation levels, because of good education, high activity rates and good health. By contrast, single-parent non-EU migrants with children have relatively high derivation, a pattern of disadvantage that warrants further analysis.
- Families are more than twice as likely to move to cities in Scotland, compared to rural and remote areas – indeed, family migration has been disproportionately focused on the Larger Cities and Central Belt. This means that the contribution of family migration to slowing population decline in rural areas, especially remote and island areas, is relatively weaker.
- However, while most non-UK births in Scottish cities are from non-EU born families, in rural areas, EU-born mothers account for a larger share of births. This reflects patterns of settlement by EU migrants, with the more flexible free movement rules encouraging migration across all parts of Scotland.
- Comparing family migrants to Scotland and rUK since 2000, we find no substantial differences in types of family unit. Migrant families in Scotland are somewhat less likely to have dependent children than migrants in other parts of the UK, but the difference is not great. Moreover, the types of families established by migrants coming to Scotland does not differ substantially from that of the resident population.
Contact
Email: population@gov.scot