Ethnicity in the Justice System
This paper presents a review of quantitative evidence relating to ethnicity in the justice system in Scotland.
4. Patterns of offending and the justice system response
4.1 Introduction
In this chapter a range of findings are presented on patterns of offending and the justice system response. The data is drawn from a variety of sources and includes police activity, offender management and court outcomes, characteristics of perpetrators of hate crime, criminal court cases, prison statistics and justice social work statistics.
4.2 Key findings
- In 2021/22, the vast majority of stop and searches were conducted on people identifying as White Scottish/White Other British.
- Between 2017/18 and 2021/22, the proportion of stop and searches being carried out on minority ethnic individuals has remained fairly stable.
- In 2021/22, the vast majority of use of force incidents related to subjects who identify as White Scottish/White Other British.
- In 2021/22, the vast majority of Taser use was on subjects who identify as White Scottish/White Other British.
- Racial crime remains most commonly reported form of hate crime to the Procurator Fiscal. The numbers of charges have fluctuated in recent years but are currently lower than the peak in such charges in 2011/12.
- The ethnicity of the prison population has been largely unchanged over the past ten years. In 2021/22, 94.9% of the average daily prison population self-identified as White.
- In 2019/20, it was estimated that the incarceration rate for people who identify as African, Caribbean or Black, or from Other ethnic groups was significantly higher than for people who identify as White.
4.3 Police activity
Stop and Search
As defined by Police Scotland, “a stop and search is one conducted by a police officer in the course of their duties where a person who is not in police custody is searched using a specific statutory provision or in accordance with a search warrant issued by a court in Scotland.”[10]
The Code of Practice on the Exercise by Constables of Powers of Stop and Search of the Person in Scotland came into effect on 11 May 2017[11]. The National Stop and Search Database was upgraded to coincide with the introduction of the Code. Due to these database changes it is not possible to make historical comparisons with data before 2017.
In 2021/22, 30,807 stop and searches were carried out in Scotland[12]. The vast majority of stop and searches were conducted on people identifying as White Scottish/White Other British (91.3%)[13]. A further 3.1% were for those who identified as White Minority Ethnic[14], 1.8% who identified as Asian[15], 1.2% who identified as African, Caribbean or Black[16], 0.8% as Mixed or Multiple ethnicity, 0.7% as Other[17]. Ethnicity was not provided or unknown in 1.2% of cases.
Table 4.1, shows that the proportion of stop and searches being carried out on minority ethnic groups has remained fairly stable over the last five years. 2017/18, the year that the stop and search code of practice came into practice, shows the largest proportion of “not provided or unknown” ethnicity at 8.1%. This decreased sharply to 2.3% in 2018/19, and then continued to further decrease over time to 1.2% in 2021/22.
| Ethnicity | 2017/18 | 2018/19 | 2019/20 | 2020/21 | 2021/22 |
|---|---|---|---|---|---|
| White Scottish / White Other British | 83.4% | 89.4% | 90.3% | 90.4% | 91.3% |
| White Minority Ethnic | 3.4% | 3.8% | 3.3% | 3.4% | 3.1% |
| Mixed or Multiple | 0.5% | 0.6% | 0.7% | 0.6% | 0.8% |
| Asian | 2.2% | 2% | 2% | 2.4% | 1.8% |
| African, Caribbean or Black | 1.3% | 1.3% | 1.5% | 1.4% | 1.2% |
| Other | 0.9% | 0.6% | 0.6% | 0.5% | 0.7% |
| Not Provided/Unknown | 8.1% | 2.3% | 1.7% | 1.4% | 1.2% |
Positive searches
Police Scotland define a positive stop and search as “when an item is recovered where possession of same implies criminality on the part of the person being searched or any other or where an item has been recovered which is potentially harmful.”[18]
Table 4.2 shows that, in 2021/22, the overall positive search rate was around one third (34.7%). The overall proportion of positive searches has remained relatively stable over time, varying from 34.7% in 2021/22, to a high of 38.8% in 2018/19[19]
In 2021/22, the positive search rate was similar across most ethnic groups (34.4% for White Scottish/White Other British, 33.9% for White Minority Ethnic, 34.7% for Other, and 34.6% where ethnicity was unknown). The positive search rate was higher for those who identified as African, Caribbean or Black (40.3%) or identified as Asian (42%). These figures have not been tested to determine whether or not these differences are statistically significant.
The positive search rate for those identifying as Asian has been higher than the overall positive search rate since 2018/19. Whilst there was a higher positive search rate for those who identify as African, Caribbean or Black than the overall positive search rate in 2021/22, in 2017/18 and 2018/19, those identifying as African, Caribbean or Black had lower positive search rates than the overall search rate.
| Ethnicity | 2017/18 | 2018/19 | 2019/20 | 2020/21 | 2021/22 |
|---|---|---|---|---|---|
| White Scottish / White Other British | 38.1% | 39.3% | 35.8% | 34.7% | 34.4% |
| White Minority Ethnic | 36.0% | 36.5% | 37.1% | 34.4% | 33.9% |
| Mixed or Multiple | 34.6% | 33.2% | 35.3% | 37.5% | 44.6% |
| Asian | 34.3% | 40.4% | 45.1% | 40.9% | 42% |
| African, Caribbean or Black | 34.4% | 37.6% | 39.8% | 35.7% | 40.3% |
| Other | 30.6% | 33.9% | 34.2% | 46.1% | 34.7% |
| Not Provided/Unknown | 27.2% | 27% | 33.1% | 28.4% | 34.6% |
| Overall | 36.9% | 38.8% | 36% | 34.8% | 34.7% |
Use of force
Use of force is defined as “any physical use of force, except compliant handcuffing and come along hold / escort hold”.[20] Police officers complete a “use of force form” following an incident where the use of force is applied. A single use of force form can be used to record more than one use of force during an incident, and can be used to record details of multiple subjects. Use of force only occurs in a very small proportion of incidents. In 2021/22, use of force forms were submitted in 0.36% of incidents (5,284 use of force forms forms out of a total of 1,469,488 incidents recorded by Police Scotland).
Quarterly reporting data on ethnicity and use of force is available from 2021/22 onwards[21]. An individual's ethnicity is determined by the subject and not by officers. Table 4.3 shows that, in 2021/22, the vast majority of use of force forms were submitted in relation to individuals who identified as White Scottish/White Other British (91.9%)[22]. This is followed by those who identified as White Minority Ethnic (3.4%), African, Caribbean or Black (1.6%), and Asian (0.8%).
| Victim ethnicity | % |
|---|---|
| White Scottish / White Other British[23] | 91.9% |
| White Minority Ethnic[24] | 3.4% |
| Mixed or Multiple | 0.4% |
| Asian[25] | 0.8% |
| African, Caribbean or Black[26] | 1.6% |
| Other[27] | 0.6% |
| Unknown | 1.3% |
Use of Tasers
Tasers use an electrical current to temporarily incapacitate a person. They were first used by Police Scotland in June 2018. They are only used by officers who have received specialised training and in situations where they need to deal with violent or dangerous individuals at a distance. Taser deployment forms are completed by officers after each use of a Taser, and include information on the ethnicity[28] of the subject.
In 2021/22, Tasers were used[29] 417 times on 403 subjects. Only on 60 of these occasions was the Taser fired.
Table 4.4 shows that in 2021/22, where ethnicity is known, the vast majority of use of Tasers is on subjects who identify as White British (95.5%)[30]. There were eighteen uses of a Taser on those who did not identify as White British. This consisted of eight occasions where the subject identified White Minority Ethnic, five occasions where they identified as Asian, three occasions where they identified as African, Caribbean or Black, and two occasions were the subject identified as being from a mixed ethnic group.
| Ethnicity | Number | % |
|---|---|---|
| White British | 379 | 95.5% |
| White Minority Ethnic[31] | 8 | 2.0% |
| Mixed[32] | 2 | 0.5% |
| Asian[33] | 5 (consisting of: Asian Pakistani 1, Any other Asian background 4) | 1.3% |
| African, Caribbean or Black[34] | 3 (consisting of: African 2, Any other Black background 1) | 0.8% |
| Other | 0 | 0% |
4.4 Prosecution response to race hate crimes
Charges for racially aggravated crime
The Crown Office and Procurator Fiscal Service (COPFS) publish annual statistics of hate crime reported to the Procurator Fiscal in Scotland. The figures relate to the number of charges reported rather than the number of individuals charged or the number of incidents that gave rise to such charges. Where a charge has more than one hate crime aggravation, it is included in the overall figures for each type of hate crime into which it falls.
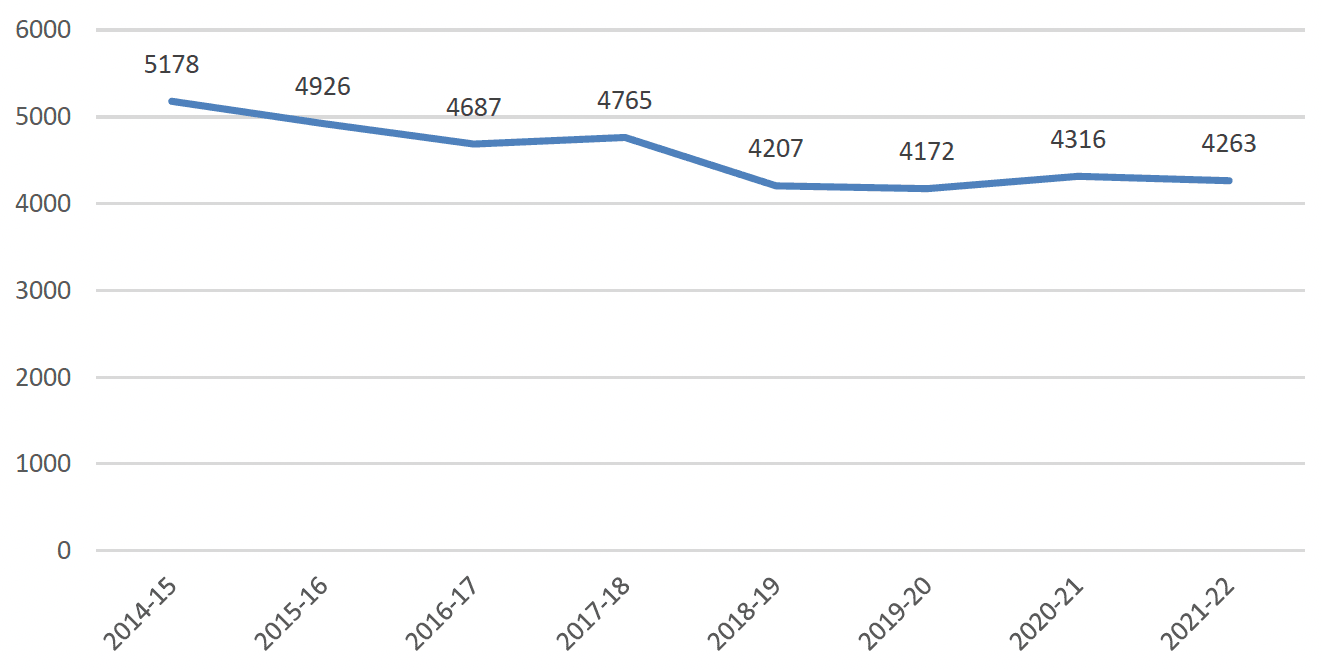
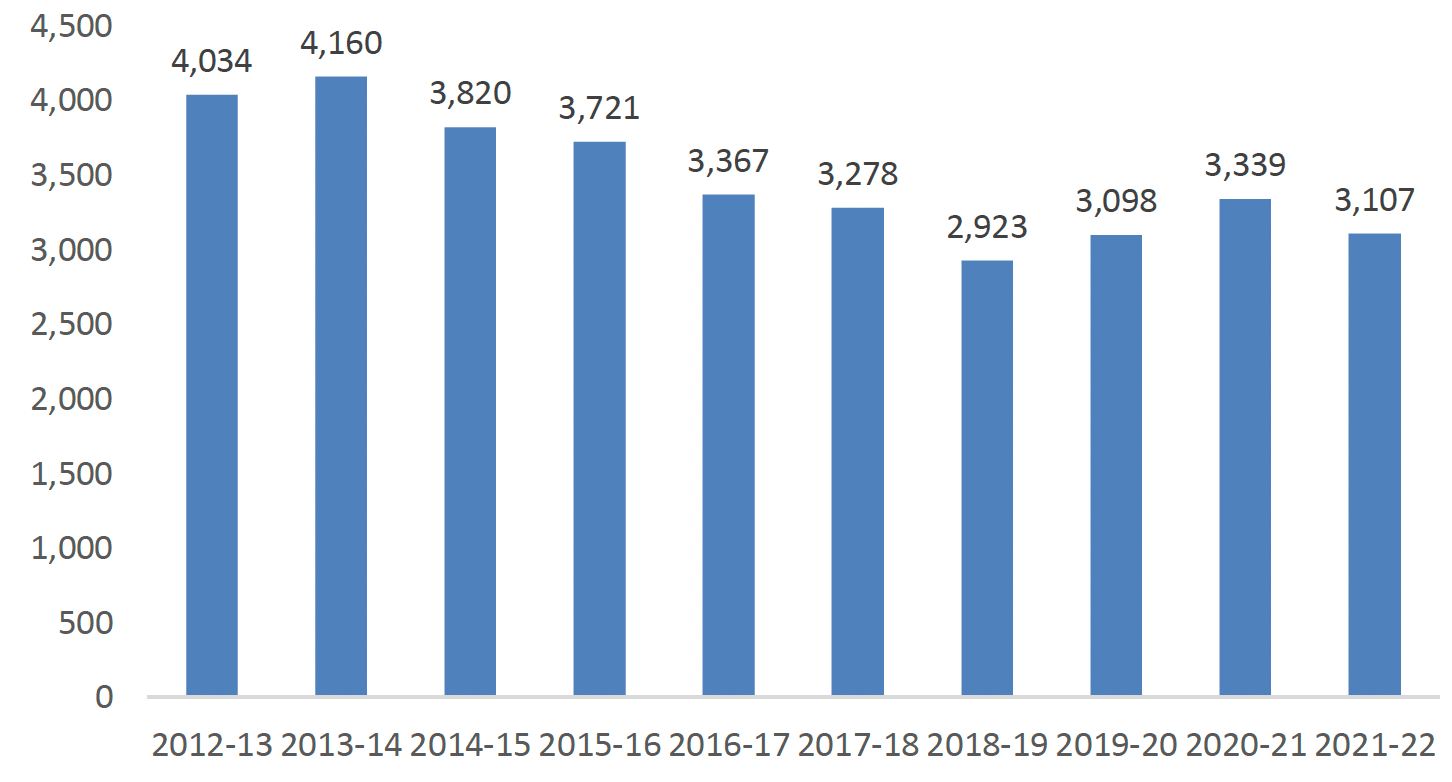
Racial crime remains the hate crime most commonly reported to the Procurator Fiscal in Scotland. In total, 3,107 charges relating to race crime were reported in 2021-22, a decrease of 7% compared to 2020-21 (Figure 4.1). The number of charges of racial hate crime have fluctuated in recent years.
Source: Hate Crime in Scotland, 2021-22
In 2021-22, around one third (1,076) of race hate crime charges specifically relate to the charge of racially aggravated harassment and behaviour. In order to prove any substantive racially aggravated harassment charge, two sources of evidence are required. Around two thirds (2,031) of race hate charges related to another offence (for instance, threatening or abusive behaviour, or assault) with a racial aggravation. Evidence from a single source is sufficient to prove a racial aggravation which is attached to another substantive charge libelled.
The proportion of charges that specifically relate to the charge of racially aggravated harassment and behaviour has fallen steadily over recent years, from 59% in 2012- 13 to 35% in 2021-22 (Figure 4.2). There has been a corresponding increase in the proportion of charges relating to other offences with a racial aggravation.
Source: Hate Crime in Scotland, 2021-22
Court proceedings for racially aggravated crime
The proportion of racial hate crime charges leading to court proceedings has remained fairly stable over time, with the vast majority of cases leading to court proceedings. Court proceedings were commenced in respect of 82% of racial hate charges in 2021-22. A further 9% of charges were incorporated into other charges for the same accused which were prosecuted. In total, 91% of charges reported in 2021-22 led to court proceedings.
In 4% of cases direct measures were used, these include fiscal fines, fiscal compensation orders, fiscal work orders, warning letters and referral to diversion from prosecution schemes. In 2% of cases a referral was made to the Children’s Reporter.
In only 2% of cases was no further action taken. Reasons for no action being taken included: insufficient admissible evidence (29 charges); it not being a crime (2 charges); further action would be disproportionate (3 charges); mitigating circumstances (3 charges) and other (15 charges).
The proportion of hate crime charges resulting in no action being taken has remained fairly stable, ranging from a low of 2% in 2021-22, to 5% in 2012-13, and consistently being around 3% to 4%.
Convictions for racially aggravated crime
The Scottish Government statistics publication, Criminal proceedings in Scotland, 2020-21, includes information on the aggravation codes recorded by Police Scotland or the Crown Office and Procurator Fiscal Service to provide additional information relating to the nature of a charge.
In 2020-21, 349 people were convicted for crimes with a racial aggravation recorded against the ‘main charge’[35] (Figure 4.3). Racial aggravation was the second most common aggravation recorded against a main charge, after domestic abuse. The number of people convicted with a racial aggravation against the main charge were 42% lower than 2019-20, and were also at their lowest level in the past 10 years.
The 2020-21 figures cover the first full year of the COVID-19 pandemic during which court closures and social distancing requirements resulted in substantial reductions in the number of cases proceeding and concluded in court. As such it is reasonable to conclude that the latest data is predominantly a reflection of the impact of the pandemic across the justice system, and should not be interpreted as indicative of longer-term trends.
Of those convicted for a crime with a racial aggravation against the main charge, the most common crime type was breach of the peace etc. which accounted for 288 out of the 349 convictions for crimes with a racial aggravation.
Source: Criminal Proceedings in Scotland, 2020-21
Note: Data for 2020-21 are affected by the pandemic and subsequent court closures and should not be considered indicative of long term trends.
4.5 Offender characteristics for perpetrators of hate crime
This section presents findings on the characteristics of those who are perpetrators of hate crime. Information presented here comes from three main sources: studies into the characteristics of police recorded hate crime in Scotland, statistics on hate crime reported to the Procurator Fiscal in Scotland published by the Crown Office and Procurator Fiscal Service, and Criminal Proceedings in Scotland statistics.
The Scottish Government has completed two “deep dive” studies into the characteristics of police recorded hate crime in Scotland. The first study analysed data from 2018-19 and the second follow up study covered 2020-21. More detail on these reports and information on the victims of these hate crimes is covered in chapter 3 of this report.
Characteristics of racially aggravated hate crimes perpetrators
The second hate crime deep dive study found that, in 2020-21, the majority of racially aggravated hate crimes had a male or all male group of perpetrators, representing almost three quarters (75%) of crimes. The average age of a perpetrator was 33 years old. Where information was available on the ethnicity of perpetrators, around nine in ten (89%) of racially aggravated hate crimes had a perpetrator of White Scottish / White Other British ethnicity. 4% of perpetrators were White Minority Ethnic and 3% were Asian.
Crown Office and Procurator Fiscal Service hate crime statistics show that in 2021/22, out of 3,107 racial hate crime charges where the sex of the accused was known, a male was accused in 73% of cases and a female was accused in 27% of cases. Over a third (35%) of those accused of a racial hate crime were aged over 40, just over a quarter were aged 31-40 or 21 – 30 (27% and 26% respectively). Younger age groups 18 – 20 and under-18 each made up 6% of those accused of a racial hate crime.
Criminal proceedings in Scotland data show that the majority of people convicted for crimes with a racial aggravation over the last ten years are male (Figure 4.4). In 2020-21, of the 349 people convicted for crimes with a racial aggravation, 301 of those convicted were male and 48 were female.
Source: Criminal Proceedings in Scotland, 2020-21
Note: Data for 2020-21 are affected by the pandemic and subsequent court closures and should not be considered indicative of long term trends.
Ethnicity of perpetrators for other hate crime aggravators
The second hate crime deep dive study found that, where the ethnicity of perpetrators of non-racial hate crimes is known, the vast majority are White Scottish/Other White British, consistently between 90% and 96% of perpetrators.
Where information was available on the ethnicity of perpetrators of disability aggravated hate crimes, the vast majority (95%) of crimes had a perpetrator of White Scottish/White Other British ethnicity. 4% of perpetrators were White Minority Ethnic.
Where information was available on the ethnicity of perpetrators of religion aggravated hate crimes, the vast majority (90%) had a perpetrator of White Scottish/White Other British ethnicity. 4% of perpetrators were Asian. All other ethnic groups accounted for the remaining 6% of perpetrators.
Where information was available on the ethnicity of perpetrators of sexual orientation aggravated hate crimes, the vast majority (93%) had a perpetrator of White Scottish/White Other British ethnicity. All other ethnic groups accounted for the remaining 7% of perpetrators.
Where information was available on the ethnicity of perpetrators of transgender identity aggravated hate crimes, the vast majority (96%) had a perpetrator of White Scottish/White Other British ethnicity. All other ethnic groups accounted for the remaining 4% of perpetrators.
4.6 Criminal court cases registered
In 2021/22, 85,567 criminal court cases (not including petitions) were registered in all courts in Scotland. The High Court hears the most serious criminal cases, such as murder and rape. In 2021/22, there were 745 indictments registered at the High Court. The majority of cases are dealt with in Sheriff Courts. Justice of the peace courts deal with the less serious summary crimes, such as speeding, careless driving and breach of the peace.
Table 4.5 shows the ethnicity of the accused for cases registered in each type of court[36]. The ethnicity of accused individuals has remained fairly consistent since 2014/15. The vast majority of individuals appearing in all courts accused of a crime in each year were white.
Where ethnicity was known, White Scottish individuals were the single largest group. Other White British and Other White were the next two largest groups in every type of court. Where ethnicity was known, the percentage of individuals from other ethnic groups was in low single figures.
In 2021/22, the ethnicity of the accused was Unknown in between 8.8% and 24.1% of cases across the different courts. This may be because the information was not recorded or because the accused is a company rather than a person. The proportion of Unknown was highest in the justice of the peace courts which deal with the least serious offences.
Further analysis on ethnicity in the court system is available in the Occasional Paper: analysis of the ethnicity of individuals subject to hearings in Scottish courts.
| All Criminal courts (not including petitions[37]) (%) | ||||||||
|---|---|---|---|---|---|---|---|---|
| Accused ethnicity at case registration[38] | 2014/15 | 2015/16 | 2016/17 | 2017/18 | 2018/19 | 2019/20 | 2020/21 | 2021/22 |
| White Scottish | 61.8 | 61.9 | 61.3 | 60.9 | 60.0 | 60.8 | 64.5 | 62.2 |
| Other White British | 7.8 | 7.8 | 8.2 | 8.7 | 8.9 | 9.0 | 8.6 | 8.6 |
| Other White | 9.5 | 9.7 | 10.3 | 10.0 | 10.0 | 9.4 | 9.2 | 9.4 |
| African | 0.4 | 0.4 | 0.5 | 0.5 | 0.5 | 0.5 | 0.6 | 0.6 |
| Asian | 1.7 | 1.7 | 1.5 | 1.6 | 1.6 | 1.8 | 1.9 | 2.1 |
| Caribbean or Black | 0.5 | 0.6 | 0.5 | 0.6 | 0.7 | 0.7 | 0.8 | 0.8 |
| Mixed or multiple | 0.3 | 0.3 | 0.3 | 0.4 | 0.4 | 0.4 | 0.4 | 0.4 |
| Other ethnic group | 0.9 | 1.0 | 0.9 | 1.0 | 1.0 | 1.0 | 1.1 | 1.2 |
| Unknown | 17.1 | 16.6 | 16.5 | 16.3 | 17.1 | 16.4 | 12.9 | 14.7 |
| High Court - Indictments[39] (%) | ||||||||
|---|---|---|---|---|---|---|---|---|
| Accused ethnicity at case registration | 2014/15 | 2015/16 | 2016/17 | 2017/18 | 2018/19 | 2019/20 | 2020/21 | 2021/22 |
| White Scottish | 60.2 | 60.8 | 63.6 | 61.1 | 65.2 | 61.2 | 57.9 | 60.1 |
| Other White British | 10.4 | 9.9 | 8.4 | 8.8 | 8.7 | 9.5 | 12.3 | 9.4 |
| Other White | 8.8 | 8.1 | 8.4 | 8.9 | 7.4 | 7.9 | 8.0 | 8.5 |
| African | 0.5 | 0.6 | 0.9 | 0.8 | 0.8 | 1.0 | 0.7 | 1.1 |
| Asian | 2.0 | 2.1 | 2.2 | 1.5 | 1.8 | 2.1 | 3.1 | 3.4 |
| Caribbean or Black | 1.2 | 0.9 | 0.6 | 1.0 | 1.1 | 1.5 | 1.7 | 2.2 |
| Mixed or multiple | 0.2 | 0.3 | 0.4 | 0.4 | 0.4 | 1.0 | 0.6 | 0.5 |
| Other ethnic group | 0.8 | 1.1 | 0.9 | 2.0 | 1.1 | 1.3 | 1.7 | 0.9 |
| Unknown | 15.9 | 16.3 | 14.5 | 15.5 | 13.4 | 14.7 | 14.0 | 13.8 |
| Sheriff Court – Petitions (%) | ||||||||
|---|---|---|---|---|---|---|---|---|
| Accused ethnicity at case registration | 2014/15 | 2015/16 | 2016/17 | 2017/18 | 2018/19 | 2019/20 | 2020/21 | 2021/22 |
| White Scottish | 69.4 | 67.9 | 69.3 | 68.3 | 68.7 | 67.1 | 68.6 | 67.9 |
| Other White British | 7.6 | 8.1 | 8.5 | 9.1 | 8.9 | 9.3 | 8.2 | 8.6 |
| Other White | 10.0 | 10.5 | 9.7 | 8.5 | 8.4 | 9.0 | 9.3 | 9.1 |
| African | 0.5 | 0.6 | 0.6 | 0.6 | 0.7 | 0.5 | 0.7 | 0.9 |
| Asian | 1.6 | 1.8 | 1.3 | 1.7 | 1.7 | 1.9 | 2.1 | 2.1 |
| Caribbean or Black | 1.0 | 0.8 | 0.8 | 0.8 | 1.0 | 1.1 | 1.0 | 1.1 |
| Mixed or multiple | 0.2 | 0.5 | 0.3 | 0.3 | 0.4 | 0.6 | 0.3 | 0.5 |
| Other ethnic group | 1.0 | 0.9 | 0.8 | 1.0 | 0.8 | 1.1 | 1.0 | 1.1 |
| Unknown | 8.8 | 9.0 | 8.5 | 9.7 | 9.5 | 9.5 | 8.8 | 8.8 |
| Sheriff Court – Indictments (%) | ||||||||
|---|---|---|---|---|---|---|---|---|
| Accused ethnicity at case registration | 2014/15 | 2015/16 | 2016/17 | 2017/18 | 2018/19 | 2019/20 | 2020/21 | 2021/22 |
| White Scottish | 69.2 | 67.2 | 68.3 | 66.7 | 65.9 | 66.7 | 66.7 | 66.5 |
| Other White British | 7.8 | 7.8 | 7.8 | 8.4 | 7.9 | 8.7 | 8.9 | 8.5 |
| Other White | 7.7 | 8.7 | 9.2 | 8.5 | 7.4 | 8.1 | 8.3 | 9.1 |
| African | 0.4 | 0.4 | 0.5 | 0.5 | 0.5 | 0.5 | 0.4 | 0.7 |
| Asian | 1.6 | 1.3 | 1.3 | 1.5 | 1.4 | 1.9 | 1.5 | 1.6 |
| Caribbean or Black | 0.8 | 0.7 | 0.7 | 0.7 | 0.8 | 0.8 | 1.0 | 0.9 |
| Mixed or multiple | 0.4 | 0.3 | 0.4 | 0.4 | 0.3 | 0.5 | 0.4 | 0.4 |
| Other ethnic group | 0.7 | 0.7 | 0.5 | 1.0 | 0.7 | 0.9 | 1.0 | 0.8 |
| Unknown | 11.5 | 12.9 | 11.2 | 12.4 | 14.9 | 12.0 | 11.8 | 11.5 |
| Sheriff Court - Complaints[40] (%) | ||||||||
|---|---|---|---|---|---|---|---|---|
| Accused ethnicity at case registration | 2014/15 | 2015/16 | 2016/17 | 2017/18 | 2018/19 | 2019/20 | 2020/21 | 2021/22 |
| White Scottish | 65.0 | 65.1 | 65.2 | 65.3 | 64.1 | 65.3 | 67.1 | 66.2 |
| Other White British | 8.3 | 8.4 | 8.5 | 9.1 | 9.7 | 9.5 | 8.6 | 8.9 |
| Other White | 10.2 | 10.4 | 10.5 | 10.0 | 10.1 | 9.4 | 8.9 | 8.8 |
| African | 0.4 | 0.4 | 0.5 | 0.5 | 0.5 | 0.5 | 0.5 | 0.6 |
| Asian | 1.1 | 1.1 | 1.2 | 1.3 | 1.3 | 1.5 | 1.5 | 1.7 |
| Caribbean or Black | 0.4 | 0.5 | 0.5 | 0.6 | 0.7 | 0.7 | 0.7 | 0.8 |
| Mixed or multiple | 0.2 | 0.2 | 0.3 | 0.4 | 0.4 | 0.3 | 0.4 | 0.4 |
| Other ethnic group | 0.7 | 0.7 | 0.8 | 0.8 | 0.8 | 0.9 | 0.9 | 1.0 |
| Unknown | 13.6 | 13.2 | 12.5 | 11.9 | 12.5 | 11.9 | 11.5 | 11.4 |
| Sheriff Court - Domestic Abuse Complaints (%) | ||||||||
|---|---|---|---|---|---|---|---|---|
| Accused ethnicity at case registration | 2014/15 | 2015/16 | 2016/17 | 2017/18 | 2018/19 | 2019/20 | 2020/21 | 2021/22 |
| White Scottish | 65.8 | 65.2 | 63.9 | 63.8 | 63.1 | 64.3 | 65.8 | 65.1 |
| Other White British | 9.4 | 9.7 | 9.9 | 10.2 | 10.9 | 10.5 | 9.2 | 9.8 |
| Other White | 10.5 | 10.8 | 11.6 | 11.4 | 10.9 | 9.9 | 10.3 | 9.6 |
| African | 0.6 | 0.6 | 0.6 | 0.4 | 0.5 | 0.6 | 0.6 | 0.6 |
| Asian | 1.3 | 1.2 | 1.4 | 1.5 | 1.6 | 1.9 | 1.7 | 1.8 |
| Caribbean or Black | 0.4 | 0.6 | 0.4 | 0.7 | 0.6 | 0.7 | 0.6 | 0.8 |
| Mixed or multiple | 0.1 | 0.2 | 0.2 | 0.4 | 0.4 | 0.3 | 0.3 | 0.4 |
| Other ethnic group | 0.7 | 0.7 | 0.9 | 1.0 | 0.9 | 1.0 | 1.0 | 1.1 |
| Unknown | 11.1 | 11.0 | 11.0 | 10.6 | 11.1 | 10.9 | 10.5 | 10.9 |
| Justice of the Peace Courts - Complaints (%) | ||||||||
|---|---|---|---|---|---|---|---|---|
| Accused ethnicity at case registration | 2014/15 | 2015/16 | 2016/17 | 2017/18 | 2018/19 | 2019/20 | 2020/21 | 2021/22 |
| White Scottish | 57.1 | 56.7 | 53.0 | 52.1 | 51.7 | 50.4 | 55.4 | 50.8 |
| Other White British | 7.2 | 7.0 | 7.8 | 7.9 | 7.7 | 8.1 | 8.4 | 7.7 |
| Other White | 9.0 | 8.9 | 10.0 | 10.3 | 10.2 | 9.9 | 10.8 | 11.0 |
| African | 0.4 | 0.5 | 0.4 | 0.5 | 0.6 | 0.5 | 0.7 | 0.6 |
| Asian | 2.4 | 2.6 | 2.1 | 2.0 | 2.1 | 2.3 | 3.3 | 3.1 |
| Caribbean or Black | 0.5 | 0.6 | 0.5 | 0.5 | 0.6 | 0.6 | 0.8 | 0.7 |
| Mixed or multiple | 0.3 | 0.4 | 0.4 | 0.4 | 0.4 | 0.3 | 0.5 | 0.5 |
| Other ethnic group | 1.3 | 1.4 | 1.2 | 1.4 | 1.3 | 1.4 | 1.8 | 1.6 |
| Unknown | 21.8 | 22.0 | 24.6 | 24.9 | 25.4 | 26.6 | 18.2 | 24.1 |
4.7 Prison statistics
Average daily prison population
The average daily prison population in 2021-22 was 7,505. 94.9% of the average daily population self-identified as White, 1.9% as Asian, Asian Scottish or Asian British, 1.6% as African, Caribbean or Black, 0.4% as having Mixed or Multiple ethnicity, and 1.1% as belonging to an Other Ethnic Group (Table 4.6).
Over the past 13 years about 95-96% of the prison population has identified as White. The proportion of individuals who spent time in prison over the last 13 years and were minority ethnic (excluding white minority) was between 3.7% and 5.1%; broadly in line with the profile of the Scottish population as a whole (4% on census day 2011 and 7.1% in the 2022 census results).
| Ethnicity | 2009-10 | 2011-12 | 2013-14 | 2015-16 | 2017-18 | 2019-20 | 2021-22 |
|---|---|---|---|---|---|---|---|
| White | 95.5 | 96.1 | 96.3 | 96.2 | 96.4 | 95.9 | 94.9 |
| Asian, Asian Scottish or Asian British | 2.5 | 2 | 1.8 | 1.7 | 1.7 | 1.8 | 1.9 |
| African, Caribbean or Black | 1.5 | 1.4 | 1.3 | 1.4 | 1.2 | 1.2 | 1.6 |
| Other Ethnic Group | 0.2 | 0.2 | 0.3 | 0.4 | 0.4 | 0.8 | 1.1 |
| Mixed Or Multiple | 0.1 | 0.2 | 0.2 | 0.3 | 0.3 | 0.4 | 0.4 |
Source: Scottish Prison Population Statistics 2021-22
Figure 4.5 shows the number of prisoners from a minority ethnic (excluding white minority) background in more detail. The prison population data does show an increase in the numbers of individuals in the 'Mixed or Multiple' and 'Other Ethnic Group' categories on an average day over the last 13 years. While the absolute numbers are small, the size of these groups has quadrupled in the 13 year period examined. This is in the context of the number of individuals spending time in prison falling overall over the period.
Source: Scottish Prison Population Statistics 2021-22
Incarceration rates by ethnicity
As shown above, the number and proportion of prisoners from a minority ethnic (excluding white minority) group on an average day are low. In 2021-22, the incarceration rates of people spending any time in prison per 1,000 of the population were estimated[41]. This showed that the incarceration rate for White and Asian people fell between 2011-12 and 2019-20. For other groups, taking into account the uncertainty around national ethnic group population estimates (prior to the publication of the 2022 Census), there was no discernible change.
In 2021-22, it was estimated that the higher incarceration rate for people who identify as African, Caribbean or Black, (8.2 ± 1.6 per, 1,000), Mixed or Multiple ethnic groups (4.5 ± 1.0 per 1,000) or from Other ethnic groups (7.2 ± 1.4 per 1,000) was statistically significant compared to people who identify as White (3.2 ± 0.1 per 1,000). The relative lower rate for Asian, Asian Scottish Or Asian British (2.4 ± 0.3 per 1,000) was also statistically significant. Other factors that might lead to these differences, for example relative levels of deprivation and different age profiles across ethnicity groups, were not accounted for in this analysis.
The population rate of people identifying as White and as Asian, Asian Scottish or Asian British experiencing imprisonment each year has fallen over time to 3.2 per 1,000 and 2.4 per 1,000 respectively. This rate for ‘Other Ethnic Group’ members has increased, in particular since the low recorded level in 2017-18 of 3.2 per 1,000, to 7.2 per 1,000 in 2021-22. For other groups, populations are too small and overall population estimates were too uncertain to identify a statistically significant change. The publication of the 2022 census data will allow more accurate population rate calculations in future prison statistics publications.
Ethnicity gender and age of prison population
The vast majority of the prison population is male. Over the last ten years female prisoners have accounted for only 4-5% of the total population on an average day. In 2021-22, 96% of the female prison population self-identified as White. The absolute number of female prisoners belonging to each of the other ethnic groups is in single figures, so it is hard to make any firm conclusions on trends within these groups.
Prisoners identifying as White are older in general than those from minority ethnic (excluding white minority ethnic) groups. The ethnicity of prisoners varies across age groups, with a higher proportion of younger prisoners being from minority ethnic (excluding white minority) groups (8.7% of under 21-year olds on an average day in 2021-22, compared with 5.1% of the prison population overall). In contrast, 97.2% of prisoners aged 50 or over were White. The 2011 and 2022 census found a large proportion of minority ethnic groups in Scotland had much younger age profiles than those who identify as White.
4.8 Justice social work statistics
Justice social work statistics provide information on the range of activities undertaken by local authority justice social work departments. This paper reports on three of these national statistics which include ethnicity data: criminal justice social work reports; community payback orders; and diversion from prosecution.
Diversion from prosecution
The relevant prosecution policy of the Lord Advocate is that diversion should be considered for all individuals where there is an identifiable need that has contributed to their offending and which is best met through a diversion scheme. This is particularly the case where the individual is aged under 18 and there is a presumption that an alternative to prosecution will be in the public interest. In diversion cases, a Procurator Fiscal may decide to waive prosecution or to defer prosecution pending the successful completion of the diversion scheme.
2,230 diversion from prosecution cases commenced in 2020-21. Where ethnicity was known, 95.9% involved a person of White ethnicity, 1.5% a person of Asian ethnicity, 0.7% a person of African, Caribbean or Black ethnicity, 0.5% a person of Mixed ethnicity, and 1.3% a person of Other ethnicity. Table 4.7 shows that these figures have been largely stable for the past five years.
| Ethnicity | 2016-17 | 2017-18 | 2018-19 | 2019-20 | 2020-21 |
|---|---|---|---|---|---|
| White | 96.6 | 96.5 | 97.7 | 96.4 | 95.9 |
| Asian | 1.4 | 0.7 | 1.0 | 1.2 | 1.5 |
| African, Caribbean or Black | 0.9 | 0.9 | 0.3 | 0.7 | 0.7 |
| Mixed | 0.2 | 0.7 | 0.3 | 0.5 | 0.5 |
| Other | 0.9 | 1.2 | 0.7 | 1.2 | 1.3 |
Source: Criminal justice social work statistics: 2020 - 2021
Criminal Justice Social Work Reports
The criminal justice social work report (CJSWR) in its current format was introduced across Scotland from February 2011 to ensure a consistent provision of information, including the social worker's professional assessment. This report is intended to assist in the sentencing process and to complement the range of other considerations, such as victim information and narratives from the Procurator Fiscal. In particular, the CJSWR provides information on social work interventions and how these may prevent or reduce further offending. A CJSWR must be requested in the following situations:
- before imposing a custodial sentence for the first time or where a person is under 21
- when imposing a community payback order with a supervision requirement or level 2 (over 100 hours) unpaid work or other activity requirement
- when imposing a drug treatment and testing order
15,104 criminal justice social work reports (excluding supplementary reports) were submitted in 2020-21. This was a significant reduction compared to the previous 4 years and was reflective of lower court volumes as a result of Covid-19 restrictions. Where ethnicity was known, 96.0% of criminal justice social work reports submitted in 2020-21 involved a person of White ethnicity, 1.5% a person of Asian ethnicity, 0.7% a person of African, Caribbean or Black ethnicity, 0.3% a person of Mixed ethnicity and 1.5% a person of Other ethnicity. Table 4.8 shows that these figures have been largely stable for the past five years.
| Ethnicity | 2016-17 | 2017-18 | 2018-19 | 2019-20 | 2020-21 |
|---|---|---|---|---|---|
| White | 96.5 | 96.6 | 96.0 | 96.1 | 96.0 |
| Asian | 1.3 | 1.2 | 1.5 | 1.6 | 1.5 |
| African, Caribbean or Black | 0.8 | 0.7 | 0.9 | 0.8 | 0.7 |
| Mixed | 0.3 | 0.3 | 0.3 | 0.3 | 0.3 |
| Other | 1.2 | 1.1 | 1.4 | 1.1 | 1.5 |
Source: Criminal justice social work statistics: 2020 - 2021
Community payback orders
A community payback order (CPO) can contain up to ten different requirements at first imposition. Every order should have either or both an unpaid work or other activity requirement or an offender supervision requirement.
8,169 community payback orders commenced in 2020-21. This was a significant reduction compared to the previous 4 years and was reflective of lower court volumes as a result of Covid-19 restrictions. Where ethnicity was known, 96.5% of community payback orders commenced in 2020-21 involved a person of White ethnicity, 1.4% a person of Asian ethnicity, 0.8% a person of African, Caribbean or Black ethnicity, 0.3% a person of Mixed ethnicity and 1.0% a person of Other ethnicity. Table 4.9 shows that these figures have been largely stable for the past five years.
| Ethnicity | 2016-17 | 2017-18 | 2018-19 | 2019-20 | 2020-21 |
|---|---|---|---|---|---|
| White | 96.6 | 96.3 | 96.0 | 96.1 | 96.5 |
| Asian | 1.2 | 1.3 | 1.7 | 1.5 | 1.4 |
| African, Caribbean or Black | 0.7 | 0.8 | 0.8 | 0.9 | 0.8 |
| Mixed | 0.4 | 0.3 | 0.3 | 0.3 | 0.3 |
| Other | 1.1 | 1.3 | 1.2 | 1.1 | 1.0 |
Source: Criminal justice social work statistics: 2020 - 2021
Contact
Email: Justice_Analysts@gov.scot