Ethnicity in the Justice System
This paper presents a review of quantitative evidence relating to ethnicity in the justice system in Scotland.
3. Experiences of crime
3.1 Introduction
This chapter provides information relating to people’s experiences of crime. Information is provided on the ethnicity of victims of hate crime from studies into police recorded hate crime. Findings are also presented on experiences of being a victim of crime and on civil law problems from new analysis based on a pooled sample of the Scottish Crime and Justice Survey (SCJS). The SCJS pooled sample combines responses to the nine surveys conducted between 2008/09 and 2019/20. With this larger pooled sample analysis by ethnicity is possible for the first time.
3.2 Key findings
Analysis of the Scottish Crime and Justice Survey pooled sample shows that:
- People who identify as African, Caribbean or Black and as from a Mixed or Multiple ethnic group have a higher rate of victimisation than the national average.
- People who identify as an Other ethnic group have a lower rate of victimisation than the national average.
- There is no variation by ethnicity in whether or not someone reports a crime to the police.
- Issues with housing and immigration are more prevalent amongst some minority ethnic groups.
Race aggravated hate crimes make up the majority of hate crimes reported to the police. There has been a fall in the number of race aggravated hate crimes reported since 2014/15.
3.3 Experience of crime
This section presents findings from the Scottish Crime and Justice Survey (SCJS) pooled sample on people’s experiences of crime. The SCJS asks respondents if they have been a victim of a crime or an offence in the twelve months prior to the SCJS interview. The SCJS covers two broad categories of crime victimisation, property crime and violent crime. It should be noted that as the SCJS pooled sample combines responses to nine surveys, some respondents will have been answering questions relating to experiences in 2008/09 and others as late as 2019/20.
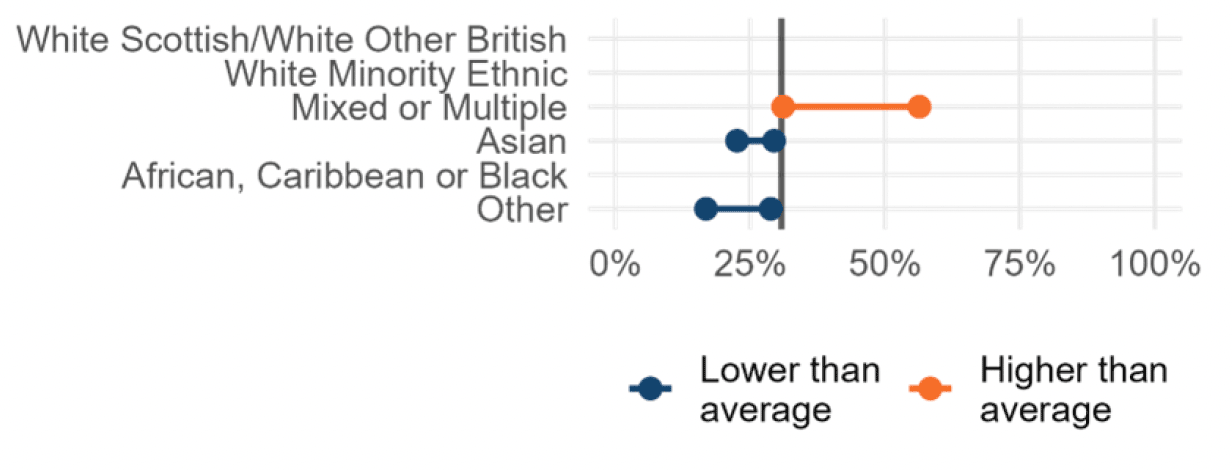
The survey found the national average victimisation rate to be just over 17% for the entire pooled sample. Respondents who identified as a Mixed or Multiple ethnic group and those who identified as African, Caribbean or Black were found to have a statistically significant higher rate of victimisation than the national average (31% and 23% respectively). People from an Other ethnic group were found to have a lower rate of victimisation (12%) than the national average.
Property crime is more prevalent than violent crime. Of all SCJS respondents, 15% said that they had been the victim of a property crime in the twelve months prior to being interviewed, but only 3% reported being the victim of a violent crime in the same period.
Overall, there was a higher rate of victimisation for property crime found amongst those who identified as a Mixed or Multiple ethnic group (27%), and those who identified as African, Caribbean or Black (21%) compared to the national average (15%). People from an Other ethnic group were found to have a lower rate of victimisation for property crime (11%) compared to the national average. When looking at just violent crime, there were no differences found between ethnic groups. Full results can be found in Appendix C: Table A3.1.
Reporting crime to the police
For people that reported being the victim of a crime in the SCJS, just under two in five (or 38%) said that the police came to know about the incident. No ethnic group was more or less likely than the national average to report an incident to the police.
3.4 Experience of hate crime
This section presents findings from two “deep dive” studies that have been completed into the characteristics of police recorded hate crime in Scotland[4]. The first study analysed data from 2018-19 and the second follow up study covered 2020-21. This research was based on a sample of police records[5] (rather than all records), therefore the findings presented are estimates. The findings presented here are based on victims who are non-police officer victims of hate crime[6].
Findings from both studies show a very similar picture of race aggravated hate crime, therefore only the most recent results, 2020-21, are presented here. The focus is on hate crimes where race is the aggravator. The ethnicities of victims of other hate crime aggravators are also briefly outlined.
Under-reporting of hate crime is known to be an issue and only incidents that were brought to the attention of the police are included in the studies. Incidents included in the studies may not necessarily be the same as for those hate crimes that didn’t get reported to the police, and therefore the characteristics of all hate crime in Scotland could be different.
A hate crime is defined as any crime which is perceived by the victim or any other person, to be motivated (wholly or partly) by malice and ill-will towards a social group. In Scotland, the law recognises hate crimes as crimes motivated by prejudice based on the following characteristics:
- Disability,
- Race,
- Religion,
- Sexual orientation,
- Transgender identity.
Overview of police recorded hate crimes
The police recorded 6,927 hate crimes in 2021-22. Since 2014-15, the number of hate crimes recorded each year has fluctuated between 6,300 and 7,000 crimes.
In 2021-22, around three-fifths (62%) of hate crimes included a race aggravator. Whilst race aggravated hate crimes make up the majority of hate crimes, as shown in Figure 3.1, there has been a fall in the number of race aggravated hate crimes since 2014-15 (down 18% from 5,178 crimes in 2014-15 to 4,263 crimes in 2021-22).
Victims of race aggravated hate crime
In 2020-21, where information was available on the ethnicity of victims, almost two-thirds (or 64%) of race aggravated hate crimes had a victim from a visible minority ethnic (non-white) group (Table 3.1). Over a third (36%) of victims of a race aggravated hate crime identified as Asian[7], and 18% identified as African, Caribbean or Black[8].
In 2020-21, the majority of racially aggravated hate crimes had a male or all male group of victims, representing 60% of crimes. The average age of a victim was 35 years old. In around half of these crimes (50%), the victim did not know the perpetrator, with a further third (33%) involving a perpetrator who was an acquaintance.
| Ethnicity | Approximate number of race hate crimes reported to police | Estimated % of race hate crimes experienced |
|---|---|---|
| White Scottish/White Other British | 560 | 18% |
| White Minority Ethnic | 550 | 18% |
| Mixed or Multiple Ethnic Group | 160 | 5% |
| Asian | 1100 | 36% |
| African, Caribbean, or Black | 550 | 18% |
| Other | 130 | 4% |
Location of crimes
In 2020-21, a third of racially aggravated hate crimes (33%) occurred in an open space, followed by in or around a dwelling (24%) and a retail or hospitality setting (20%). In just over one in ten crimes (11%) the victim and perpetrator were not in the same location. This category includes cases that involved the use of cyber-enabled technologies, accounting for 7% of racially aggravated hate crimes.
In 2020-21, just over two-thirds of racially aggravated hate crime victims (36% of cases) experienced the incident at their place of work or whilst undertaking duties as part of their occupation, which is higher than the proportion for all hate crimes in total (31%). Where victims were working, most were in retail and service related industries, representing 70% of victims in work and a quarter (25%) of all victims.
Reporting to the police
In 2020-21, the vast majority of racially aggravated hate crimes which were reported to the police were reported by the victim (89%). This breaks down into 81.5% reported by the victim directly and 7.2% which were reported by someone on behalf of the victim (including parents, teachers, carers or employers). In 9% of cases, the crime was reported by a witness.
Prejudices shown by perpetrators when committing racially aggravated hate crimes
The prejudice shown by a perpetrator is most often based on the words used or actions taken during the crime. A person does not need to be a member of the social group being targeted by the perpetrator to be the victim of a hate crime and their identity or other characteristics do not need to align with the perpetrator’s perceptions. A perpetrator can also show prejudice against multiple social groups as part of the same crime.
Table 3.2 shows the prejudices displayed in race aggravated hate crime in 2020-21. In 36% of race aggravated hate crimes, the words used or actions taken by the perpetrator suggested an anti-black prejudice. As noted above, in these crimes the victim does not necessarily need to self-identify as black and in some cases they may have been targeted simply because the perpetrator perceived them to be from a visible minority ethnic (non-white) group.
In 27% of hate crimes, the prejudice shown was anti-Pakistani. In just under one in five crimes (18%), the perpetrator made general xenophobic remarks not directed at any one group. In 9% of crimes the prejudice was anti-Polish and in 6% of crimes it was anti-English.
| Prejudice shown | Percentage of race aggravated hate crimes |
|---|---|
| Anti-Black | 36% |
| Anti-Pakistani | 27% |
| Anti-Polish | 9% |
| Anti-English | 6% |
| Anti-Chinese | 3% |
| Anti-White | 2% |
| Anti-African | 2% |
| General Xenophobia | 18% |
| Unspecified Race | 2% |
Table 3.3 illustrates that the ethnicity of victims of race aggravated hate crimes does not always align to the prejudices shown against them. For example, in around a third (32%) of race aggravated hate crimes directed at Asian victims in 2020-21, the prejudice shown was anti-black.
Further more detailed analysis of victim ethnicity for race aggravated hate crime is available in the first deep dive study into the characteristics of police recorded hate crime in Scotland.
| Victim ethnicity | Most common prejudices shown in proportion of cases |
|---|---|
| White Scottish/White Other British | Anti-English 29% Anti-Black[9] 23% |
| White Minority Ethnic | Anti-Polish 50% General Xenophobia 32% |
| Mixed or Multiple | Anti-Black 35% General Xenophobia 21% |
| Asian | Anti-Pakistani 56% Anti-Black 32% |
| African, Caribbean or Black | Anti-Black 89% General Xenophobia 16% |
| Other | General Xenophobia 39% Anti-Black 25% |
Ethnicity of victims across all other hate crime aggravators
The ethnicity of victims is recorded across all of the five hate crime aggravators. In 2020/21, with the exception of race aggravated hate crime, the majority of hate crime victims across other aggravators identified as White Scottish/White Other British.
Where information was available on the ethnicity of victims of disability aggravated crime, the vast majority of crimes (88%) had a victim who was White Scottish/White Other British. The second largest group was White Minority Ethnic who were found to be the victim in 6% of crimes.
Where information was available on the ethnicity of victims of religion aggravated crime, it was found that in 72% of crimes the victim was from a White Scottish/White Other British background. The next largest group was Asian, who were found to be the victim in 14% of such crimes. All other ethnicities accounted for a further 14% of religion aggravated hate crimes.
In just under half (47%) of religion aggravated hate crimes, the perpetrator showed prejudice towards the Catholic community, which equates to an estimated 150 crimes. Prejudice towards the Muslim community and the Protestant community was shown in a similar proportion of crimes, equating to 16% (or 50 crimes) each.
Between the first and second deep dive, there was a reduction in the proportion of religion aggravated hate crimes that showed prejudice towards the Muslim community. In 2018-19, just over a quarter of such crimes showed prejudice towards this group (26%), compared to around one in six crimes in 2020-21 (16%).
Where information was available on the ethnicity of victims of sexual orientation aggravated crime, the vast majority (90%) of crimes had a victim who was from a White Scottish/White Other British background. White Minority Ethnic was the second largest group, who were found to be the victim in 5% of such crimes. All other ethnic groups accounted for the remaining 5% of victims.
Where information was available on the ethnicity of victims of transgender identity aggravated crime, the vast majority (90%) of crimes had a victim who was from a White Scottish/White Other British background. The second largest group was White Minority Ethnic who made up 8% of victims.
3.5 Experience of civil law problems
This section presents findings from the Scottish Crime and Justice Survey (SCJS) pooled sample on people’s experiences of civil law problems. As part of the SCJS people were asked if they had experienced a range of civil law problems in the last three years. It should be noted that, as the SCJS pooled sample combines responses to nine surveys, some respondents will have been answering questions relating to experiences in 2008/09 and others as late as 2019/20.
Only a small proportion of people experience any of the seven civil law problems asked about. Overall, 81% of respondents stated that they had experienced none of these problems in the last three years.
Problems with neighbours is the most commonly experienced, with 11% of people saying they have experienced this within the last three years. Full results can be found in Appendix C: Table A3.2.
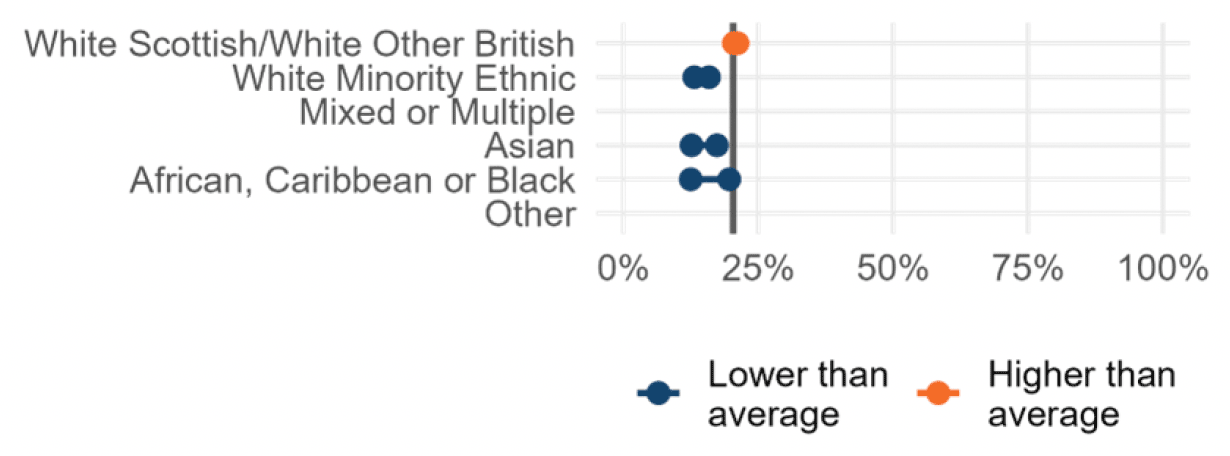
There are statistically significant variations by ethnicity for six of the seven civil law problems, as can be seen in Figure 3.2. Problems with neighbours; child contact, residence or maintenance; divorce, separation; and the behaviour of a partner, ex-partner or other person harassing them are less commonly experienced in some minority ethnic groups.
Issues with housing and immigration are more prevalent amongst some minority ethnic groups. White Minority Ethnic, Asian, African, Caribbean or Black respondents, and people from Other ethnic groups were all more likely than average to have experienced immigration problems. African, Caribbean or Black respondents were also more likely than average to have experienced housing problems.
Contact
Email: Justice_Analysts@gov.scot