Ethnicity in the Justice System
This paper presents a review of quantitative evidence relating to ethnicity in the justice system in Scotland.
2. Perceptions of crime, safety, the police and the justice system
2.1 Introduction
In this chapter findings are presented from new analysis based on a pooled sample of the Scottish Crime and Justice Survey (SCJS). The SCJS pooled sample combines responses to the nine surveys conducted between 2008/09 and 2019/20. With this larger pooled sample analysis by ethnicity is possible for the first time. The analysis presented in this chapter focusses on people’s experiences and perceptions of crime, community safety, and the justice system in Scotland.
2.2 Key findings
Analysis of Scottish Crime and Justice Survey (SCJS) pooled sample shows that perceptions of crime, safety, the police and the justice system vary by ethnic group. Particular differences include:
- People who identify as White Minority Ethnic and as an Other ethnic group are less likely than the national average to say that crime is very or fairly common in their area.
- Those who identify as White Minority Ethnic, African, Caribbean or Black and as a Mixed or Multiple ethnic group are more likely to think that the national crime rate has gone down or stayed the same in the last two years.
- Those who identify as Asian and African, Caribbean or Black have a higher level of fear that they will be victim to both property crimes and violent crimes.
- People who identify as White Minority Ethnic have lower levels of fear around property crime and violent crime.
- People who identify as Asian are less likely to say that they feel safe walking alone in their local area after dark compared to the national average, whilst those from a White Minority Ethnic group feel more safe.
- People from all minority ethnic groups are less likely, than the national average, to give a positive account of people in their area and their efforts to prevent crime.
- People from all minority ethnic groups are more likely to hold positive views of the police than the national average.
- The majority of people who had had personal interactions with the police in the last twelve months are satisfied with how the police handled the situation. Levels of satisfaction do not vary by ethnicity.
- People from minority ethnic groups tend to have more positive views of the justice system than the national average. However, there are exceptions, where those from minority ethnic groups have a more negative view of the justice system. These relate to the fairness and treatment of those accused of a crime.
2.3 Perceptions of crime
This section presents findings from the Scottish Crime and Justice Survey (SCJS) pooled sample on people’s perceptions of crime both in Scotland and their local community. It should be noted that, as the SCJS pooled sample combines responses to nine surveys, some respondents will have been answering questions relating to experiences in 2008/09 and others as late as 2019/20.
People who identify as White Minority Ethnic are more likely than the national average to think that the crime rate in their local area has gone down or stayed the same in the last two years[3] (77% compared to 73%). Results for all other ethnicities are equivalent to the national average (Figure 2.1).
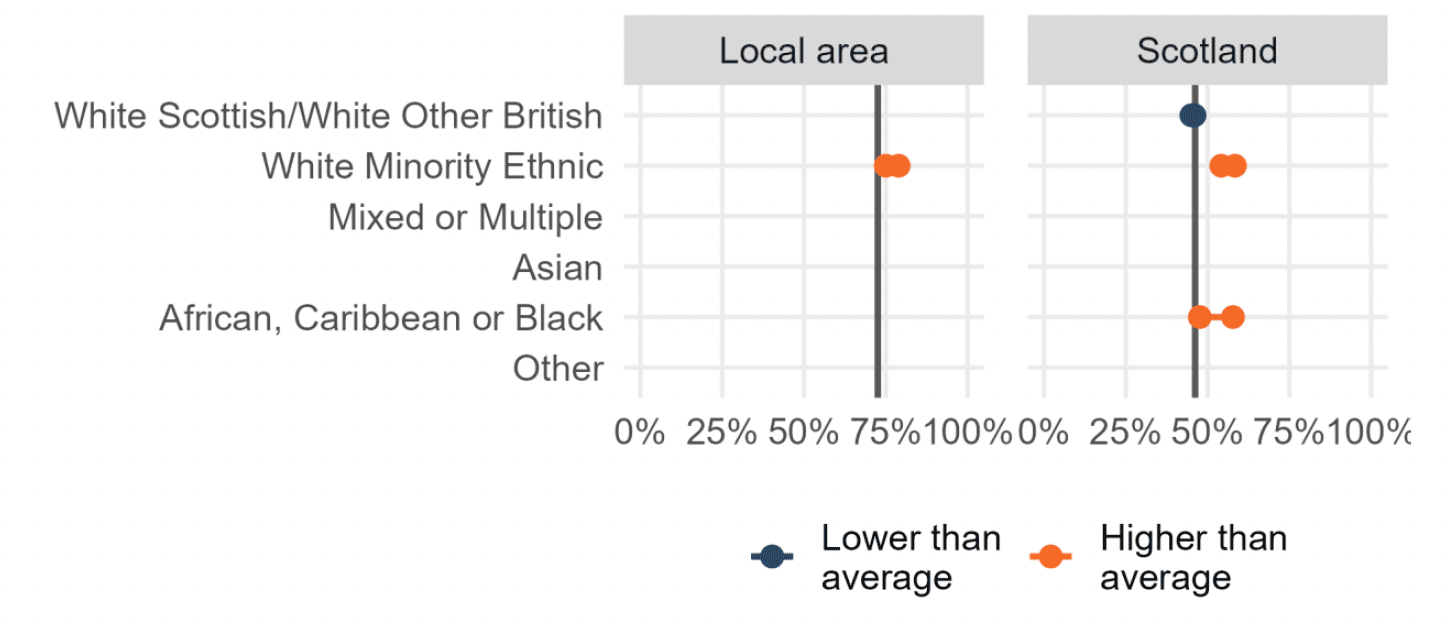
When asked whether the crime rate in Scotland overall had changed in the last two years, respondents tend to have more negative opinions of the national crime rate than for their local area. 46% of people thought that the crime rate in Scotland had gone down or stayed the same in the last two years, compared to 73% when asked about their local area.
People from a Mixed or Multiple ethnic group (61%), White Minority Ethnic respondents (56%), and African, Caribbean or Black respondents (52%) are more likely than the national average (46%) to think the crime rate in Scotland had gone down or stayed the same in the last two years. White Scottish/White Other British respondents are significantly less likely to think that the national crime rate had gone down or stayed the same.
Perception of prevalence of specific crimes in local area
Respondents in the SCJS were asked how common they thought thirteen types of crime were in their local area. Overall, perceptions of how common a crime is in the local area vary by crime type. Sexual assault is perceived as the least common, 4% think it is fairly or very common in their area. Anti-social behaviour (41%) and drug dealing and drug abuse (45%) are perceived as the most common crimes in the local area.
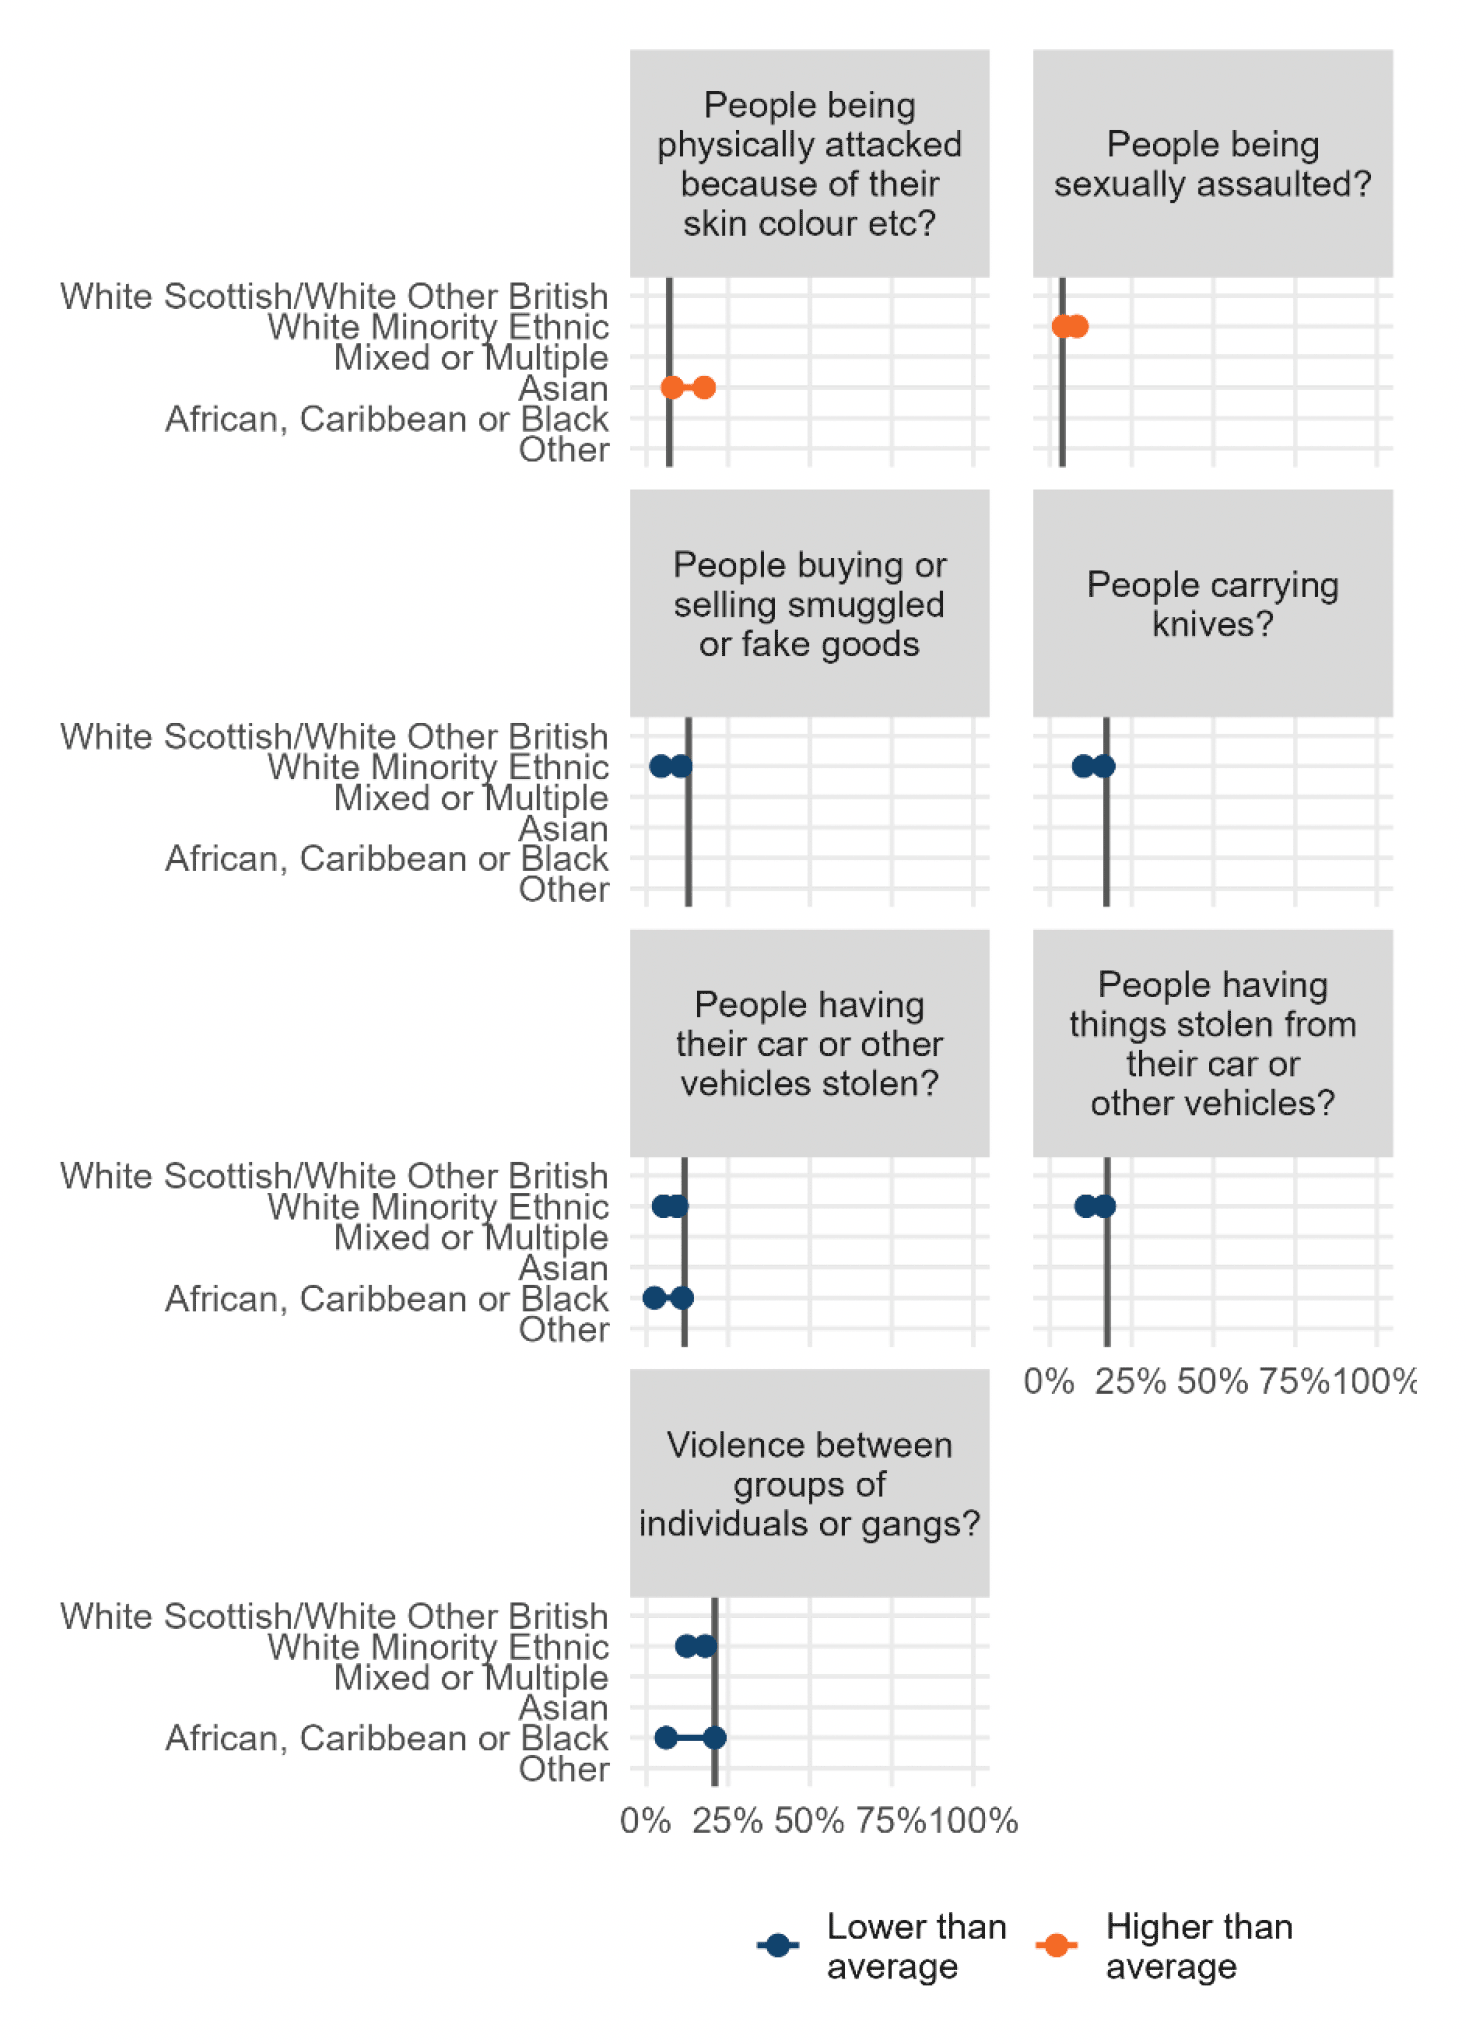
Figure 2.2 provides a summary of statistically significant differences in perceptions of the thirteen different crimes by ethnicity. Full results are in Appendix C: Table A2.1.
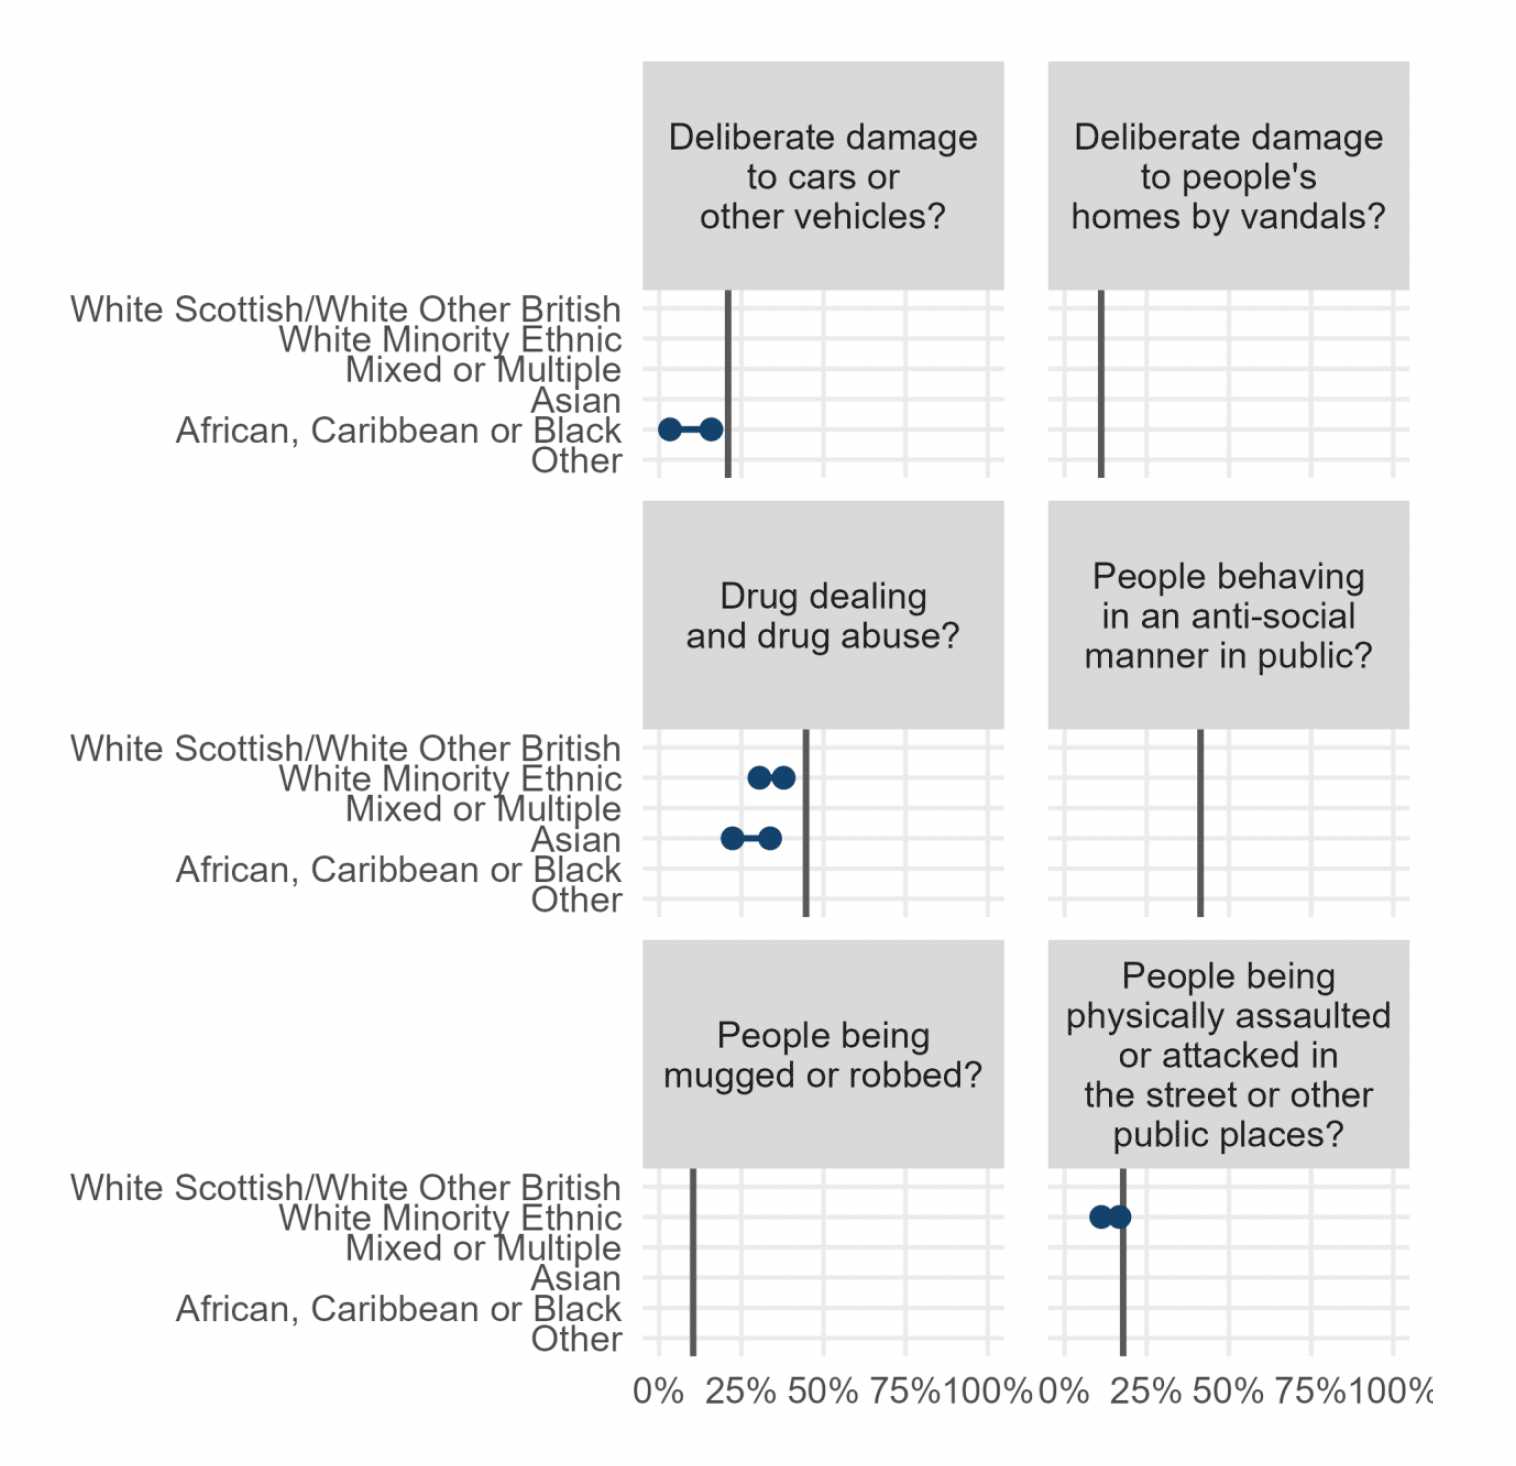
There are significant differences in the perception of eleven out of the thirteen crimes by ethnicity. There are no differences by ethnicity in views of how common deliberate damage to people's homes by vandals (11% national average) or people being mugged or robbed (10%) are in the local area.
Where differences are noted, in general White Minority Ethnic respondents tend to be less likely than the national average to say that a crime is very or fairly common in their area. The exception to this is people being sexually assaulted, where White Minority Ethnic respondents are more likely to say this is fairly or very common. Three differences are noted for Asian respondents, higher for one crime (people being physically assaulted because of their skin colour etc.) and lower for two crimes (drug dealing and drug abuse, and people behaving in an anti-social manner in public).
Those who identify as an Other ethnic group are less likely to think that three types of crimes are common in their area compared to the national average. These are: people having things stolen from their car or other vehicles, drug dealing and drug abuse, and people carrying knives.People who identify as African, Caribbean or Black are less likely to think that deliberate damage to cars or other vehicles is common in their local area.
Data is not available for those from Mixed or Multiple ethnic groups as there were fewer than 50 respondents in this group.
Fear of crime
The SCJS asks respondents about their fear of eleven crime types. Degree of fear varies by crime type. Generally, people are more likely to say that they are fairly or very worried about crimes such as someone using their credit or bank details to obtain money, goods or services (55%), or having their identity stolen (47%), and property crime such as having their house broken into (33%), than violent crime, such as being mugged or robbed (27%) or being physically assaulted (26%), or sexually assaulted (14%). Full results are in Appendix C: Table A2.2.
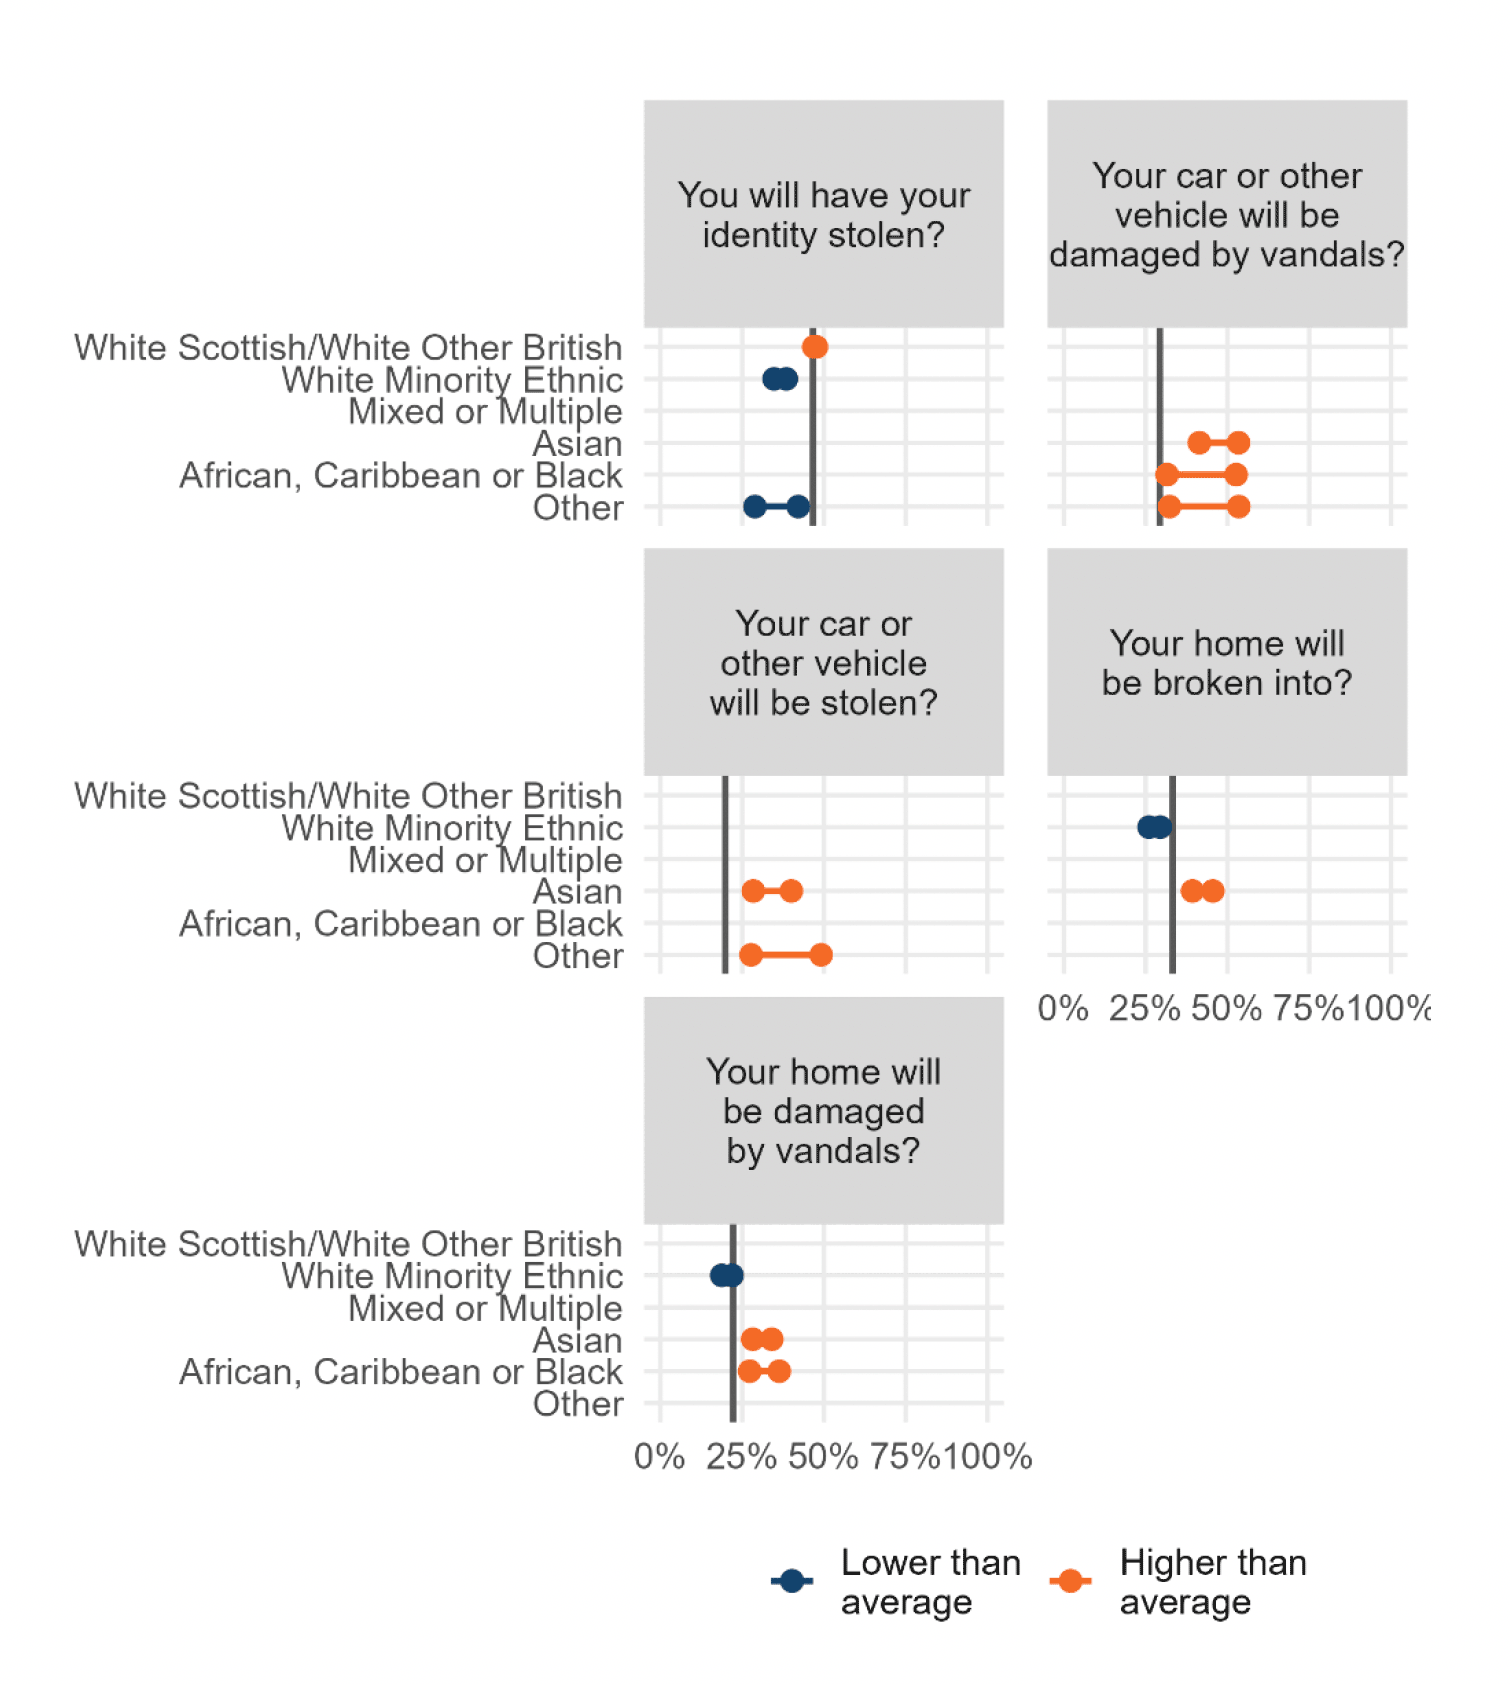
Figure 2.3 provides a summary of statistically significant differences in fear of crime by ethnicity. There are significant differences in how worried respondents are about the possibility of all eleven crimes happening to them by ethnicity. Respondents who identify as Asian, and those who identify as African, Caribbean or Black are consistently found to have higher than the national average level of fear for the majority of crimes asked about, including, both property crimes and violent crimes.
Asian respondents are more likely, than the national average to be fairly or very worried about nine out of the eleven types of crime asked about. They are more worried about all the crimes asked about, other than identity theft and card fraud, where their levels of worry are in line with the national average.
African, Caribbean or Black respondents are more likely to be worried about seven of the types of crime. Respondents from Other ethnic groups were more worried about three types of crime and less worried about one. In contrast, White Minority Ethnic respondents are less likely to be worried about six out of the eleven types of crime. Respondents from Mixed or Multiple ethnicities have levels of fear that are equivalent to the national average across all the crimes asked about.
Perceived likelihood of being a victim of crime
As well as being asked about how worried they are about being a victim of certain types of crime, SCJS respondents are also asked how likely they think it is that they will be a victim of those same eleven types of crime within the next twelve months.
The proportion of people who think they are likely to be a victim of a particular crime in the next twelve months is lower than the proportion who said that they were fairly or very worried about that crime. As with fear of crime, the crimes people are most likely to think they will be a victim of are: someone using their bank or credit details (17%); and having their identity stolen (12%). People are least likely to think that they will be a victim of sexual assault (1%). Full results are in Appendix C: Table A2.3.
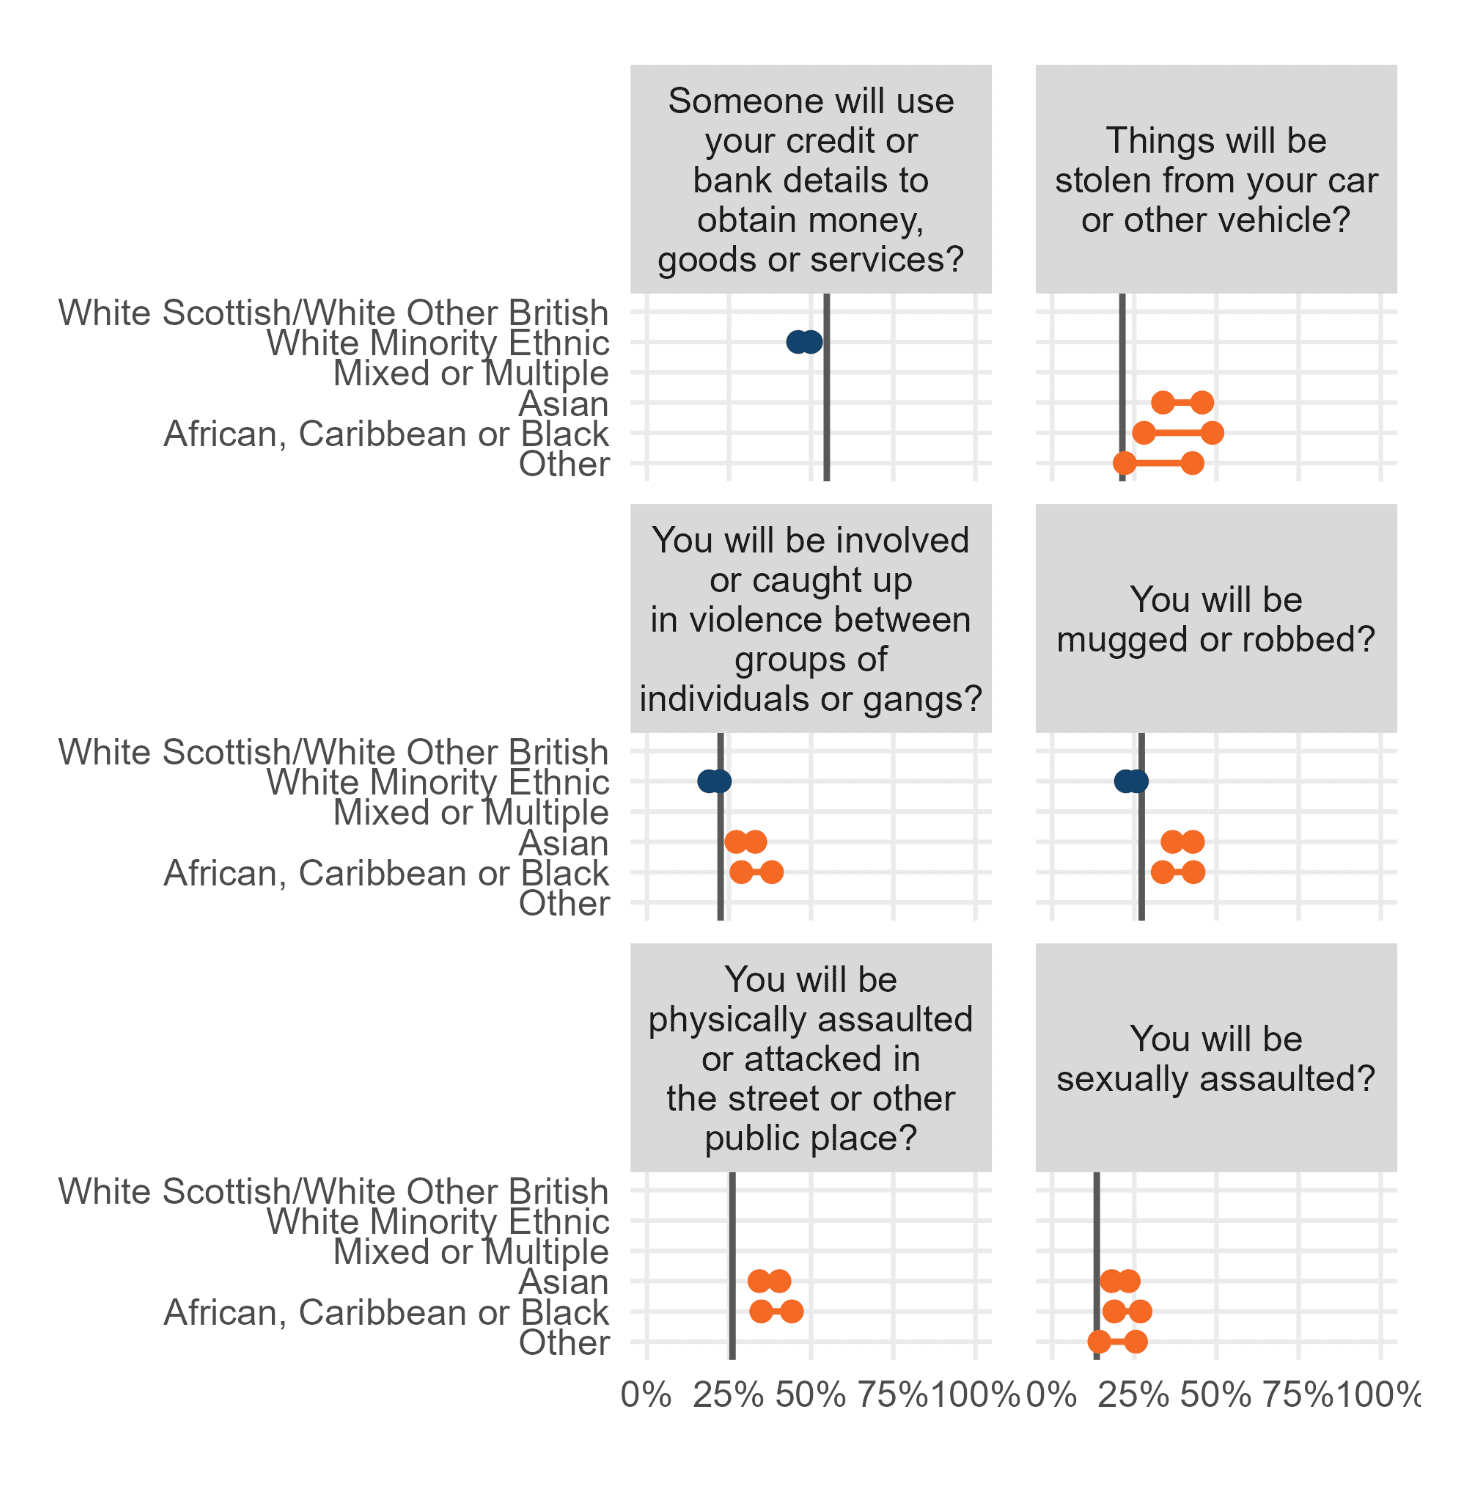
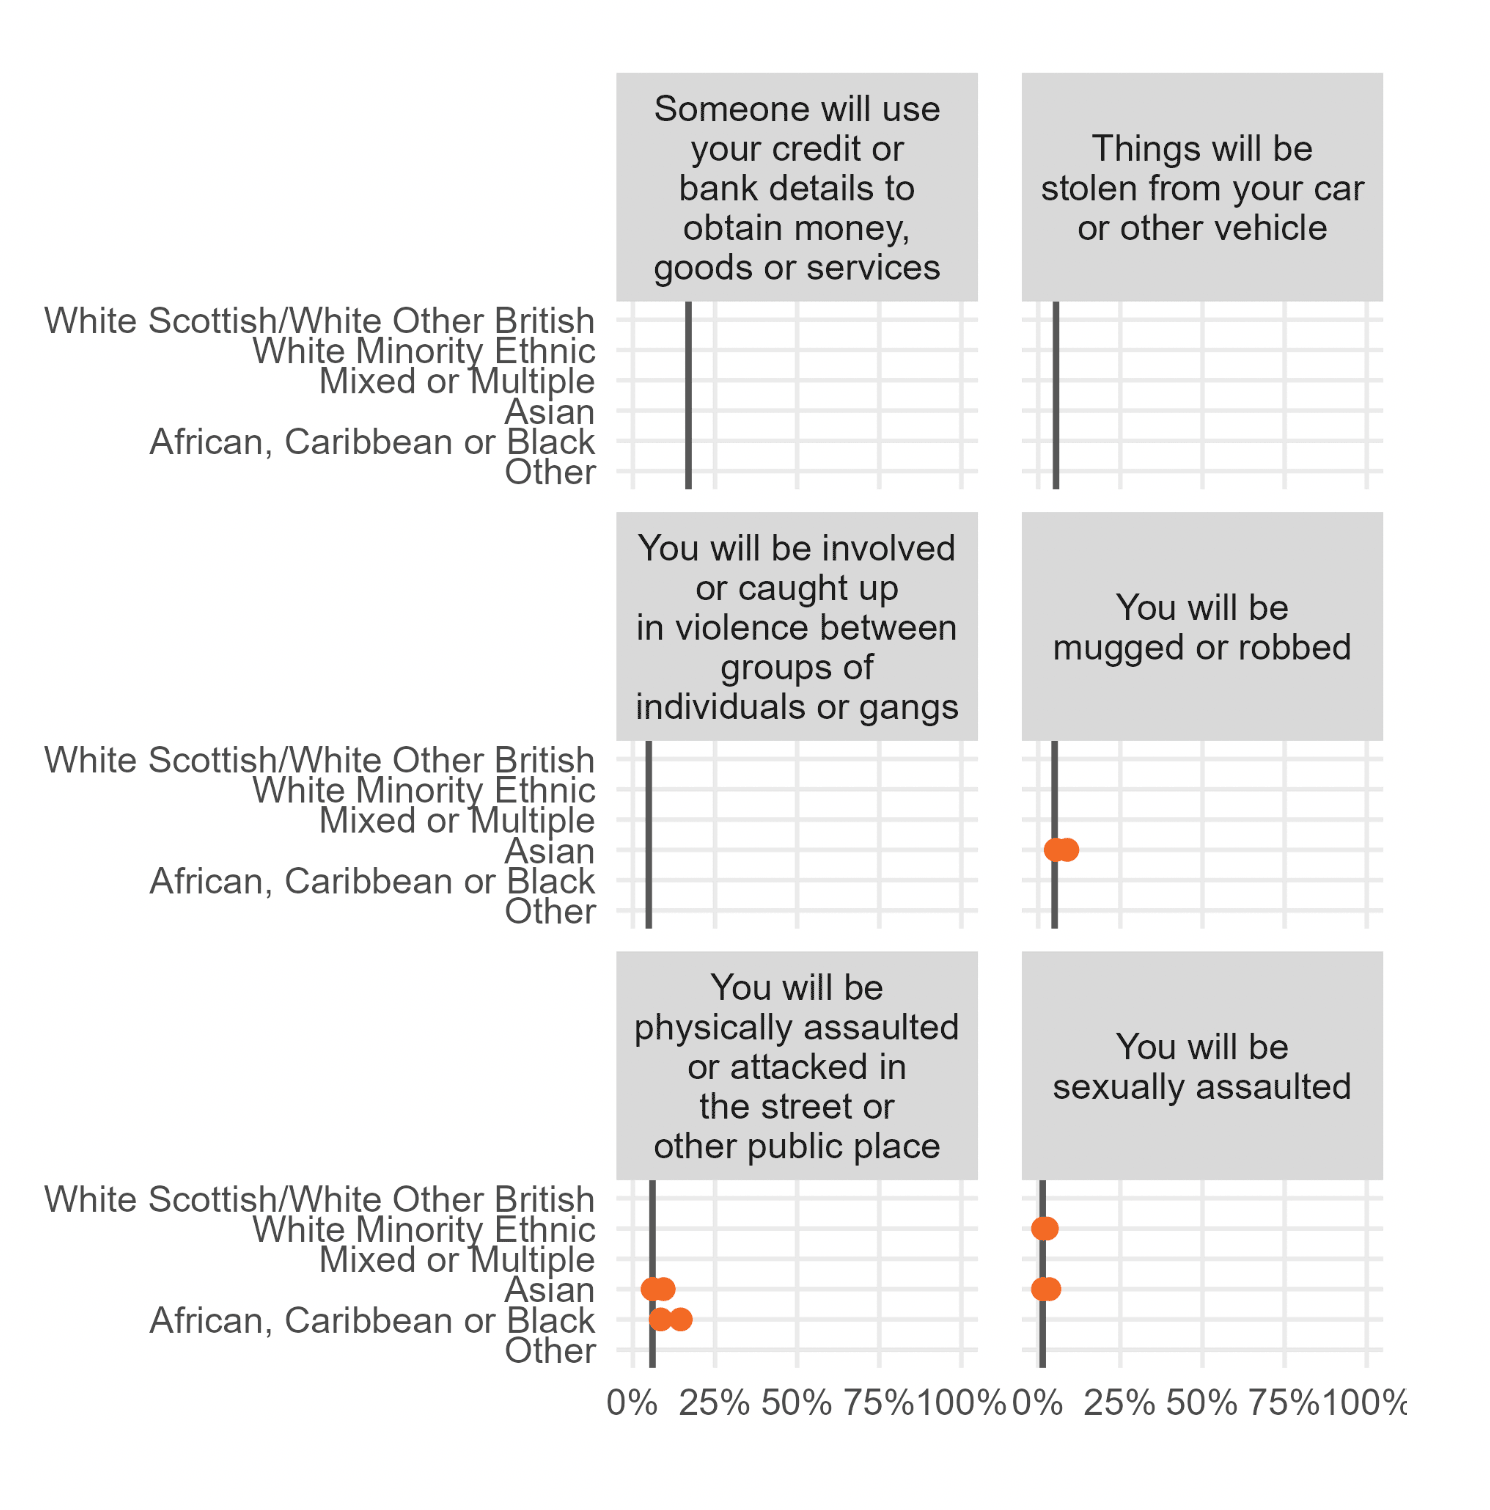
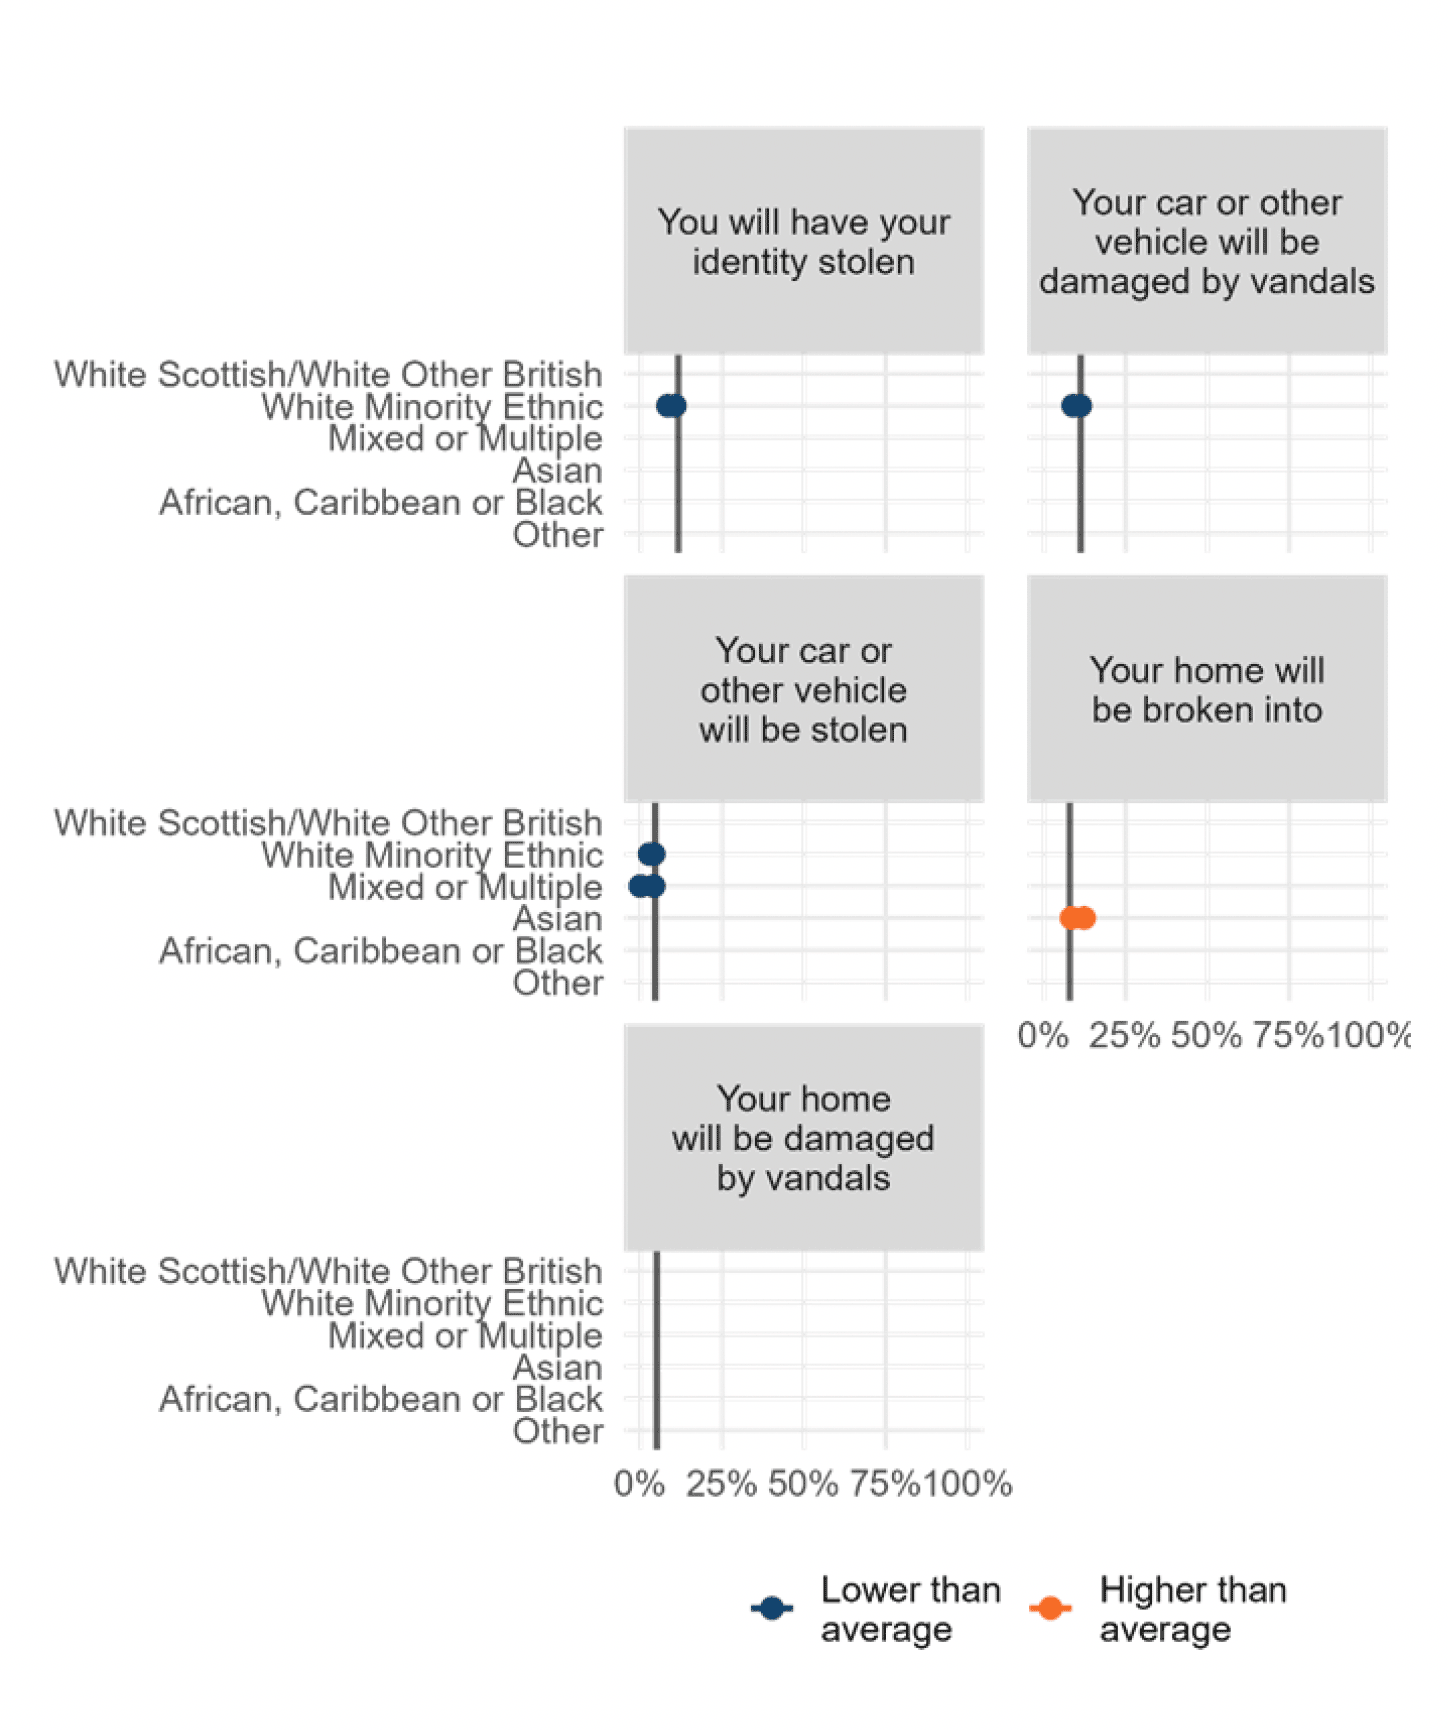
Figure 2.4 provides a summary of statistically significant differences in perceived likelihood of victimisation by ethnicity. There are significant differences in how likely people think they are to be a victim of seven of the eleven crime types by ethnicity. This is less than the number of differences observed in relation to fear of these crimes.
Asian respondents are more likely to perceive themselves as likely victims of four out of the eleven types of crime, including both property and violent crimes. They are more likely to think that they will have their home broken into, as well as be mugged or robbed, sexually assaulted, and be physically assaulted or attacked in the street or other public place.
African, Caribbean or Black respondents are more likely to say that they will be a victim of one type of violent crime, being physically assaulted or attacked in the street or other public place.
Those who identify as White Minority Ethnic are less likely to think that they will be the victims of three types of crime, including vehicle related crimes and identity theft. They are however more likely to think the will be the victim of sexual assault.
Mixed or Multiple respondents are more likely to think that they will be the victims of one type of crime, being physically assaulted or attacked in the street or other public place.
2.4 Feelings of safety
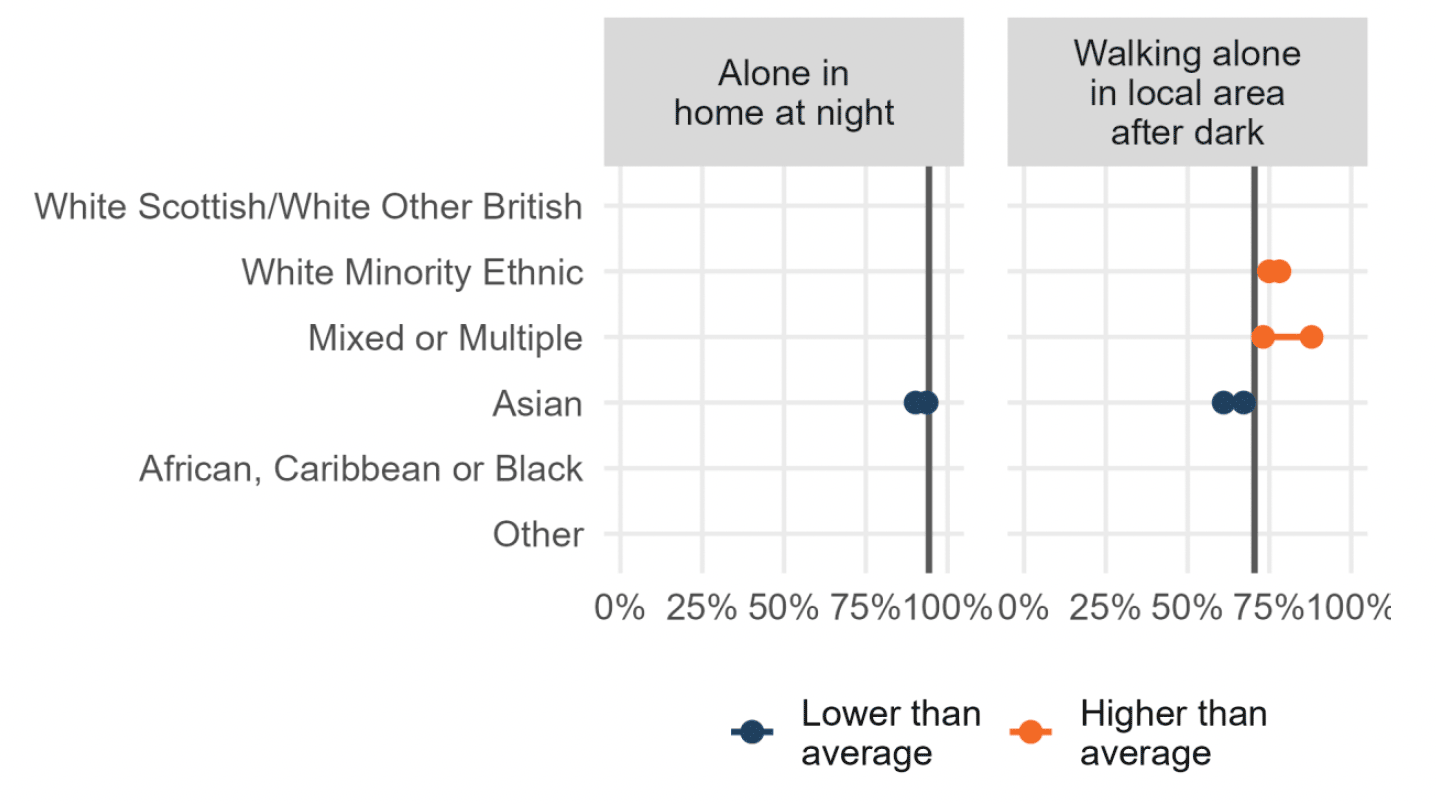
The SCJS survey asks respondents how safe they feel alone in their home at night and walking alone after dark. Figure 2.5 provides a summary of statistically significant differences in feelings of safety by ethnicity.
Overall 70% of respondents in the SCJS pooled sample say that they feel safe walking alone in their local area after dark. Those who identify as Asian feel less safe (65%), whilst those who identify as White Minority Ethnic (76%) feel more safe.
Those who identify as Asian also feel less safe alone in their home at night (92%) compared to the national average (94%). There were no other statistically significant differences found.
2.5 Perception of local community and their effort to prevent crime
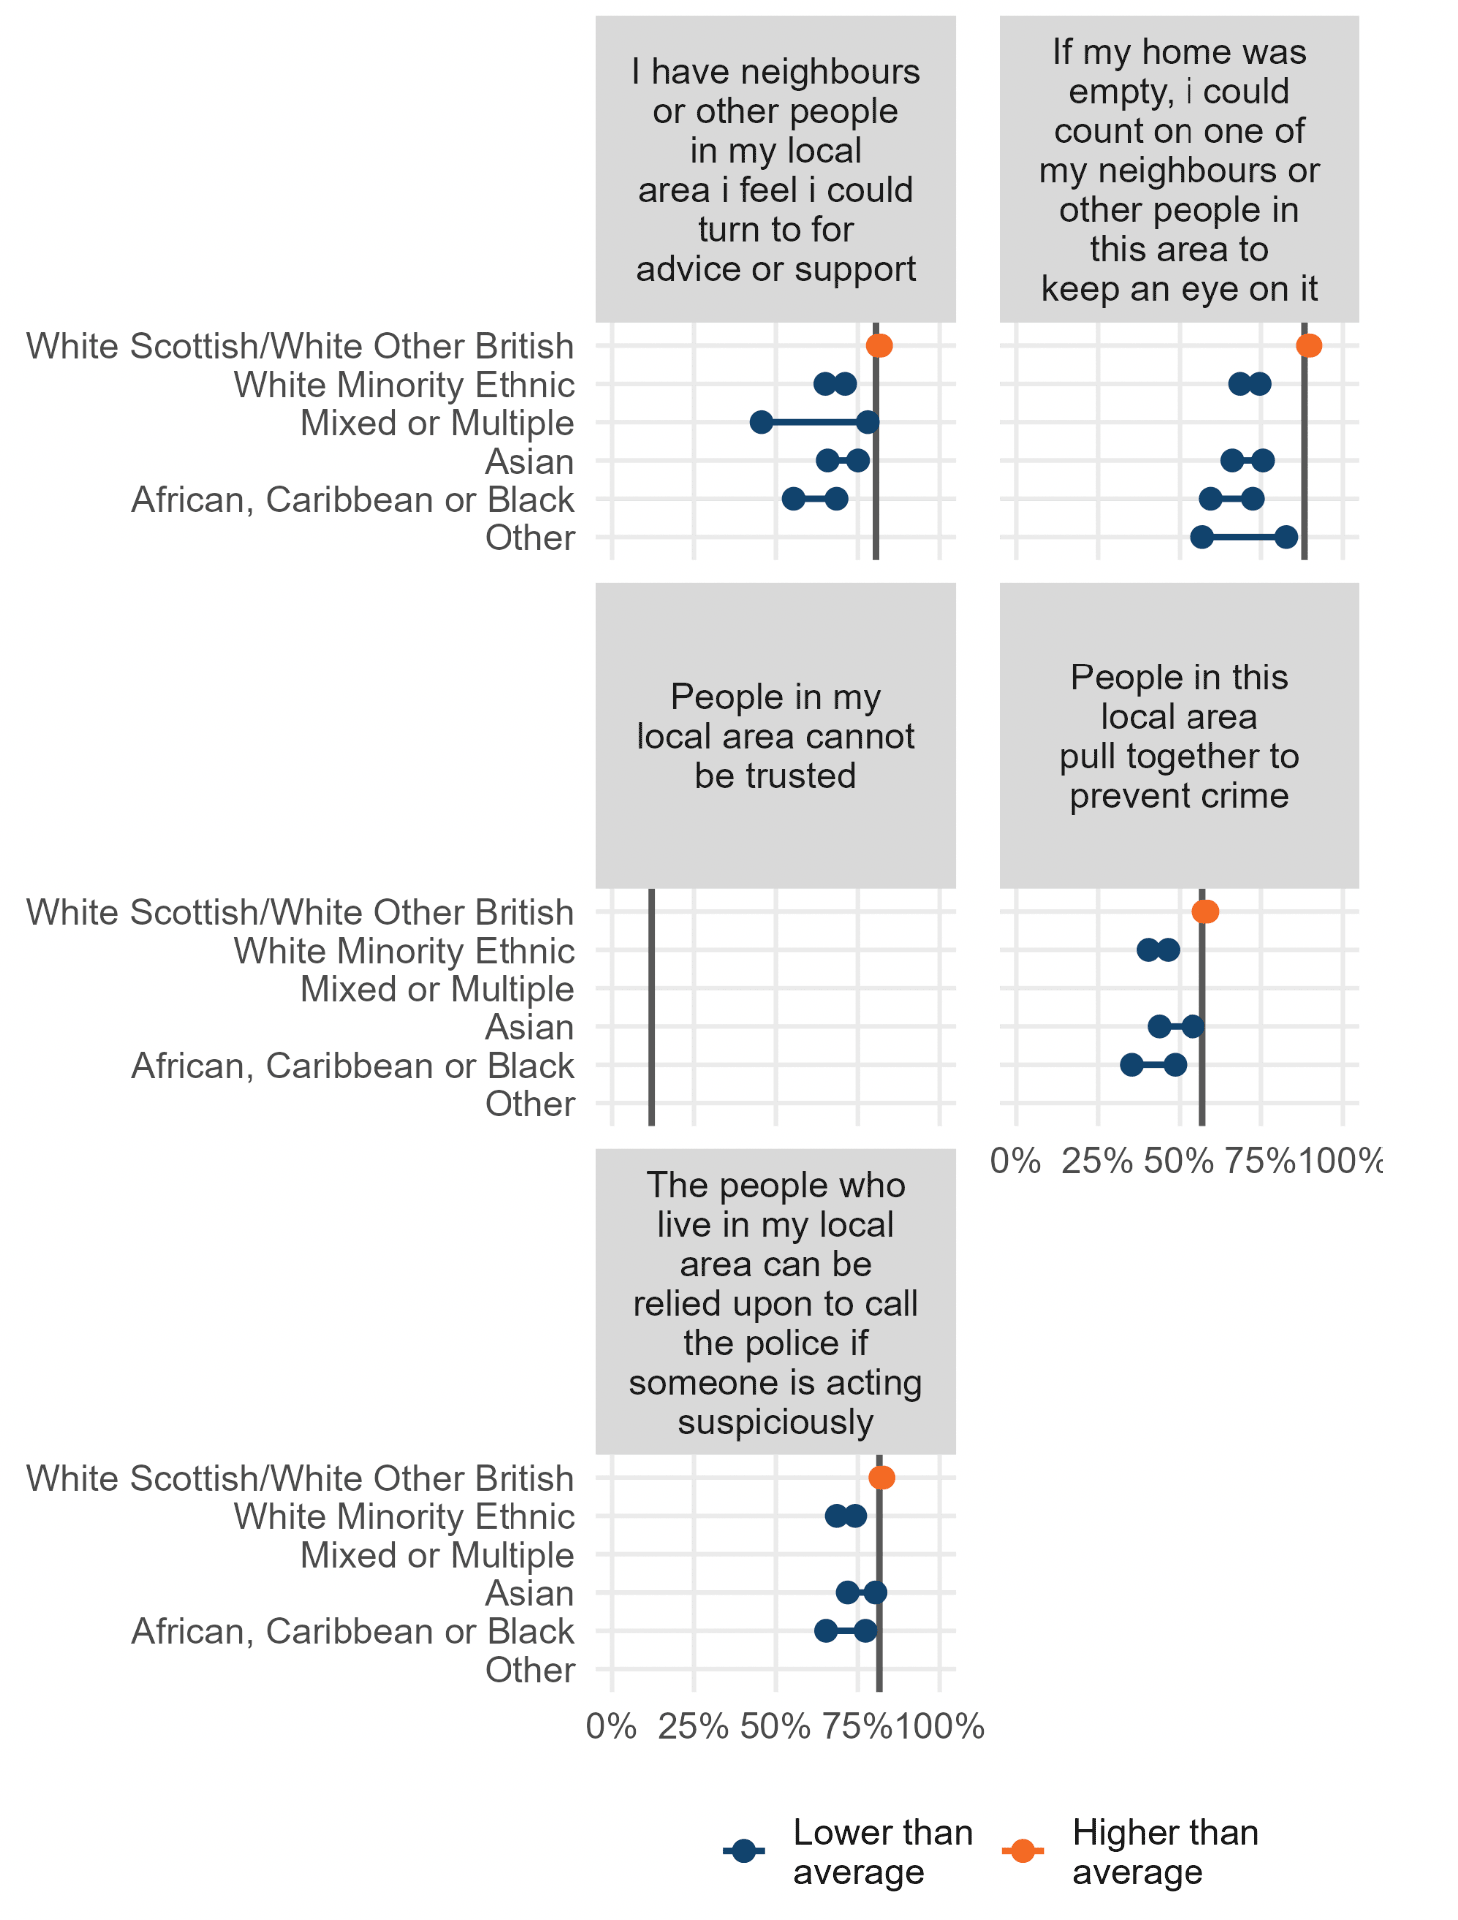
SCJS respondents were asked a series of questions about people in their area and their efforts to prevent crime. Overall, there is high agreement amongst SCJS respondents in the pooled sample that people in their local area would keep an eye on their home if it was empty, call the police if someone was acting suspiciously, and having a neighbour or other person in the local community they could call on for advice or support (over 80% for each of those measures). Similarly, the majority of people nationally think that people in their local area pull together to prevent crime (57%). Full results are in Appendix C: Table A2.4.
Figure 2.6 provides a summary of statistically significant differences in perceptions of community cohesion by ethnicity. Overall, there is low agreement with the statement “people in my local area cannot be trusted” (12%), people who identify as Asian are more likely to agree with this statement (17%), and therefore hold a less positive view of people in their local area.
For all the other community cohesion statements, those who identify as White Minority Ethnic, Asian, and African, Caribbean or Black are less likely to agree than the national average, whilst respondents who identify as White Scottish/White Other British are more likely to agree. Respondents who identify as a Mixed or Multiple ethnic group and an Other ethnic group are less likely than the national average to agree with two of the five community cohesion statements.
Overall, nearly nine out of ten (88%) of people agree that if their home was empty they could count on neighbours or other people in the area to keep an eye on it. Respondents who identify as minority ethnic are less likely to agree: White Minority Ethnic (72%), Mixed or Multiple ethnic group (73%), Asian (69%), African, Caribbean or Black (69%), and Other (75%). White Scottish/White Other British respondents are more likely to agree (90%).
The vast majority of people (82%) also agree that people in their local area can be relied upon to call the police if someone is acting suspiciously. Agreement is lower amongst those who identify as White Minority Ethnic (71%), Asian (74%), and African, Caribbean or Black (73%).
The vast majority of people (81%) agree that they have neighbours or other people in their local area that they feel they could turn to for advice or support. Agreement is lower amongst all minority ethnic groups: White Minority Ethnic (68%), Asian (68%), African, Caribbean or Black (66%), an Other ethnic group (63%), and a Mixed or Multiple ethnic group (63%). Agreement was higher amongst White Scottish/White Other British respondents (82%).
Over half of people agree that people in their local area pull together to prevent crime (57%). Again, agreement is lower amongst those who are White Minority Ethnic (43%), Asian (47%), and African, Caribbean or Black (38%) and higher amongst White Scottish/White Other British respondents (58%).
2.6 Willingness to aid a victim of crime
Respondents in the SCJS were asked to imagine a hypothetical scenario where they were out and saw someone push a man to the ground and steal his wallet. They are then asked how willing/likely they would be to call the police, identify the person who had done it, and give evidence in court against the accused.
Generally the vast majority of people would be likely/willing to get involved in the ways asked about, and there is not much variation in willingness by ethnicity. Please note, that due to small numbers of respondents in certain groups, it is only possible to present data for three ethnicity categories: White Scottish/White Other British; White Minority Ethnic; and Asian. Full results are in Appendix C: Table A2.5.
In a hypothetical situation where people see someone push a man to the ground and steal his wallet, nearly all people (94%) say they are likely to call the police. There are no variations by ethnicity.
Around nine out of ten (91%) of people would be willing to identify the person who had pushed a man to the ground and stolen his wallet. Those who are White Minority Ethnic (94%) are more willing to identify the person who had done it, whilst those who are Asian (81%) are less willing.
The majority of people (84%) are willing to give evidence in court against the accused. Willingness to give evidence in court did not vary by ethnicity.
2.7 Perceptions of the police and the criminal justice system
Confidence in the Police
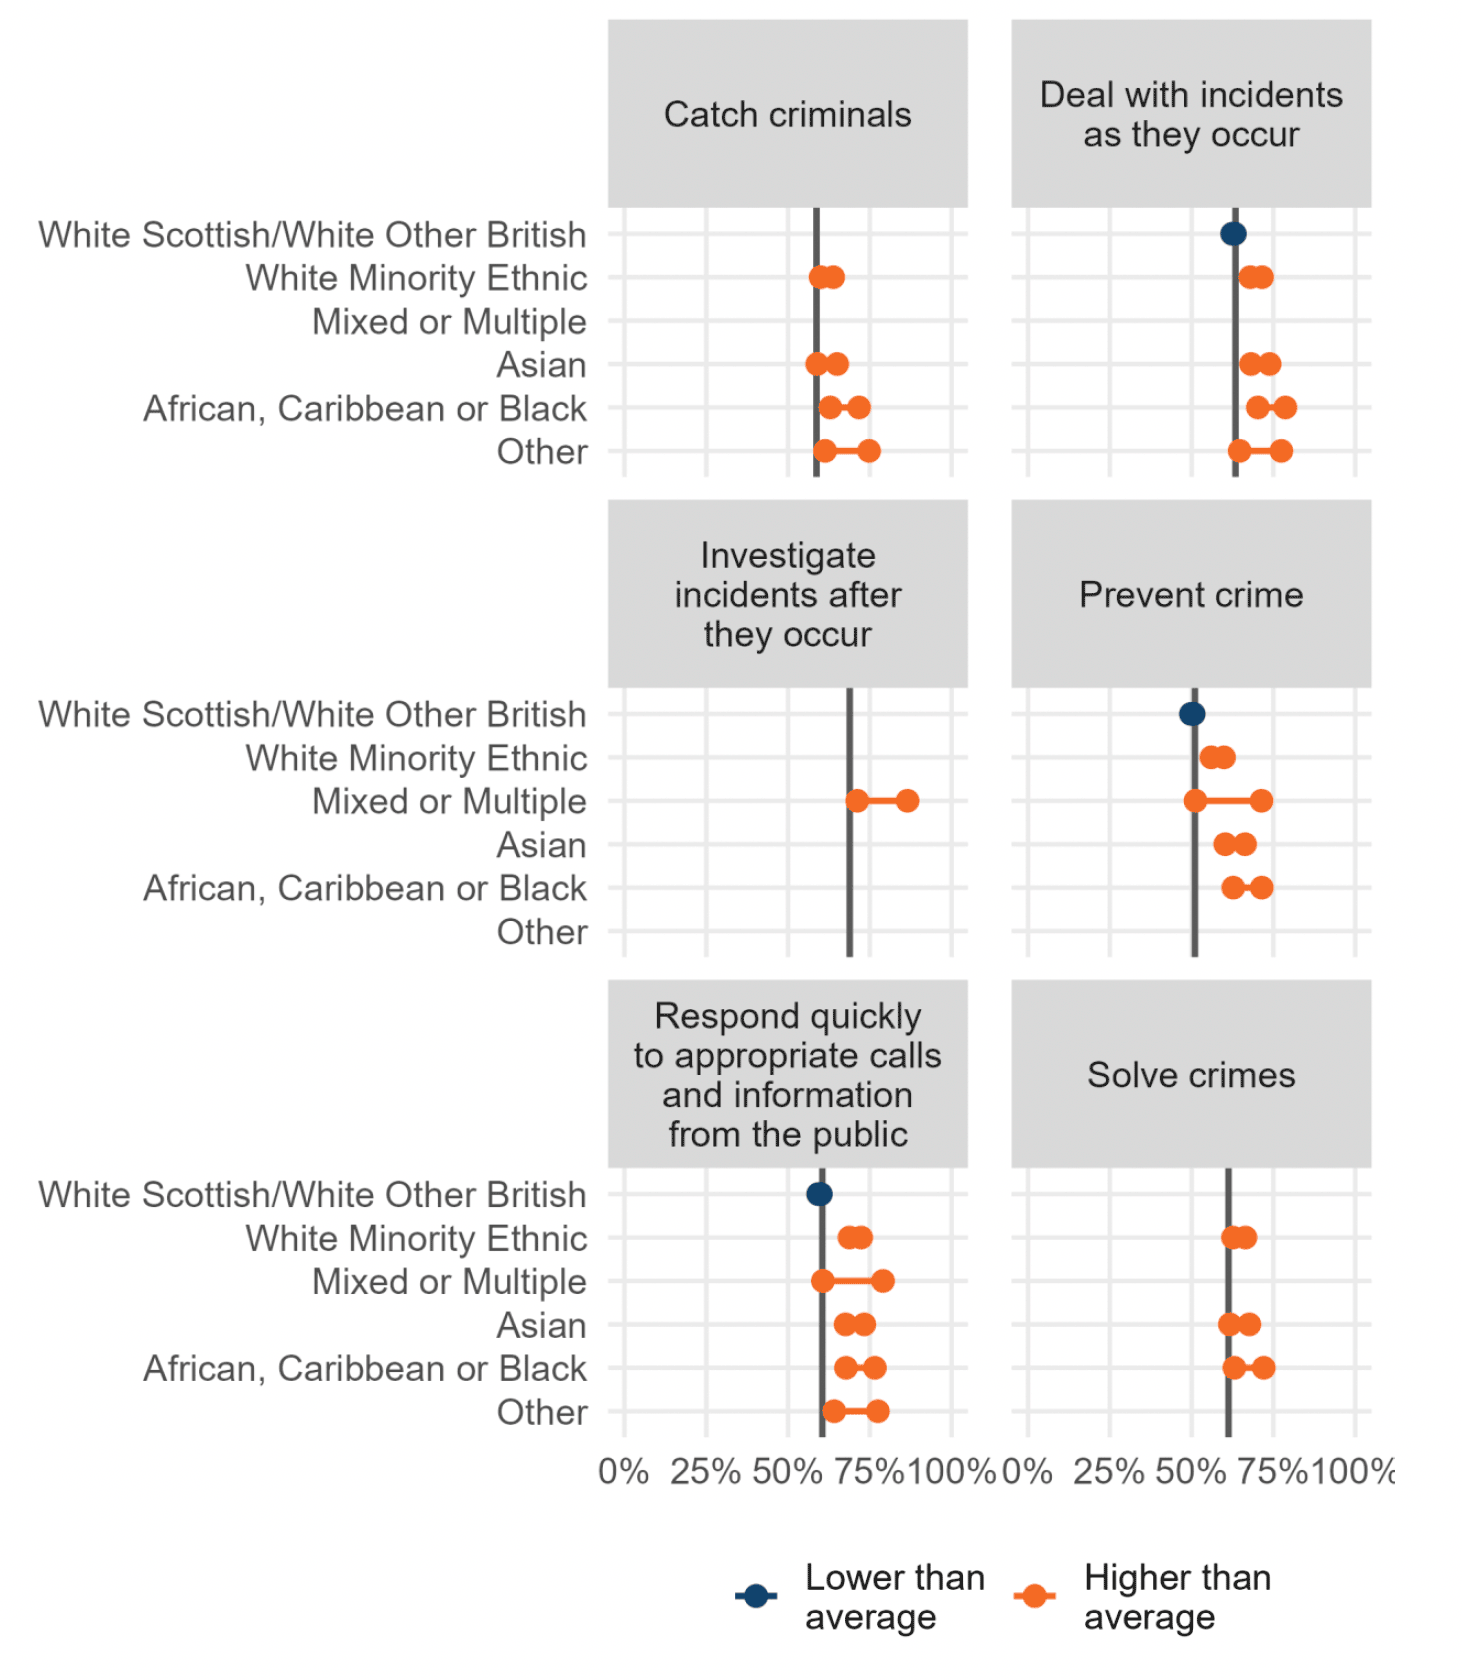
SCJS respondents were asked about their confidence in the police on six statements relating to measures in their local area. There were statistically significant differences in responses to all six statements by ethnicity as shown in Figure 2.7. Full results are in Appendix C: Table A2.6.
Respondents from minority ethnic groups tended to be more likely to hold positive views of the police, when compared to the national average. Across all six measures, those who identified as an ethnicity other than White Scottish/White Other British were either just as likely or more likely to be very or fairly confident than the national average.
White Minority Ethnic, African, Caribbean or Black and respondents who identifed as an Other ethnic group were statistically more likely to be confident in the police for five of the six measures. Asian respondents were more likely to be confident in four out-of-six measures compared to the national average. White Scottish/White Other British respondents were statistically less likely to be confident in the police for three of the six measures.
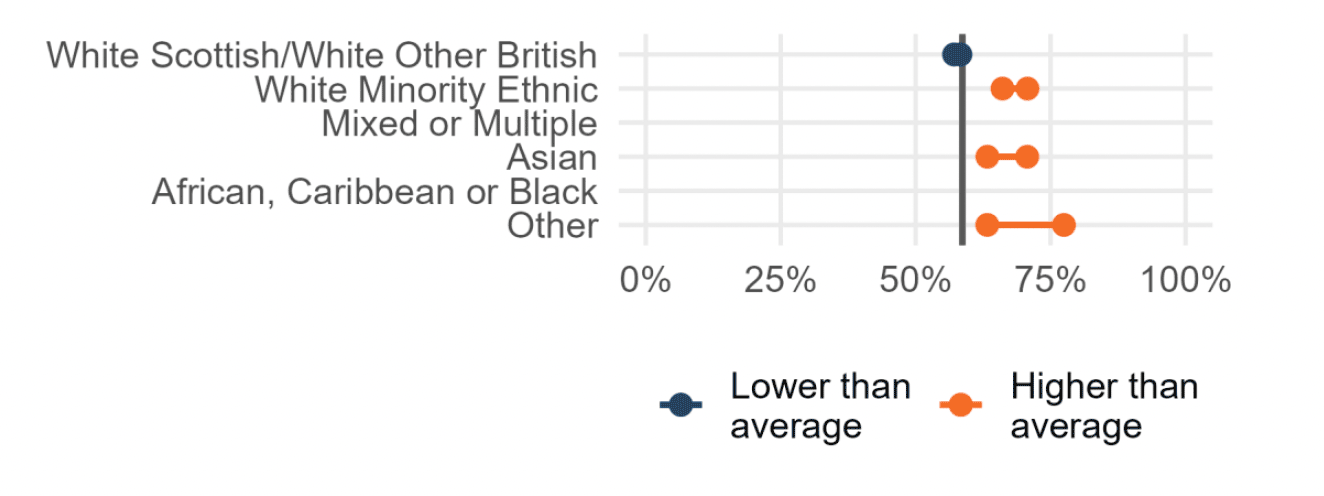
When asked “taking everything into account, how good a job do you think the police in this area are doing?” 59% of people said that the police were doing a good or excellent job (Figure 2.8). Those who identified as White Minority Ethnic (68%), Asian (67%),or Other (70%) were statistically more likely than the national average to say that the police in their area were doing a good or excellent job. People who identified as White Scottish/White Other British were statistically less likely to say that the police were doing a good or excellent job (58%).
Police interactions with community
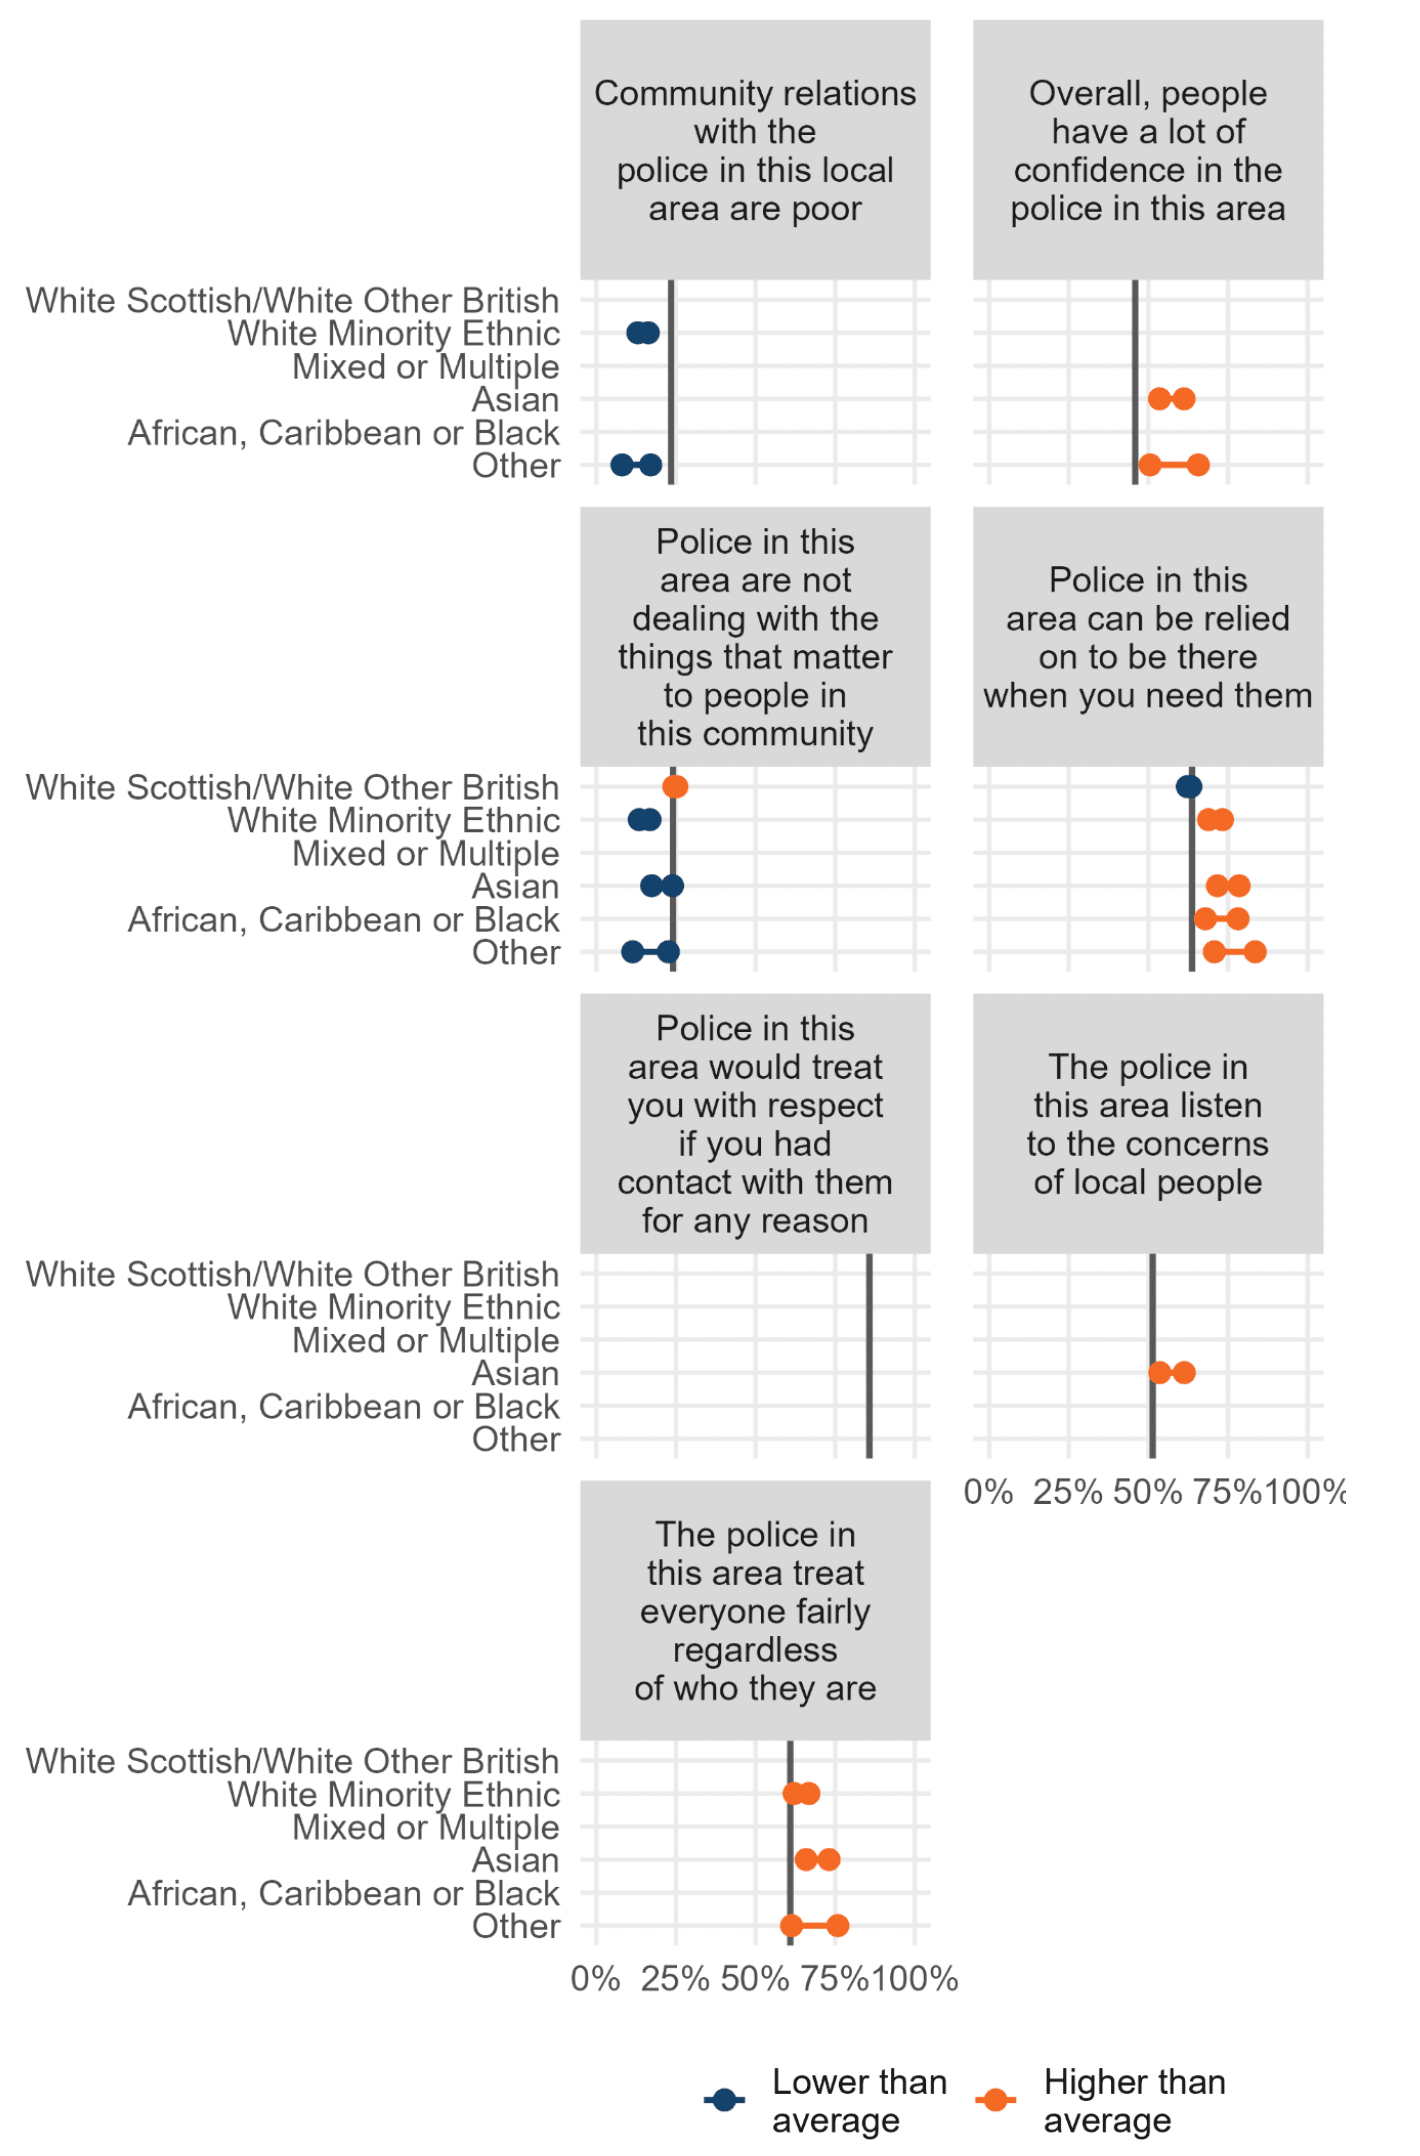
SCJS respondents were asked whether or not they agreed with seven statements relating to the police and how the police in their area interacted with the community. Full results are in Appendix C: Table A2.7.
Please note that the question is worded negatively for two of the seven statements, “community relations with the police in this local area are poor” and “police in this area are not dealing with the things that matter to people in this community”. Therefore, for those questions, a lower percentage agreeing is classed as a more positive response.
There were statistically significant differences in responses by ethnicity for six of the seven statements (Figure 2.9). Minority ethnic respondents were equally or more positive than the national average across all the statements asked. There were no statements where those from minority ethnic groups were more negative than the national average.
In particular, respondents who identified as both Asian and Other were more positive on five out of the seven statements asked about, whilst White Minority Ethnic respondents were more positive on four out of seven. White Scottish/White Other British respondents were more negative on two of the six statements than the national average.
Overall, 64% of people agreed that the police can be relied on to be there when you need them. Agreement with this statement was higher for those who identified as White Minority Ethnic (71%); Asian (76%); African, Caribbean or Black, (70%), and Other ethnic group (77%). Agreement was lower amongst White Scottish/White Other British respondents (63%).
Overall, 24% of people agreed that the police “are not dealing with the things that matter to people in this community”. Agreement was lower, and therefore perceptions more positive, for those who identified as White Minority Ethnic (15%), Asian (20%), and Other ethnic group (18%). Agreement was higher, and therefore perceptions more negative, for those who identified as White Scottish/White Other British (25%).
Personal interaction with the police
The questions above were asked of all participants in the SCJS, regardless of whether or not they had had any personal interaction with the police. Participants were also asked if they had personally had any contact with the police service in the last year. It should be noted that as the SCJS pooled sample combines responses to nine surveys, some respondents will have been answering questions relating to experiences in 2008/09 and others as late as 2019/20.
Overall, less than one third (31%) said they had had contact with the police service in the last year (Figure 2.10). This was higher for those who identified as a Mixed or Multiple ethnic group (44%) and lower for those who identified as Asian (26%) as well as an Other ethnic group (23%).
People who had had personal interaction with the police were asked overall if they were satisfied or dissatisfied with the way the police handled the matter, during their most recent contact in the last year. Overall two thirds (66%) of those who had contact with the police were quite or very satisfied with how the police handled the matter. There were no statistically significant differences in levels of satisfaction by ethnicity.
The vast majority of those who had had contact with the police said the police had been polite (93%) and treated them fairly (86%). There were no significant differences by ethnicity.
When asked how much interest the police had shown in what they had to say, over one quarter (28%), said the police had shown less interest than they thought they should show. This figure was lower, and therefore perceptions more positive for those identifying as White Minority Ethnic (20%.)
Perceptions of the Justice system
All SCJS respondents were asked how much they know about the Scottish criminal justice system in general. One fifth (20%) said that they know a lot or a fair amount. Those who identified as White Scottish/White Other British were statistically significantly more likely to say that they know a lot or a fair amount (21%). However, those from White Minority Ethnic (15%) and Asian (14%) groups were significantly less likely to say that they know a lot or a fair amount about the Scottish criminal justice system (Figure 2.11).
Participants were asked twelve questions about how confident they are in the justice system. These questions related to the operational functioning of the justice system, and the treatment of those who go through the justice system. There were statistically significant differences in responses by ethnicity for eleven of the twelve statements (Figure 2.12). Full results are in Appendix C: Table A2.8.
People from minority ethnic groups tend to have more positive views of the justice system than the national average, across a range of the questions asked. For nine out of the twelve measures, levels of confidence amongst minority ethnic respondents are either higher than, or equivalent to, the national average. Asian respondents were more likely than the national average to have confidence in seven out of the twelve statements about the Scottish criminal justice system. White Minority Ethnic respondents and respondents from Mixed or Multiple ethnic groups were more confident in five out of the twelve statements.
Respondents from African, Caribbean or Black and Other ethnic groups had more confidence than the national average in one statement only, that the Scottish criminal justice system deals with cases promptly and efficiently (55% and 52% respectively compared to the national average of 42%).
However, there are exceptions where those from certain minority ethnic groups have a more negative view of the justice system. These relate to the fairness and treatment of those accused of a crime, specifically that the justice system “allows all those accused of crimes to get a fair trial regardless of who they are” and “treats those accused of crime as ‘innocent until proven guilty’”. Both White Minority Ethnic and Asian respondents displayed lower levels of confidence in these statements than the national average.
Respondents who identified as White Scottish/White Other British were less confident in two out of the twelve statements, relating to efficiency and sentencing.
Overall, nearly three quarters (74%) of people are confident that everyone has access to justice that needs it. However, those who identify as White Minority Ethnic are less likely to be confident (71%).
Attitudes to Prisons
The SCJS also asks people about their attitudes towards prisons, covering topics such as their role within society more broadly and also how they operate. Of the five questions on prisons in the survey (Appendix C: Table A2.9), there was only one significant difference by ethnicity on this subject. Respondents from a White Minority Ethnic background were more likely to think that only those who have committed the most serious crimes should be put in prison (59% vs 51% nationally).
Attitudes to Community sentencing
Attitudes to community sentencing tend to be positive with little difference by ethnicity (Appendix C: Table A2.10). 90% of respondents agree that people should help their community as part of a community sentence rather than spend a few months in prison for a minor offence. Asian respondents are significantly less likely to agree (70%).
There is also strong support for those who are serving community sentences to be given support around issues such as addiction, mental health, literacy or numeracy to reduce the likelihood of them committing crimes in future (90%). Asian respondents are less likely to agree (77%).
Contact
Email: Justice_Analysts@gov.scot