Environment strategy: global environmental impacts of consumption and production
Independent report from the James Hutton Institute on behalf of the Scottish Government on global impacts of consumption and production in Scotland. This research is being used to inform the forthcoming Scottish Government environment strategy.
6. Types of Environmental Impacts
6.1 Land Use
Changes in land use have been driven by the sourcing of resources for a broad range of products requiring raw materials. Some such changes are direct conversions out of natural systems into unnatural uses, such as tailings dams for mining (see also Section 6.3), and others are indirect changes, such as forestry to agriculture (e.g. vegetable crops), and then to the production of oil palm (Elaeis guineensis).
An example of changes in land uses creating environmental and social consequences is that of mining systems such as copper and iron ore, which produce waste overburden, tailings and slags. For example, BGR (2020a) report that the land take of copper mining, in 2016, was 66km2, and where cobalt is a by- or co-product of annual changes in land use of 3km2, and Nakajima et al. (2017) estimate that between 1990 and 2010 an area of 34km2 was newly occupied by nickel mining.
Most processes of extracting and producing mined products trigger the dispersal of particulate matter into the atmosphere. This adversely affects the quality of air through the presence of microscopic solid and liquid droplet. Some particles can only be detected using an electron microscope, whereas others (e.g. dust, dirt, soot, or smoke) are sufficiently large and dark to be visible with the naked eye. Particles less than 2.5 micrometers in diameter (known as fine particles or PM2.5) pose greatest risks to human health, exposure to which can lead to premature death in people with heart or lung disease, nonfatal heart attacks, irregular heartbeat, aggravated asthma, decreased lung function, increased respiratory symptoms, such as irritation of the airways, coughing or difficulty breathing. PM2.5 are also the principal causes of reduced visibility (haze) (US EPA, 2023). Dust suppression actions such as sprinkling water on tailings and roads may be insufficient and are unlikely to have a role on mine-related traffic on dirt roads outwith mining concessions BGR (2020a).
Similarly, spatial concentrations of copper mines imply high levels of pressure on land uses, and thus displacement of previous land uses and associated impacts on environmental characteristics public goods linked to soil, vegetation, water and air quality. The land area required for copper production by open-pit methods is high due to the tailings dams and waste pits, often reflecting the level of waste material associated with low grade ore. BGR (2020a) report an estimate of 4,000 km2 of land used for copper production in 2011, and in 2016 new land disturbed for production of 66km2. They estimate an area of 3 to 6.5 m2 is required per tonne of copper produced.
The processes of mining certain raw materials, notably copper, iron ore and gold, have significant associated requirements for tailings. Such tailings of iron ore mining are high in other useful metals such as copper, nickel, and cobalt a proportion of which can be extracted but other potentially toxic elements (e.g. arsenic (As), cadmium (Cd), and lead (Pb)) are likely to contribute to adverse environmental impacts (Sirkeci et al., 2006). Such impacts of deposition of iron ore tailings are an increase in sediments in water, leading to contaminated solids in the water bodies; the deposition of air blown materials contaminating the water surface, soil and ground waters; pollution of soils due to water discharge, seepage, runoff from heaps, pits and mines directly into soils. Additionally, pollution of local soils can be caused by fuel spills, flotation reagents, cleaning solutions and chemicals used at the site (Thejas and Hossiney, 2022). Araújo et al. (2021) report risks to human health through ingestion, inhalation, and skin contact. Smith and Wentworth (2022) estimate that the total volume of tailings produced is doubling every 20 to 30 years, referring to them as “perhaps the most voluminous of the various wastes from mining and mineral processing”.
The absolute area of land used for mining activities does not of itself indicate adverse environmental impacts. Regulatory environments and assessments and mitigation of environmental impacts are more significant. However, BGR (2020b) reports that in south-east Asia nickel and cobalt mining is associated with clearing of rainforests, and note the lack of reclamation and renaturation post-mining activities. They report the failing of mine operators to meet such requirements and the significance of historical liabilities, and point to the spatial concentration of mining activities in the Congolese-Zambian copperbelt and interlinked nature of concession holders.
Changes in land use are also associated with restoration and remediation of land. Verplank et al. (2007) for the US Geological Survey reporting on contaminants associated with mining deposits note that in simple hydrogeological systems, “remedial actions can be observed on a scale of years, but in complex settings, where many natural and anthropogenic sources of metals and acidity are generated, downstream results of remedial actions likely will take longer.” Post-mining, the restoration of mine areas requires restoration of the area worked, revegetation, stabilisation of geochemical and geotechnical mine waste facilities. The extent and quality of site restoration can be expected to be influenced by local regulations and their enforcement, and the developer. For example, in countries such as Poland and Sweden (as producers of copper in Europe) the environmental regulations for the extraction of copper can be expected to be consistent with the European Union regulations and assessments of environmental impacts (European Parliament and The Council of The European Union, 2014).
Approximately 40% of ice-free land is in direct use for agriculture or urban settlements; 37% of ice-free land is embedded within agricultural and settled biomes; and 22% of land is natural or wildland (Ellis et al., 2010). The composition of agricultural land is, broadly, split between croplands (33%) and grazing (66%)(Ritchie and Roser, 2019). Crops for human consumption account for approximately 50% of the cropland area, and 25% to 30% for livestock feed.
Figure 3 shows the magnitude of Land use change between the year 1000 and 2023 (Our World in Data, 2024). Over those 1,000 years, the area of agricultural land has increased from 525.16 million ha to 4.8 billion ha, or 914%. Such an extensive land use has had a major impact on the earth’s environment, reducing wilderness and leading to the loss of biodiversity.

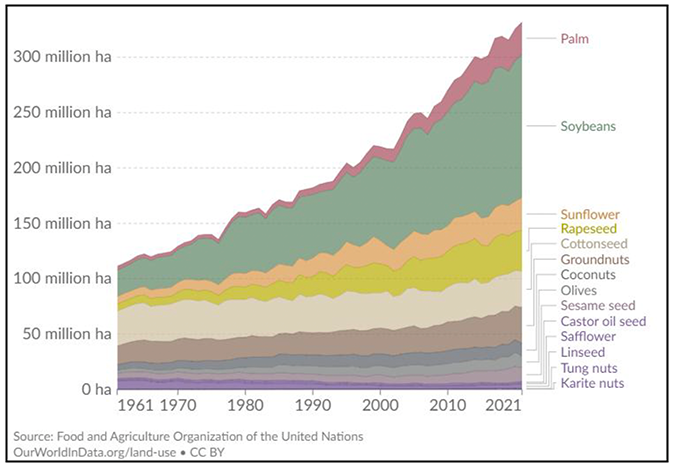
Over the last 60 years, the area of land required for producing vegetable crops has increased significantly, from 111.32 million ha to 337.62 million ha, or approximately 303% (Ritchie, 2021). Environmental impacts are created by production of subsequent products. For example, for olive oil, more than 80% of the environmental impact is pomace fertilisation, consistent with literature that olive pomace oil is the main residue of the extraction process, consisting of pieces of skin, pulp, stone, and olive kernel (Skaltsounis et al., 2015).
The largest expansion for vegetable crops has been In the area for soyabeans (from 23.8 million ha to 129.5 million ha between 1961 and 2021), alongside an increase from 3.6 million ha to 28.9 million ha in oil palm (Figure 4; Ritchie, 2021). The estimated area of land used for oil palm (Elaeis guineensis) globally is 19 million hectares (Mha) from which 72 million tonnes (Mt) is produced annually (estimated for 2018), representing 40% of all traded vegetable oils. However, this is a low land footprint compared to the next largest vegetable oil crops of soybean and rapeseed which yield a combined 84 Mt of oil but require a land area of over 163 Mha (Murphy et al., 2021).
Generally, the expansion of land for the production of palm oil is a change in land use from tropical forests. Pendrill et al. (2019) estimate that oil palm production has been responsible for approximately 2% of global tree loss. Potapov et al. (2017) calculate that oil palm has led to the loss of 0.2% of intact forests. However, the authors stress that the loss of intact forests (a subset of primary forests which are very rich sites of biodiversity and largely undisturbed by human activity) should not be confused with primary forest loss. Ritchie and Roser (2021) note that the area of greatest production of oil palm contain very limited areas of intact forest (Indonesia, 2.8%, and Malaysia, 0.2%) and so oil palm expansion in these areas would have a limited impact on this metric of the loss of global intact forests.
The IUCN Oil palm Task Force (Meijaard et al., 2018) report on the Roundtable on Sustainable Palm Oil (RSPO) certification scheme for palm oil suppliers, launched in 2004. This scheme covers sustainable production through impact assessments, managing high-value areas of biodiversity, not clearing primary forest and avoiding land clearance through fires. Deforestation where the RSPO certification scheme for palm oil suppliers is recognised is lower than elsewhere. However, only 19% of palm oil production is covered by the RSPO, and these areas tend not to cover older plantations which are where most tropical forests remain (Ritchie and Roser, 2021).
6.2 Biodiversity, Including Deforestation
Biodiversity outwith Scotland is impacted upon as a consequence of the provision of raw materials or inputs to production or consumption in Scotland. As noted in relation to palm oil, the evidence over adverse environmental impacts is principally in relation to land use change but not always as the primary driver of change.
Adverse environmental impacts on biodiversity may not be due to a direct set of actions. For example, primary drivers of deforestation, such as clearing for agriculture in the forms of grassland for grazing and small scale clearings (e.g. in Indonesia; Ritchie and Roser, 2021), may lead to opportunities for subsequent land use change, such as from agriculture to oil palm plantations (Gaveau et al., 2016). Ritchie and Roser (2021) note the differences in antecedent land uses of alternative vegetable oil crops, recognising that the loss of forest habitats in tropical areas will have a higher adverse environmental impact than allocating land in Europe. In turn the adverse environmental impacts will be significant on biodiversity, and increases greenhouse gas emissions and transfers their allocation to producer countries, and that reducing palm oil use would reduce such an impact and leave its uses for better alternatives (e.g. food products).
Crenna et al. (2019) report on the loss of habitats for endangered species, or insects, birds and bats as pollinators due to the sourcing of inputs to food products consumed in the European Union (Table 2). For each product the study provides examples of the types of pressures created by human interventions and the geographic areas within which such pressures are exerted. Scotland is a producer of most of the products listed, and a consumer of them all, and therefore linked to the environmental impacts identified. Springmann et al. (2018) note that the “food system is a major driver of climate change, changes in land use, depletion of freshwater resources, and pollution of aquatic and terrestrial ecosystems, through excessive nitrogen and phosphorus inputs.” Their findings show that between 2010 and 2050 “the environmental effects of the food system could increase by 50% to 90% in the absence of technological changes and dedicated mitigation measures.”
Crenna et al. (2019) also report that eight products contribute to more than 75% of total damage to biodiversity, using a model from 2016 (beef meat, 25%, pork meat, 19%, poultry meat, 8%, cheese, 7%, sunflower oil, 4%, butter, 4%, milk, 4% and eggs, 4%), with similar results when analysed for an older version of the model, albeit in a slightly revised rank order. They identify meat products and agricultural land use as key hotspots of impact on biodiversity.
Dimbleby (2021) observes that trade can reduce the environmental impact of the diet, giving an example of importing tomatoes from Spain generates less carbon than growing them in greenhouses in the UK due to the natural abundance of sunshine in Spain. Crenna et al. (2021) note that the “current European diet is affecting biodiversity both in Europe and on a global scale”, and that the principal focus of environmental impacts of food production on biodiversity is on the “transformation of natural land and its occupation for agricultural purposes”. They identify particular examples of types of environmental impacts as freshwater ecotoxicity and water use related to wine, ionising radiation related to coffee, and photochemical ozone formation related to cod, all products consumed in Scotland. They also note the need to consider other impacts related to food production and consumption systems. An example given is of the requirements of feed for fish aquaculture, creating pressures on terrestrial ecosystems, and generating nutrient emissions due to manure and feed spill and thus possibly leading to water eutrophication (e.g. Lima Junior et al., 2018).
Pesticides are extensively used in the production of raw materials for use in food and drink manufacturing processes, indicated in Table 2, above. In the cultivation and management of crops the consequences of dispersal can be the contamination of water courses leading to the decline in fish and amphibian populations, habitat degradation leading to loss of bird and insect pollinators (Crenna et al., 2020). They quantified the exposure to pesticides in the field and the ecotoxicity impacts on honey bees, the most economically important pollinator species worldwide (Rueppell and Kennedy, 2019), and demonstrate that nectar foragers are the most affected forager type for two types of pesticide.
| Products | Pressures generated by human interventions | Impacts on natural environment and biodiversity |
|---|---|---|
| Beef/pork/poultry meat | Land use change, e.g. in Brazil or in Europe, from natural areas into monoculture of soybean | Loss of habitats suitable for endangered species, e.g. black-faces lion tamarin and ring-tail monkey, or for helpful insects, birds, and bats as pollinators |
| Dairy products | Land use change, e.g. in Brazil or in Europe, from natural areas into monoculture of soybean | Loss of habitats suitable for endangered species, e.g. black-faces lion tamarin and ring-tail monkey, or for helpful insects, birds, and bats as pollinators |
| Tofu | Land use change, e.g. in Brazil or in Europe, from natural areas into monoculture of soybean | Loss of habitats suitable for endangered species, e.g. black-faces lion tamarin and ring-tail monkey, or for helpful insects, birds, and bats as pollinators |
| Salmon | Land use change, e.g. in Brazil or in Europe, from natural areas into monoculture of soybean | Loss of habitats suitable for endangered species, e.g. black-faces lion tamarin and ring-tail monkey, or for helpful insects, birds, and bats as pollinators |
| Eggs | Land use change, e.g. in Brazil or in Europe, from natural areas into monoculture of soybean | Loss of habitats suitable for endangered species, e.g. black-faces lion tamarin and ring-tail monkey, or for helpful insects, birds, and bats as pollinators |
| Oils | Land use change, e.g. in Brazil or in Europe, from natural areas into monoculture of soybean | Loss of habitats suitable for endangered species, e.g. black-faces lion tamarin and ring-tail monkey, or for helpful insects, birds, and bats as pollinators |
| Biscuits | Lan use change, e.g. in Indonesia, from natural areas into palm oil monoculture plantations | Loss of habitats suitable for endangered species, e.g. gibbons and Javan rhinoceros |
| Chocolate (coca beans) | Pesticides use | Contamination of water courses leading to fish and amphibian population’ decline, and habitat degradation, leading to birds and insect pollinators’ loss |
| Tea | Pesticides use | Contamination of water courses leading to fish and amphibian population’ decline, and habitat degradation, leading to birds and insect pollinators’ loss Contamination of water courses leading to fish and amphibian population’ decline, and habitat degradation, leading to birds and insect pollinators’ loss |
| Tomato | Pesticides use | Contamination of water courses leading to fish and amphibian population’ decline, and habitat degradation, leading to birds and insect pollinators’ loss |
| Fruit cultivation, e.g. apples, oranges, grapes | Pesticides use | Contamination of water courses leading to fish and amphibian population’ decline, and habitat degradation, leading to birds and insect pollinators’ loss |
| Coffee | Pesticides use | Contamination of water courses leading to fish and amphibian population’ decline, and habitat degradation, leading to birds and insect pollinators’ loss |
| Banana | Land use change, e.g. in Ecuador, from natural areas into monoculture banana plantations | Loss of habitats suitable for several species, from insects to mammals |
| Rice | Land occupation, e.g. in the EU and Mediterranean areas | Loss of habitats suitable for several species, from insects to mammals |
| Water Use | Loss of habitats suitable for several species, from insects to mammals | |
| Almond | Water Use | Loss of habitats suitable for several species, from insects to mammals |
| Cod | Sea bottom trawling | Loss of habitats suitable for several species, from insects to mammals |
| Overfishing | Loss of wild cod stock and disruption of the trophic chain | |
| Salmon | Nutrient emissions | Excessive algae blooms, eutrophicating marine and fresh water, thus leading to species composition change and disruption of the trophic chain |
| Shrimps | Nutrient emissions | |
| Agricultural commodities | Spread of invasive species due to commodities trade, e/g/ pathogens from Chine and the USA | Loss of helpful insects (e.g. pollinators) and crops, affecting food security |
The United Kingdom is a substantial importer of timber amounting to approximately two thirds of consumption. Scotland’s Forestry Strategy 2019-2029 (Scottish Government, 2018) sets out plans for woodland expansion and the roles of forests and timber in the Scottish economy. In Scotland, timber is used extensively for construction, wood fuel, pulp and paper, fencing, and furniture (Forest Research, 2023; SNIFFER, 2011a, b).
Klein et al. (2016) note the renewable nature of wood biomass as a raw product, but that the supply chain of wood biomass involves non-renewable energy inputs and thus possibly entailing environmental impacts. Environmental impacts of timber extraction and supply occur throughout the wood supply chain from harvesting, sawmills to final products and their disposal (Adhikari and Ozarska, 2018).
Electricity produced from wood is classified as renewable, however questions arise regarding timescales over which that is accounted and the nature of the sources of raw materials (Abt, 2015). In 2022, the UK imported 7.5 million tonnes of wood pellets (Forest Research, 2023), predominantly from the USA and Canada. Primarily these are used for fuel but some are for animal bedding and litter (e.g. for horses and cats). Per unit of electricity, the burning of wood can produce more greenhouse gases than burning coal, generated. The Office for National Statistics (2019) note that harvesting and burning trees for energy creates a carbon debt “in which carbon is removed from a sequestered state (trees) and emitted to the atmosphere. Regrowth of the forest determines the carbon payback period, or the amount of time until the forest has re-sequestered the same amount of carbon as what was emitted through burning for energy.”
As noted in Section 6.1 adverse environmental impacts, such as the loss of biodiversity, can be expected if the intact forests, never previously harvested, or primary forests are affected by the sourcing of wood for fuel. Certification schemes such as that of the Forest Stewardship Council (FSC) provide some assurance over the sustainability of sources of such raw materials. Leturcq (2014) concludes that it is better to use wood to store carbon rather than use it as a fuel. Within the UK, forestry operations are required to adhere to the UK Forestry Standard (Forestry Commission, 2017). The Standard covers key elements in sustainable forest management of biodiversity, climate change, historic environment, landscape, people, soil and water. The guidelines to be applied for Environmental Impact Assessments of new woodlands, and approval for grant support. These guidelines are an indication of the broad types of environmental impacts that can arise. It notes that “at the international level, criteria necessarily give weight to some issues (such as protection from landslip, avalanche and fire) that are globally or regionally important, but not necessarily critical in the UK.”
Factors influencing the nature of the environmental impacts will include the climatic conditions of the source (e.g. tropical, boreal), site characteristics of the tree crop (e.g. soil type, antecedent land use, proximity to water courses), species of tree, means of harvesting, processing and transportation. The Climate Change Committee (2018) proposes that the amount of biomass used by the UK should be constrained by the supply of low-carbon sustainable feedstocks.
B etween 1990 and 2008, 53% of global forests were cleared to produce agricultural commodities (European Commission, 2013). Between 2000 and 2012, 71% of deforestation in tropical areas was driven by commercial agriculture (Forest Trends, 2014), 70% in Latin America and 33% in Africa (FAO, 2016). Dimbleby (2021) also notes such losses in the environmental balance sheet of the impacts of importing beef from Brazil compared to its production in the UK, with a carbon footprint almost twice as large as that of UK beef reflecting, in part, the clearance of forests in Brazil in favour of livestock grazing.
The UK Parliament Environmental Audit Committee (2023) reach a related conclusion that “potential negative impacts that increased UK and global demand could have on the planet’s most ecologically sensitive and biodiverse forests, it is right that the UK should do more to meet a higher proportion of its timber consumption through domestically grown timber.”
No reporting is available of the environmental risks associated with timber which is subsequently imported to Scotland or the UK. However, the Sustainable Trade Initiative, 2020 report that of the primary and secondary imports to the EU 27 and UK, 31% to 36% were sourced from semi-and natural tropical forests which have certified timber production and distribution, such as by the Forest Stewardship Council. For certification to be awarded, evidence is required by the supplier that their processes adhere to these principles, one of which is “Maintain, conserve and/or restore ecosystem services and environmental values of the Management Unit, and shall avoid, repair or mitigate negative environmental impacts”. A reasonable assumption is that over 60% of timber imported to the UK is from sources which adhere to those certification principles.
Martino et al. (2023) discuss the role of mandatory due diligence in relation to environmental issues and its adoption by countries such as France, Germany and Japan. In a review of potential policy levers, they note the pilot guidance on how organisations can evaluate and manage nature-related risks in governance, strategy, risk management, metrics and targets prepared by the Taskforce on Nature-related Financial Disclosures (TNFD). This is in line with the European Union proposal for a Directive on corporate sustainability due diligence (European Commission, 2022). Such a Directive would require companies to “identify and, where necessary, prevent, end or mitigate adverse impacts of their activities on human rights, such as child labour and exploitation of workers, and on the environment, for example pollution and biodiversity loss.” It aligns with the ‘high impact.’
Research is being carried out on improving information of the provenance of wood commodities such as microsatellite markers, biometric fingerprint systems, DNA fingerprinting, and access to such information using QR and bar codes (Kaulen et al., 2023). A challenge which arises is the monitoring and validation of such data, and user (e.g. purchaser) understanding of what the information is providing.
Mapping of the distribution of natural capital of the Amazonia region using earth observation imagery provides insights to biodiversity priority areas, forest biomass and carbon stocks, endemic species, forest cover and loss, and climate mitigation vulnerability to future deforestation. Conservation International (2015) estimated that between 2010 and 2014 deforestation had led to the loss of approximately 13% of the region’s original forest cover. One cause of such deforestation is iron ore mining in Brazil which leads to demand for charcoal as fuel and reductant for the production of pig iron, some of which is used for steel making, foundries, alloy making, in automotive castings and other iron based castings, in turn driving the expansion of tree plantations and the loss of native forests Sonter et al. (2017). Estimates of greenhouse gas emissions arise from the production of iron, and in its use in processes of making steel vary. Figures available on CO2 emissions associated with the production of steel range suggest 1.8 to 2.2 tonne CO2 per tonne of liquid steel (Shahabuddin et al., 2023). A study by CSIRO showed that partial substitution of coal coke by charcoal could reduce net CO2 emissions by 32% to 58% from production using a blast furnace basic oxygen furnace (BF-BOF), and between 6% and12% for electric arc furnaces (EAF) ( Mathieson et al., 2011). Note that these figures are not specific to the case of deforestation for the provision of charcoal. They also take no account of consequences of substituting coal with charcoal sourced from plantation forests, or how they may relate to certified emissions reduction credits under the Kyoto Protocol’s Clean Development Mechanism (United Nations, 1997; Sonter et al., 2015).
Seki (2022) studied the environmental impacts of mining on ecosystem services. In their systematic review of 2,093 studies, 99.8%, reported some form of negative impact of mining on biodiversity and ecosystem services. Of those 95% reported direct impacts, and only 5% reported indirect impacts. The most important impacts created by the addition of materials to the environment were surface water contamination (51.0%), soil contamination (48.1%) and bioaccumulation (35.0%), with habitats (12.1%) the most reported source impact. A very small number of studies (0.2%) reported positive environmental impacts, primarily relating to the establishment of water bodies for mining operation but which attracted freshwater biodiversity.
The Conservation International identify 36 biodiversity hotspots across the globe (Hoffmann et al., 2016). UNEP WCMC summarise these as containing at least 1,500 species of vascular plants found nowhere else on Earth (known asendemic species), and having lost at least 70% of its primary native vegetation. Seki (2022) and Luckeneder et al. (2021) identify 15 biodiversity hotspots which are adversely impacted upon by mining. Such hotspots comprised conservation areas, vegetation cover, land use change, wildlife habitats, threatened and endemic species, coral reefs, and forest carbon stocks. Seki (2022), Durán et al. (2013) and Luckeneder et al. (2021) all report that biodiversity hotspots were most vulnerable to the extraction of gold, copper, lead, zinc, coal, iron, silver, uranium, and nickel. The analysis of Luckeneder et al. (2021) indicates the types of biomes which are most affected by the mining of a range of types of metals (Figure 5). They report when all biomes are ranked according to their species richness, five of six terrestrial biomes jointly were the origin of 79% of total metal ore extracted in 2019. They also note that since 2000, metal ore extraction has increased by a factor of 2.1 in the biome which is richest in species which is tropical and subtropical moist broadleaf forests.
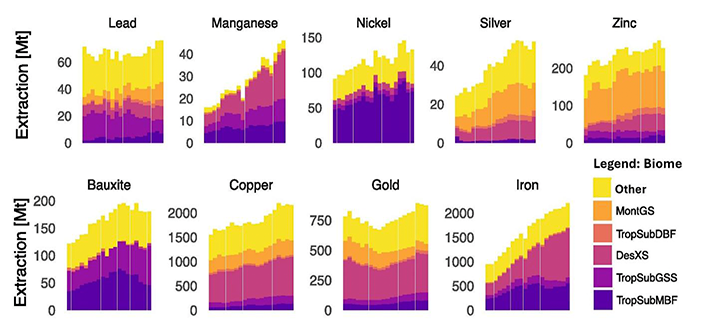
As stated elsewhere in this report, the specific origins of materials used in the Scottish economy have not been identified, but all of these metals are used in it to some extent and thus it is reasonable to assume that there is some association with the types of environmental impacts on the biomes as reported by Luckeneder et al. (2021) and other authors.
Adverse impacts on biodiversity arise beyond the boundaries of mining leases. Sonter et al. (2018) in a study of mining induced deforestation in Brazil report the loss of forests up to 70 km outwith mining leases leading to 11,670 km2 of deforestation between 2005 and 2015. That would represent 9% of loss of the Amazon forest during that time period, and 12 times more deforestation than occurred within mining leases. Impacts on water quality include Acid Mine Drainage (AMD), occurring when sulphur-containing minerals found in ore deposits oxidize through contact with air and water, in turn potentially polluting surface and ground waters and toxic to vegetation (Udayabhanu and Prasad, 2010).
6.3 Water, Air and Soil Pollution
The nature of interrelationships between water, air and soil, are such that environmental impacts on one of these aspects of the biosphere are likely to have implications on the others. The types of environmental impacts summarised below are those linked to the provision of raw materials that are significant for the Scottish economy based on the reviews of SNIFFER and Conde et al. (2023).
6.3.1 Phosphate Rock
Phosphate rock is a non-renewable resource. Its mining requires significant quantities of scarce resources (e.g. water, energy), and contributes to water, air and soil pollution, GHG emissions, landscape degradation and solid waste generation (de Ridder et al., 2012). Of its overall production volume, 83% (46 Mt P2O5) is used for chemical fertilizers, which, together with Nitrogen and Potassium, are the three major macronutrients required by plants(Giessler et al., 2018). The remainder is used for other industrial purposes, such as animal feeds, production of steel, rust removers, corrosion preventers, water softeners, soaps, dishwasher tablets and in some detergents (Royal Society of Chemistry, 2023). White phosphorus is used in flares and incendiary devices, and red phosphorus is used on matchboxes for the lighting of safety matches. Phosphates are also used in the production of special glasses and fine chinaware.
Phosphate rock is predominantly found as sedimentary marine phosphorites, the largest deposits of which are in northern Africa, China (41%), the Middle East (in particular Morocco, 17.3%) and the United States (98%)(US Geological Survey, 2022). SNIFFER (2011a, b) reported that the UK imports 100% of its phosphorus rock, primarily from Morocco (42%), China (26%), and the USA (7%). Its mining requires significant quantities of other scarce resources (e.g. water, energy), and contributes to water, air and soil pollution, GHG emissions, landscape degradation and solid waste generation (de Ridder et al., 2012).
McDowell et al. (2024) report global estimates of the overapplication of phosphorus fertilizers at 30% to 40% relative to crop and grassland requirements. The US Environmental Protection Agency report that “in excess quantities, phosphorus can lead to water quality problems such as eutrophication and harmful algal growth”, an issue also identified by the UK Environment Agency (2019). The US EPA also note that “since phosphorus generally occurs in small quantities in the natural environment, even small increases can negatively affect water quality and biological condition” (US EPA, 2024).
The Royal Society of Chemistry (2023) report that the over-use of phosphates from fertilisers and detergents can lead to pollution of rivers and lakes, and the rapid growth of algae (algae blooms). When algae dies, oxygen in the water is consumed, the loss of which ultimately makes it impossible for aquatic life to survive (US EPA, 2024).
The value of phosphorus is also leading to newer areas of extracting resources being identified and exploited such as the sea floor. For example, additional reserves have been identified in the seabed with some licences granted for exploration (Edixhoven et al., 2013). The potential environmental impacts are reported as being seabed ecosystems, release of toxic elements during the mining process, ambient noise, anthropogenic light, biodiversity loss at a local scale (Miller et al., 2018).
6.3.2 Rare Earths
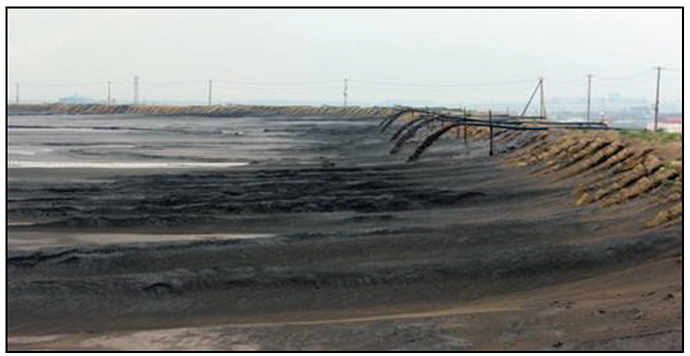
Rare earths are critical to high technology and transitions to a low carbon economy. There applications include neodymium for magnets for use in motors or generators, and are used in wind turbines and electrical vehicles, low-energy lightbulbs and mercury lamps; and, hydride batteries used in hybrid cars, smartphones, photovoltaics, and materials for the storage of hydrogen for use as a fuel (Royal Society of Chemistry, 2023, online). Rare earths are mined using open cast methods, with a ratio of waste to ore of approximately 8:1 (e.g. Mountain Pass mine, California, USA). Those waste dumps have adverse impacts on water, soil and air quality, and replace antecedent land uses. The mining process includes removal of ion adsorption clays across the mining area for dump and tank leaching which is described as having a significant impact on a large area of “natural space that should be followed by comprehensive restoration, but not always is, particularly in cases of illegal mining” (BGR, 2020b). The BGR (2020c) also report that the mining areas of the largest areas of deposits in China (Longnan and Gupo Mountain), extend across 35km2 and 50km2 respectively, and that the Bayan Obo mine in China is the world’s largest source of rare earths, with waste dumps extending to 11km2 (Figure 6; Huang et al., 2016).
Global markets for lithium are dominated by batteries (80%), ceramics and glass (7%) (US Geological Survey, 2023a). Batteries requiring lithium are well-established such as lithium-ion, and emerging technologies such as lithium-air or lithium-sulphur, and large capacity batteries for storage of energy generated by renewable technologies (Flexer et al., 2018).
Lithium metal is used in alloys with aluminium and magnesium which increases their strength and reducing their weight (e.g. for aircraft, high-speed trains, bicycle frames). Lithium oxide is used in special glasses and glass ceramics, and Lithium chloride is used in air conditioning and industrial drying systems. Lithium hydride is used as a means of storing hydrogen for use as a fuel (Royal Society of Chemistry, 2023).In 2022, principal mine production of lithium was from Australia (61k tonnes; 46.9% of world production), Chile (39k tonnes; 30%) and China (19k tonnes; 14.6%) (US Geological Survey, 2023a).
Approximately two thirds of global production of lithium is by extraction from lithium rich natural brines. From these, an average of half a million litres of brine is required per ton of lithium carbonate (Flexer et al., 2018; Stamp et al., 2012). The extraction process is chemically and water intensive, slow, and produces large volumes of waste (Flexer et al., 2018). Gutiérrez et al. (2022), in a study of the lithium extraction in the brines (salares) in the Chilean Andes, report “negative changes in water quality, vegetation structure, and the distribution of local flora and fauna,” in particular noting the threats to three species of flamingo. Almost all other lithium extraction is from ores, predominantly from open cast mines. Those mines have a ratio of waste to ore of between 3:1 and 10:1. Adverse environmental impacts of open cast mining include complete loss of existing habitats and topsoil, rocks, changes in water pathways, water contamination, generate air emissions and deposition, and the production of waste (Kaunda, 2020; Rodrigues et al., 2019; Schomberg et al., 2021; Parker et al., 2024).
Based on estimates of the government of Western Australia, the world’s leading producer (46.9% share) along Chile (30%) and China (14.6%), approximately 4m2 of land is required per tonne of lithium carbonate ore in temperate climate zone, and up to 12 m2 to 13m2 per tonne in semi-arid areas. However, BGR (2020d) note that the process of extraction from pegmatites does not result in sulphate mineralisation, and that the risk of ground or surface water acidification is low, and that in the semi-arid area environmental impacts and conflicts with other land users is low.
Indium has characteristics which make it a valuable element in the manufacturing of liquid crystal displays, touch screens, flatscreen TVs and solar panels (Royal Society of Chemistry, 2023). The environmental impacts of Indium are principally associated with the recycling or reuse or disposal of such goods. To date, there is little recycling of indium, the processes of which are being developed and tested (Anić Vučinić et al., 2023).
6.3.3 Metals
Tin
The German Federal Institute for Geosciences and Natural Resources (BGR), for tin (BGR, 2020e), report that “mining can impair or negatively affect valuable natural or cultural assets. This is most obviously the case in Indonesia, where large areas have been damaged by gravel pump mining on land and by off-shore extraction from the seabed.” They note that, generally, veins of tin ore are mined underground, but can also be extracted in open-pit mining near the surface and when heavily weathered. They quote the International Tin Associated that in 2010, c. 56% of global tin production is from underground mining and 6% from open-pit hard rock mining, and 38% from on- and offshore placer mining (International Tin Research Institute, 2017). The open-pit form of mining has the most significant environmental impacts on land use and habitats through the requirement for external waste dumps to be located close to operational areas of extraction (US Geological Survey, 2023b).In some regions, mechanical dredging methods are used, such as suction dredging or excavation of the seabed. In 2010, this was estimated to be the source of 20% of global tin production. In Indonesia, industrial dredging is only allowed beyond 2 km from the shore, opening opportunities for artisanal offshore mining within this zone. Ecosystems affected include corals, mangroves, and seaweed, with an assessment that the biodiversity would “only be possible after a long period of time, if at all.” (BGR, 2020e).
Iron ore
Iron is used in the manufacturing of steel for use in civil engineering (e.g. reinforced concrete, girders) and manufacturing (Royal Society of Chemistry (2023). Steel is made from iron ore, limestone and coke, and scrap steel where it can be accommodated by the production process. Scotland has significant economic sectors which are major users of steel, principally shipbuilding, construction, aerospace, energy (including oil and gas) and general manufacturing (Hall and Davis, 2020). In 2017, the total turnover of these sectors in Scotland was £74.9bn, equating to 31.2% of turnover of the Scottish economy that year.
The extraction of iron ore directly or indirectly creates environmental impacts on natural resources such as air, water, habitats and land use (Thejas and Hossiney, 2022). A significant product of iron ore benefaction is iron ore tailings, with the processing of the ore involving milling and grinding, generating waste tailings in the form of slurry. The failure of infrastructure such as a tailings dam can lead to considerable adverse environmental impacts. Smith and Wentworth (2022), citing several sources (e.g. Escobar, 2015), note the environmental impacts of the collapse of the tailings dam at the Samarco Germano iron ore mine, Mariana, Minas Gerais, Brazil in 2015. These include the release of 50 million m3 of materials creating short and long term ecosystem impacts over 600 km of the Rio Doce river, in addition to the loss of lives. Other environmental impacts associated with iron ore mining are nitrous oxide affecting air pollution, sulphur dioxide from equipment, CO and CO2 emissions, and impacts of heavy metals on water quality.
Lead
Singh and Li (2014) report that ‘in the metal industry, production of lead, causes the greatest degradation of the environment’, with its mining producing large amounts of waste, reflecting the small fraction of ore per unit volume. Singh and Li (2014) also note that the process of smelting lead releases large quantities of Cadmium and Lead into the environment, and gaseous pollutants (e.g. CO2, SO2, NOx), particulate matter emissions, and solid wastes. The level of such pollutants can be expected to be moderated by the technologies available at mines and processing plants, and the regulatory environments applying for those sites. No data has been sourced to indicate the proportion of those lead imports that are for use in Scotland. However, in their report of 2011, SNIFFER note that “Lead is widely recycled in Scotland and typically recovered during demolition of older buildings and removal of old pipe work.”
The US Geological Survey notes that the substitution by plastics has reduced the amount of lead used in applications such as cable coverings, solder and pipes (US Geological Survey, 2023c). Although such uses have been banned in the UK (e.g. pipes, paint), lead it is still used to store corrosive liquids, in car batteries, pigments, ammunition, cable sheathing, weights for lifting, weight belts for diving, lead crystal glass, radiation protection and in some solders (Royal Society of Chemistry, 2023, online). All of those uses are present in production or consumption in Scotland.
Copper
Copper is a critical material in electrical equipment (e.g. wiring, motors). It is used in construction (e.g. roofing, plumbing), and industrial machinery (e.g. heat exchangers) (Royal Society of Chemistry, 2023, online). It is also a key material in equipment for tackling climate change through renewable energy sources, notably photovoltaics (2% of Copper Indium Gallium Selenide; Vijayan et al., 2022) and wind energy.
The environmental Impacts of copper extraction will vary by geographical source. For example, the copper mines in Chile and the USA are in arid environments which are likely to have a relatively low range of species of flora, fauna and avifauna compared to the tropical mining regions such as Indonesia, Zambia and Papua New Guinea (BGR, 2023a). As noted above in relation to iron ore, when mine facilities fail, notably tailings dams, the impacts on humans and environmental damage can be considerable. Dam failure at Mt. Polley, Canada (August 2014) led to 25 Million m3 of tailings material and waste water into nearby lakes.
The German Federal Agency for Earth Sciences and Raw Materials (BGR, 2020a) estimates that approximately half the world’s copper production is in areas with water stress, with approximately 0.5m3 of water is abstracted per tonne of copper (Gunson, 2013). They note that is not causal but that there are significant uses of water in copper mining, notably in ore benefaction (i.e. removal of worthless materials that is closely bound to the mineral), estimated at 70% of water used in Chilean copper mining.
The land area required for copper production by open-pit methods is high due to the extent of tailings dams and waste pits, often reflecting the level of waste material associated with low grade ore. BGR (2020a) report an estimate of 4,000 km2 of land used for copper production in 2011, and in 2016 new land disturbed for production of 66km2. They estimate an area of 3 to 6.5 m2 is required per tonne of copper produced. Therefore there are adverse environmental impacts on antecedent land uses and their associated habitats.
6.4 Environmental Impacts Created by Production of Particular Commodities
The production and consumption of some commodities has a very broad range of environmental impacts. Three examples follow for which some of the environmental impacts are described for different types of commodities.
6.4.1 Sugar
The UK consumes approximately 1.7 million tonnes of refined white sugar annually. UK sugar refiners produce 1.1 million tonnes of beet sugar and 400,000 tonnes from UK based cane sugar refiners. The UK also imports approximately 500,000 tonnes of refined sugar from the EU, primarily sugar beet (UK Government, 2020). The environmental impacts associated with Scotland’s sugar consumption are embedded in, and dependent, on the food and drink industry rather than the sugar production and refinement industry. Refined sugar is the product (such as white sugar, brown sugar, corn syrup) that has been processed from plants such as sugar cane, beet or corn (Eggleston and Lima, 2015).
In a UK based study exploring environmental impacts in 13 sugar beet product scenarios, Tzilivakis et al. (2005) found that the principal environmental impacts were: energy consumption, carbon dioxide emissions, nitrogen leaching, loss to denitrification and pesticide ecotoxicity. In a systematic literature review, El Chami et al. (2020) explored the environmental and socio-economic impacts of sugar cane production on ecosystem services. They found that the agricultural processes involved in sugarcane production led to negative impacts to water, air, soil, biodiversity and human wellbeing (El Chami et al., 2020). Land use changes for sugarcane production (e.g. deforestation of rainforest ecosystems for agricultural use) lead to reduced biodiversity and soil biodiversity, negative environmental externalities such as poor air quality (due to sugarcane burning), increased GHG emissions, depletion of nutrients, acidification, eutrophication, water quality deterioration, and stresses on water resources (El Chami et al., 2020). South Africa is an example of a geographic area where abstraction of water for irrigation of sugarcane production is a high proportion of total abstraction (e.g. 9.8%).
In a study using data provided by the Örtofta Sugar Factory (southern Sweden), Garcia Gonzalez and Björnsson (2022) studied the emissions and environmental impacts from white sugar production made from sugar beet as well as the byproducts (molasses and beet pulp), using data from a major EU producer (Nordic Sugar) to carry out a life-cycle assessment. They highlight the multiple levels which require to be considered when looking at the environmental impacts of sugar such as the cultivation of sugar beet, production of refined sugar, production of sugar based biofuels and the byproducts from production processes (e.g. in feedstock). They also note that sugar from sugar beet is used for human consumption and the production of biofuels.
The environmental impacts discussed were those of the potential contributions to global warming, eutrophication, and emissions of particulate matter from sugar beet production and processing. Their analysis of the data for south Sweden shows that 56% of the global warming potential was a due to sugar production (refining) and 44% due to sugar beet cultivation. These findings reflect the use of fossil fuel in production processes, atmospheric emissions from cultivation of the soil, agrochemical production, diesel use in transport and machinery use (Garcia Gonzalez and Björnsson, 2022, p6). Sugar beet cultivation accounted for 99.7% of the freshwater and marine eutrophication potential, while sugar production accounted for only 0.3%. This was primarily due to biogenic soil emissions such as nitrogen leakage. Of particulate matter emissions, 67% were due to sugar beet cultivation while sugar production accounted for 33% of the impact. This was primarily due to agrochemical production, energy used in production processes and diesel used in cultivation (Garcia Gonzalez and Björnsson, 2022, p7). Therefore, sugar beet cultivation was the main driver of the environmental impacts found.
6.4.2 Energy
In 2021, the UK produced approximately 420 million barrel of oil equivalent (BOE), principally from its North Sea reserves (North Sea Transition Authority, 2022). The Scottish Government report that, in 2019, 77.2 million tonnes of oil and gas were produced, which were attributable to Scotland, equivalent to 551.2 million BOE (Scottish Government, 2023a), with the value of exports increasing from £1.3 bn to £3.4 bn. This is consistent with the UK contributing to the transition of EU Member States away from Russian sources of oil and gas. National Statistics (2022) report that in October 2021 gas became the largest component of non-EU fuel imports to the UK. However, overall, the UK is a net importer of oil and gas, and Scotland an exporter and importer of energy, both for fossil fuels and renewable energy. In 2021, the UK imported £19.6 bn of gas compared to £4.8 bn in 2020.
In part this reflects the magnitude of demands of the UK economy, the types of oil products, much of which are refined outwith the UK, and the timing of demand for energy (e.g. electricity). Similarly, much of the requirements of the Scottish economy are sourced from the UK or further afield. As such, the energy imported by Scotland inherits the environmental footprints and impacts of production beyond its borders. That will include electricity generated by gas, coal and nuclear elsewhere within the UK, including that imported from France which of which 71% (in 2019) is generated by nuclear means (International Energy Agency, 2023).
Similarly, the oil and gas imported, and exported, has environmental impacts associated with its extraction. Those environmental impacts include adverse consequences on air pollution quality, water quality and biodiversity due to land use change, offshore drilling, or transporting raw materials, and risks of industrial accidents of spillages and leaks. Cordes et al. (2016) identify the types of environmental impacts which are associated with offshore oil and gas extraction in depths of over 200m. They list principal risks of impacts as sediment resuspension and burial (due to anchors and pipelines), low toxicity oil based drilling muds and produced water, and ecological impacts at species and community levels. Similarly, refining processes lead to emissions subject to local regulations the details of which vary by jurisdiction.
As noted in Section 6.3, for the production of renewable energy several non-ferrous metals are required in wind turbines and related technologies. Environmental impacts are created from the extraction of those materials (e.g. lithium, cobalt, copper). Over 20 years the generation of renewable electricity in Scotland has increased from 3.3 GW installed capacity in 2003 to 14.2 GW in March 2023. In 2022, Scotland exported 20.3 Twh electricity and imported 1.5 Twh (Scottish Government, 2023b). The imports smooth the variability of supply through the day, and the year. Public policy is to generate at least 20 GW of additional renewable electricity capacity by 2030 (Scottish Government 2023c), with a commensurate increase in demand for equipment, such as wind turbines. As such, the associated demand for components that require metal ores will continue to increase with consequential environmental impacts in source regions (see Section 6.3). No estimate is available for the magnitude of the materials required, or of the extent of environmental impacts created.
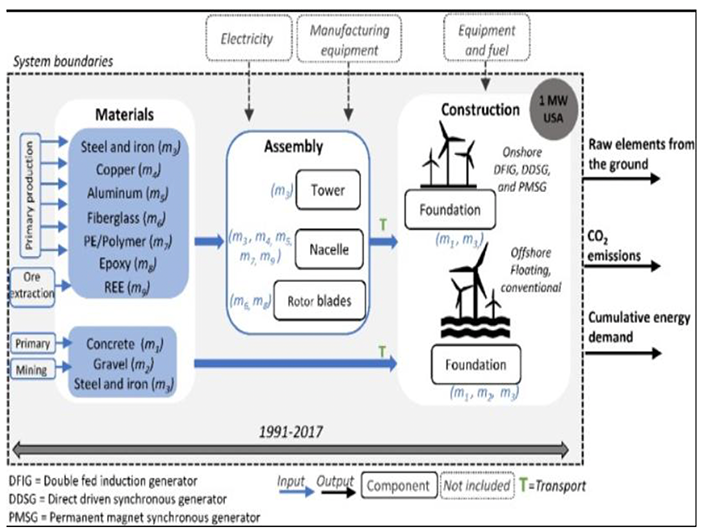
In an assessment of the material consumption and environmental impact of wind turbines in the USA and globally, Farina and Anctil (2022) quantified the carbon footprint and cumulative energy demand associated with the material production. The types of raw materials the authors identified as being required for the construction and deployment of onshore and offshore wind turbines are shown in Figure 7.
Their calculations indicate that, for the USA, demand for cement in 2032 to 2036 will be twice as much as the current amount used for wind turbines and pipeline construction, demand for steel in 2033 will increase by 511% (from 853 to 5215 kt), and for rare earth elements demand will increase by between 254% and 815% (from 0.33 to 1.16-3 kt) compared to 2018. For the rest of the world they estimate that in 2050, the demand for rare earths will be equivalent to 38% of Chinese production.
Globally, they estimate that by 2050:
i) demand for copper for onshore and offshore turbines will be 14 times (754 thousand tons) higher compared to the current level;
ii) total consumption of 83 thousand tons of aluminium for onshore and offshore turbines;
iii) 3,601 thousand tons of fiberglass used for wind turbines worldwide, with associated requirements for natural minerals (i.e. silica sand, limestone, and soda ash).
Estimates such as the above indicate the ongoing creation of environmental impacts the types of which are described in Section 6.3, linked to the increased investment in energy from renewable sources, such as onshore and offshore wind.
6.4.3 Fish Imports
The UK is a net importer of fish. Although the divide between regions with regards to imports is unclear, in 2021 landings by the Scottish fishing fleet accounted for 67% of the overall tonnage landed to the UK (Marine Scotland, 2021). The majority, by weight, of the imports of fish and seafood products originate from China (142,183 tonnes), Norway (14,913 tonnes), followed by, Iceland (99,938 tonnes) Ecuador (77,400 tonnes) and Vietnam (71,381 tonnes), and the most commonly imported species by weight were tuna, cod, salmon, shrimp and prawns, and haddock.
No details are available of the exact geographic sources of imports to Scotland, and thus no insight to the forms of fishing (e.g. inshore, aquaculture). However, environmental impacts of fish imported to Scotland can be expected to be due to the fishing systems used, including greenhouse gas emissions.
For example, shrimp aquaculture often requires the conversion of tropical coastal lowlands of America and Asia into shrimp ponds (Crenna et al., 2019).
Seafood has a lower carbon footprint than other forms of meat production for consumption and are thought to only account for 4% of global food related GHG emissions (Parker et al., 2018). Typically, marine fisheries are excluded from global assessments of GHGs. A wide range is reported in the literature for the capture or farming of different species (Hallström et al., 2019; Hilborn et al., 2018; Parker et al., 2018; Pelletier, 2009). Some of the major seafood exports from Scotland and the UK are species with the lowest associated carbon footprint and highest associated nutritional value, for example mackerel and herring (Hallström et al., 2019; Sandison et al., 2021). In contrast, imported seafood includes some of the species with the highest carbon footprints (Parker et al., 2018; Ziegler et al., 2011).
The Marine Stewardship Council, which administers the independent sustainability certification schemes, recognised by the Scottish Government, report that overfishing and bycatch are two of the leading drivers of biodiversity loss in oceans (Ackerley, 2024). O’Hara et al. (2021) estimate that 70% of at-risk species are sensitive to one or more fishing stressors (e.g. bottom trawling, which is the most widespread anthropogenic activity that impacts the seabed on the continental shelf). Miranda et al. (2022) calculated the proportion of marine species at risk of extinction to be 5.7%, of which exploitation of the resource (i.e. fishing and related systems) presents the greatest risk (44%). Other authors found slightly higher levels of extinction risk, for example in studies which focused on species found in shallower waters, where there is greater fishing pressure (e.g. damage or loss of habitats due to disturbance from fishing gear) (e.g. sharks and rays extinction risk of 32%; Dulvy et al. 2021).
In Scotland’s Marine Atlas, Marine Scotland (2011) report pressures and impacts of fishing include: i) pressures on the distribution and population size of fish stocks, loss of biological productivity of individual stocks, and reduced genetic diversity due to the selective removal of species; ii) indirect impacts on community structure and food webs and the loss of biological productivity and biodiversity due to the selective removal of species; iii) and the introduction of litter and remnants of damaged nets. Oberle et al. (2015) estimate that, on a global scale, the extent of the principal environmental impact of bottom-trawling-induced sediment resuspension, is approximately 22 gigatons, or equivalent to all of the sediment from rivers deposited on the world’s continental shelves each year.
6.4.4 Space Waste
Space waste originating from Scotland has not yet materialised, but can be anticipated. The strategy of the Scottish Government supported Space Scotland notes an aim is to ensure Scotland’s space ambitions and plans for delivery are in line with Scotland’s target to transition to a net zero society by 2045, and that “Scotland’s space sector businesses will be encouraged to continue to recognise the importance of sustainable environmental practices and enshrine them as a core business value.” With space ports being developed and moving to an operational status in 2024, items such as micro satellites will be launched into space from Scottish sites (e.g. at SaxaVord Spaceport in Shetland and Space Hub Sutherland). The number and weight of such items will be very small in absolute terms, and in comparison with the equivalent industries in other jurisdictions. Gaston et al. (2023) identify environmental impacts such as nighttime lighting of more objects in the sky, to which biological processes may be sensitive, and pollutants injected directly into all levels of the atmosphere where combustion products can remain for years after emission (Ross and Sheaffer, 2014). Work would be required into the quantification of the type, amount and significance of environmental risks associated with materials from Scottish origin.