Snowsports sector - economic, social and cultural impact: research - technical report
This technical annex contains methodological details of the research into the economic, cultural and social value of the Scottish snowsports sector.
9. Summary Data – Visitor Survey
About you
| Number | Percentage | |
|---|---|---|
| Scotland | 1,269 | 83% |
| Rest of the UK | 248 | 16% |
| Rest of the World | 13 | 1% |
Source: IBP Visitor Survey.
N=1.530
Note: EKOS analysis and coding based on postcode data for UK, and tick box for those who lived outwith the UK. Elsewhere in the UK (town or region was also specified) and elsewhere outside of the UK (country was specified).
| Female | Male | Gender not Specified | |
|---|---|---|---|
| Aged 15 or under | 274 | 276 | 50 |
| Aged 16-34 | 432 | 480 | 31 |
| Aged 35-59 | 651 | 784 | 44 |
| Aged 60+ | 152 | 250 | 40 |
| Total | 1,509 | 1,790 | 165 |
Source: IBP Visitor Survey.
| Number | Percentage | |
|---|---|---|
| Yes | 263 | 17% |
| No | 1,261 | 83% |
Source: IBP Visitor Survey.
N=1,524
| Number | Percentage | |
|---|---|---|
| Yes | 1,178 | 77% |
| No | 350 | 23% |
The main sources of information used includes mountain centre websites, Facebook, Instagram, Twitter, and Google.
Source: IBP Visitor Survey.
N=1,528
| Number | Percentage | |
|---|---|---|
| Visited another mountain centre in Scotland previously | 1,166 | 77% |
| Visited another artificial slope in Scotland previously | 480 | 32% |
| Only visited this centre/ artificial slope before | 266 | 18% |
| First visit to a mountain centre /artificial slope in Scotland | 64 | 4% |
Source: IBP Visitor Survey.
N=1,514.
Multiple response question where respondents could select more than one option and all that applied. Percentages may total more than 100% as a result.
| Number | Percentage | |
|---|---|---|
| Cairngorm Mountain Resort | 765 | 65% |
| Glenshee | 716 | 61% |
| Nevis Range | 658 | 56% |
| Lecht 2090 | 627 | 54% |
| Glencoe Mountain Resort | 617 | 53% |
Source: IBP Visitor Survey.
N=1,166.
Multiple response question where respondents could select more than one option and all that applied. Percentages may total more than 100% as a result.
| Number | Percentage | |
|---|---|---|
| Snow Factor, Glasgow | 280 | 58% |
| Midlothian Snowsports Centre, Hillend | 247 | 51% |
| Adventure Aberdeen Snowsports | 138 | 29% |
| Glasgow Ski & Snowboard Centre | 109 | 23% |
| Bearsden Ski and Board Club | 97 | 20% |
| Alford Ski Centre | 79 | 16% |
| Glenmore Lodge | 79 | 16% |
| Firpark Ski Centre | 65 | 14% |
| Polmonthill Snowsports Centre | 42 | 9% |
| Loch Insh Outdoor Centre | 41 | 9% |
| Huntly Nordic and Outdoors Centre | 32 | 7% |
| Newmilns Snow and Sport Complex | 30 | 6% |
| Lagganlia Outdoor Centre | 21 | 4% |
| RM-Condor Arbroath | 19 | 4% |
Source: IBP Visitor Survey. N=480.
Multiple response question where respondents could select more than one option and all that applied. Percentages may total more than 100% as a result.
| Number | Percentage | |
|---|---|---|
| Often (e.g., every couple of months or more) | 680 | 45% |
| Occasionally (e.g., a few times a year) | 539 | 35% |
| Rarely (e.g., once a year) | 303 | 20% |
Source: IBP Visitor Survey.
N=1,522
About your trip
Note: Respondents who were interviewed in person by IBP at a mountain centre or artificial slope or who self-completed the survey on the day of their visit at a mountain centre were then asked a range of questions about their visit that day. Respondents who completed the online survey were asked to think about and provide further details about their most recent visit to a mountain centre or artificial slope facility in Scotland (where applicable).
| Number | Percentage | |
|---|---|---|
| Glenshee | 441 | 29% |
| Cairngorm Mountain | 425 | 28% |
| Glencoe Mountain Resort | 360 | 24% |
| Nevis Range | 131 | 9% |
| Lecht 2090 | 127 | 8% |
| Firpark Ski Centre | 21 | 0% |
| Newmilns Snow and Sports Complex | 15 | 0% |
| Glasgow Ski & Snowboard Centre | 8 | 0% |
| Polmonthill Snowsports Centre | 1 | 0% |
| Snow Factor, Glasgow | 1 | 0% |
Source: IBP Visitor Survey.
N=1,530.
Note: artificial slope facilities with no interviews/responses have not been included in the table.
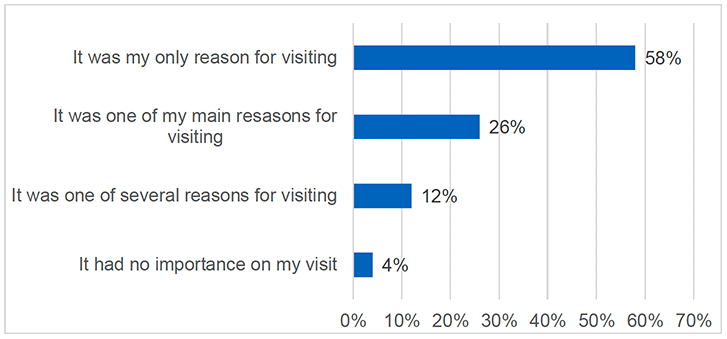
Source: IBP Visitor Survey.
N=1,228.
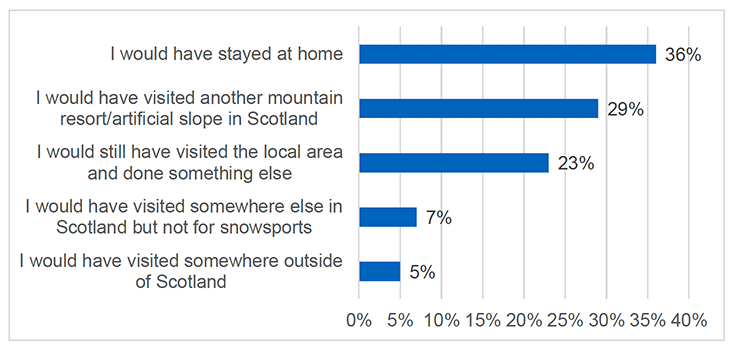
Source: IBP Visitor Survey.
N=1,469.
| Number | Percentage | |
|---|---|---|
| Yes | 538 | 36% |
| No | 946 | 64% |
Source: IBP Visitor Survey.
N=1,484.
Source: IBP Visitor Survey.
N=538.
Multiple response question where respondents could select more than one option and all that applied. Percentages may total more than 100% as a result.
| Number (Total) | |
|---|---|
| The local authority area where this mountain centre or artificial slope is located | 2,946 |
| Elsewhere in Scotland | 939 |
Source: IBP Visitor Survey.
N=492
| £ (Average) | £ (Total) | |
|---|---|---|
| The local authority area where this mountain centre or artificial slope is located | £96 | £427,484 |
| Elsewhere in Scotland | £50 | £143,837 |
Source: IBP Visitor Survey.
N=472
| £ (Average) | £ (Total) | |
|---|---|---|
| Food | £31 | £47,871 |
| Drink | £12 | £19,015 |
| Entertainment | £5 | £7,155 |
| Equipment hire | £9 | £13,948 |
| Transport | £21 | £32,849 |
| Shopping | £10 | £14,826 |
| Other | £8 | £11,628 |
Source: IBP Visitor Survey.
N=1,530
About your experience today/your most recent visit
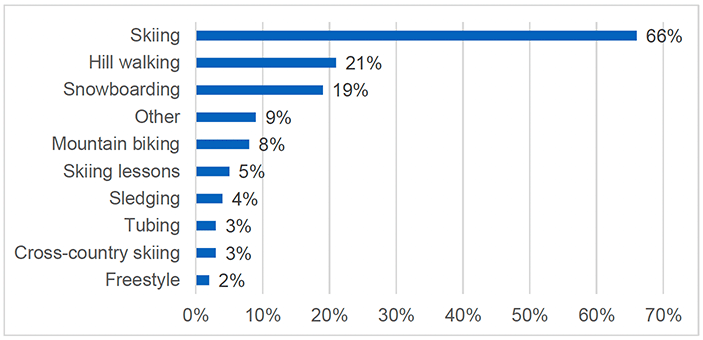
Source: IBP Visitor Survey.
N=1,530.
Multiple response question where respondents could select more than one option and all that applied. Percentages may total more than 100% as a result.
"Other" responses included sightseeing, bird watching, winter climbing, and ski touring.
| Satisfied/very satisfied | Neither satisfied nor dissatisfied | Dissatisfied/very dissatisfied | Not applicable | Base | |
|---|---|---|---|---|---|
| Ease of entry to centre/facility | 86% | 8% | 6% | 0% | 1,514 |
| Signage and direction on-site | 85% | 9% | 4% | 2% | 1,516 |
| Being made to feel welcome | 84% | 9% | 6% | 2% | 1,521 |
| Availability of car parking | 81% | 12% | 6% | 1% | 1,523 |
| Quality of overall experience | 78% | 15% | 6% | 0% | 1,522 |
| Help and support | 77% | 11% | 5% | 7% | 1,503 |
| Covid precautions | 69% | 10% | 2% | 19% | 1,493 |
| Quality of overall offer | 68% | 19% | 10% | 3% | 1,502 |
| Quality of facilities | 63% | 23% | 13% | 1% | 1,494 |
| Cost/affordability | 62% | 24% | 12% | 2% | 1,514 |
| Quality of the slopes | 60% | 20% | 12% | 7% | 1,509 |
| Café/catering facilities | 59% | 21% | 10% | 10% | 1,497 |
| Quality of equipment (if hired) | 29% | 6% | 3% | 62% | 1,295 |
| Availability of public transport | 19% | 6% | 19% | 57% | 1,441 |
Source: IBP Visitor Survey.
Table 9.15: What, if anything, would make the biggest difference to improving your overall quality of experience?
In an open-ended question that asked respondents "What, if anything, would have made the biggest difference to improving your overall quality of experience", some common themes emerged.
Reflecting the make up of the respondents who took part in the survey, much of the feedback related to mountain centres.
- Better weather conditions.
- More snow.
The afore-mentioned factors are of course outwith the control of the operators.
Other comments included: ensuring facilities like the funicular and chairlifts are open/functioning (e.g. improving maintenance, improved communication with visitors); and having full access to the mountain centre (i.e. the top of the mountain was closed).
Some respondents drew attention to the need to develop the infrastructure servicing mountain centres and artificial slopes, including more public transport options, more public toilets, bigger car parks, and electric vehicle (EV) charging points.
Finally, some respondents felt the visitor experience could be improved by reducing the cost of certain things. Car parking, lifts, and food were all mentioned.
Others said there needs to be more staff in order to reduce the amount of queuing that visitors need to do (e.g. at ticket offices).
Reasons for, and barriers to, taking part in outdoor activities
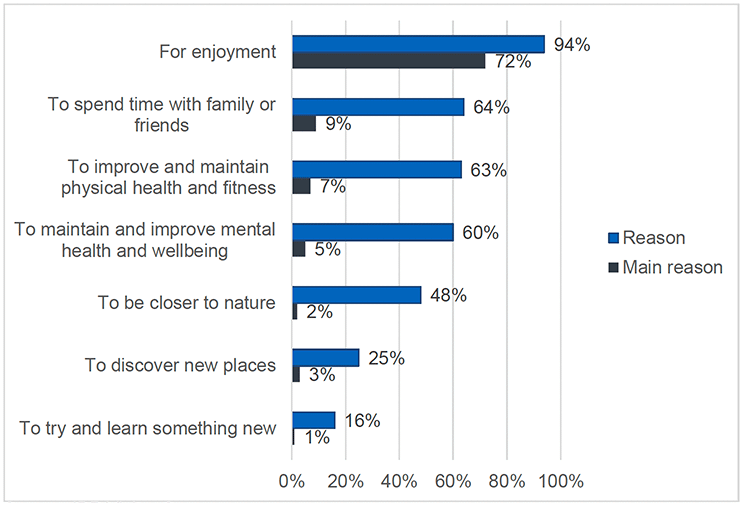
Source: IBP Visitor Survey.
N=1,510.
Multiple response question where respondents could select more than one option and all that applied.
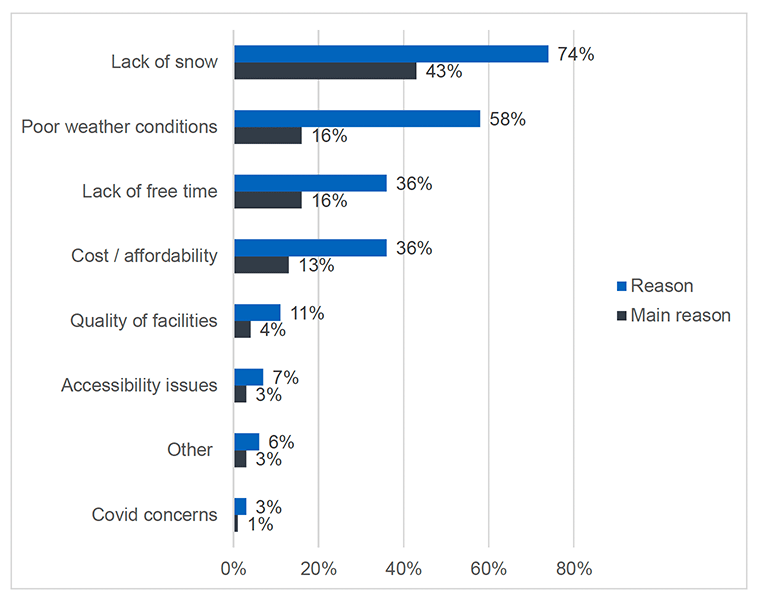
Source: IBP Visitor Survey.
N=1,518.
Multiple response question where respondents could select more than one option and all that applied.
Other responses included the distance to resorts, old age/ injuries, and a lack of public transport. Please note several respondents commented on the poor management of the Cairngorm Resort as a factor.
Table 9.16: What, if anything, would make the biggest difference to reducing your barriers to taking part in these types of outdoor activities more often?
In an open-ended question that asked respondents "What, if anything, would make the biggest difference to reducing your barriers to taking part in these types of outdoor activities more often?" some common themes emerged, which were broadly similar to those in Table 9.15.
Reflecting the make-up of the respondents who took part in the survey, much of the feedback related to mountain centres.
- Better weather conditions.
- More snow.
- Cheaper Prices
The weather factors are outwith the control of the operators, but a substantial portion of respondents identified the need for more artificial snow making.
Other comments included: ensuring the funicular is reopened and repairing/improving chairlifts.
A few respondents identified the need to develop the infrastructure servicing mountain centres and artificial slopes, including better public transport, bigger car parks and better snow clearing on roads.
Contact
Email: socialresearch@gov.scot