Fishing vessels - economic link: business and regulatory impact assessment
A business and regulatory impact assessment (BRIA) of changes to Scottish economic link conditions contained in Scottish fishing vessels.
21. Appendix B – Detailed Methodology
This section provides an overview of the methodology used for the analysis presented in the above Options section of the BRIA.
Three principal costs and benefits were monetised for the impact assessment:
- the cost to fishers due to the price differential between landing abroad and in Scotland,
- the benefits to the fish processing industry from increased throughput, and,
- the upstream benefits derived from the increased production in the processing industry.
Other costs and benefits were not monetised either due to their relatively small effect on the overall analysis, such as port landing dues and steaming costs. Or due to being difficult to quantify, such as business relationship impacts, more stable supply chains for the processing industry, or labour supply issues. The possible loss of Scottish resident crew due to the removal of the crewing element was considered using Seafish data, but not monetised. This is due to the lack of publicly available data, and the expectation that most pelagic crews will continue to employ UK resident crew due to their composition, for example, the practice of employing friends and family.
Data
The data used in this analysis is Marine Scotland vessel compliance data, Scottish Sea Fisheries Statistics, Seafish fish processing data, Scottish Input-Output tables, and ONS deflators.
- Vessel data from 2015-2019 was used in this analysis in order to determine which vessels would be compliant with the new landings target or not, and thus determine the tonnage and value of the 8 key species which could be expected to be landed or quota gifted under the different scenarios. A five year average was used when calculating the cost or benefit from these figures.
- Price data from 2015-2019 for the 8 key species was used from the Scottish Sea Fisheries Statistics in order to determine the price differential of landing abroad or in Scotland. A five year average was used when calculating the cost or benefit from these figures, and only the price difference for Pelagic species were captured.
- 2014, 2016 and 2018 figures for Scottish fish processors were used from Seafish to determine the Gross Value Added (GVA) on raw material inputs. An average of the three surveys were used to calculate the average GVA addition per £1 of raw material.
- The Scottish Input-Output table was used to derive indirect and induced effects for an increase in fish processing activity.
- All prices were converted to expected 2023 prices using ONS deflators, taken from the Spring Statement in March 2022. Although, due to the volatile inflation currently experienced the true prices for 2023 may not reflect those presented.
Using vessel data from 2015-2019, if a vessel landed less than 55% of its total tonnage of the 8 key species into Scottish ports it was considered non-compliant for the purposes of this analysis. The tonnage and value required to reach the 55% target were calculated per vessel, and termed the ‘landing gap’, with the landings gap then split by reference to the 8 key species. Both for the purposes of landing, or quota gifting, the landing gap was determined by reference to the 8 key species depending on the vessel’s total catch share for the 8 key species, i.e. if 50% of the vessel’s catch was mackerel, then it was expected that their extra landings or quota gifted would be 50% mackerel. This landing gap by species was then averaged for the five years of data available before being used to calculate the business impact.
No changes were expected or modelled for species which are not one of the 8 key species. Demersal vessels that were non-compliant landed these other species almost exclusively abroad and it is expected that if they landed these in Scotland instead, they would likely transport them abroad rather than process them in Scotland. For pelagic vessels it was expected that they would continue to land these other species abroad as they would plan their trips and species specific fishing so as to maximise their gains.
21.1 Central Scenario
Scenarios 1 & 3 assume compliance completely via the landings target and quota gifting respectively for the non-compliant fleet. However, Scenario 2, the Central Scenario, assumes a mix of both compliance options. The rationale behind the Central Scenario is that between 2015 and 2019 there were 8 pelagic vessels who landed more than 80% of their total tonnage outside of Scotland. It is assumed that these vessels either have had contractual arrangements with processors abroad, or else have very close business relationships which may make it difficult for them to amend their landing patterns – at least in the short term. Therefore, pelagic vessels landing more than 80% abroad are assumed to pursue quota gifting rather than increasing their landings into Scotland, for all other affected pelagic vessels it is assumed that these will increase their Scottish landings to 55%.
Affected demersal targeting vessels predominantly belong to the foreign-owned fleet whose business model is well ingrained in landing abroad, hence no behavioural change is assumed for this fleet segment and instead it is assumed they will quota gift where appropriate.
21.2 Catching – Price Differential
The landing gap, this being the gap between what a vessel landed and what it would have had to land to comply with the landings target, established from the vessel compliance data was combined with the price differential in order to estimate the cost to fishers from the change in prices received. This was applied to herring and mackerel only, as the demersal price differentials were not consistent through the years and are likely the result of special business arrangements rather than market reflections of the price. The price differential was calculated from the average difference in price of landing into Scotland against landing anywhere else, with the market price in Scotland often being lower than landing into Norway (the primary alternative market). The price differential was applied to any extra landings expected in Scotland, whether they were directly landed by the non-compliant vessels or through extra landings by vessels given quota gifted stocks. All prices were converted to expected 2023 prices before the price differentials were calculated, with all results presented in expected 2023 prices (the first year of the policy change).
The price differential used in the model was £35 per tonne less for landing Mackerel into Scotland and £31 per tonne less for landing Herring into Scotland.
21.3 Downstream
For pelagic landings, it is assumed that 100% of the benefits of the downstream impacts will be captured within Scotland. The majority of pelagic processing in the UK is in the North Eastern Scotland region and this industry is already subject to relatively large variances in their inputs due to changes in quota, hence the expectation that they have flexibility in terms of processing additional input. Further, the bulk nature of pelagic fishing and the need to process it in a timely manner means that it makes business sense to process it within Scotland, with the capacity available to this industry suggesting it should not displace imports and thus be new production. This is in contrast to demersal fish noted below.
For demersal landings, it is assumed that 50% of the benefits of the downstream impacts will be captured within Scotland. Demersal processing is spread across the UK and given that it is typically higher-value per tonne than pelagic processed fish, it is more cost effective to transport it. Additionally, there is a greater possibility of these extra landings replacing imports, meaning there is no actual increase in processing for these factories. Therefore, it is assumed that fewer of the benefits of downstream impacts will be captured.
The total value of the extra landings in expected 2023 prices, either landed directly by the previously non-compliant vessel or from quota gift landing in Scotland, is taken in average Scottish prices (rather than the value they could have received abroad). This is considered the total input value for the purposes of the model.
Analysis has been undertaken using the Scottish Input-Output (I-O) tables to derive the total inputs that would be used in production, with an input ratio of 1.27 applied on any extra landed fish to determine the total inputs used by the fish processing industry. This input ratio was derived by dividing the total intermediate output of the fish processing sector by the primary inputs to determine the number of extra inputs, the primary inputs considered being fishing, aquaculture and the fish processing industry itself (as this would be the secondary processing of fish).
The total input value is then multiplied by the GVA ratio derived from processing data provided by Seafish for Pelagic and Demersal processors, 1.26 and 1.27 respectively, to find the total output value. The Seafish GVA ratio was calculated by dividing the sum of the GVA and raw material costs for that grouping by the raw material costs. The difference between the total outputs and total inputs is calculated to be the GVA and is expected to include wages, taxes, and gross operating surplus. The total output figure is subsequently used for the upstream calculations. Figures were presented in expected 2023 prices.
The rationale for using the GVA ratio obtained by Seafish data rather than using a ratio derived from the I-O table is due to the I-O table including all fish processing. Whereas, Seafish data could instead be split out by industry and showed that aquaculture processing often had a larger GVA ratio than pelagic or demersal processing, which suggests that the I-O table would have overestimated the GVA gains.
21.4 Upstream
The main task of the model is to estimate the additional output in the economy supported by a given change in the output of the fish processing industry as a result of the domestic fishing industry landing an increased share of its catch in Scotland. The additional output estimated is only that due to backward linkages from the fish processing industry, i.e. that are brought about by the industry's increase in purchases of goods and services for intermediate consumption. The additional fish processing output is assumed to be exported or to displace imports.
The standard approach to using an output-driven input-output model is inappropriate here, as it would generate an increase in output of the fishing industry in response to the increase in output of the fish processing sector rather than a shift in use of fishing industry output from exports to intermediate use.
Instead a mixed exogenous/endogenous variables model is used to require that the output of the fishing industry remains unchanged.
21.4.1 Upstream - The mixed exogenous/endogenous variables model
The basic equation of input-output analysis is
𝑋 = 𝐴𝑋 + 𝐹
with the usual solution
𝑋 = (𝐼 − 𝐴)−1𝐹
where 𝑋 is the vector of industry gross outputs, is the direct requirements matrix from the Input-Output table, and 𝐹 is the vector of final demands for industries’ outputs.
We want to exogenously specify the output of two sectors. Firstly, the fish, fruit, and vegetable processing industry (the narrowest industry classification containing fish processing available in the Input-Output tables), where output is increased by a given amount as a result of processing more fish. Secondly the fishing industry, where output is assumed to be unchanged, as fish that would have been otherwise exported are instead used domestically (note that this implies an assumption of no price difference between selling fish to a domestic processor and selling as an export).
We can rearrange the rows and columns of the matrices and vectors so that the equation above can be rewritten in partitioned form as follows:
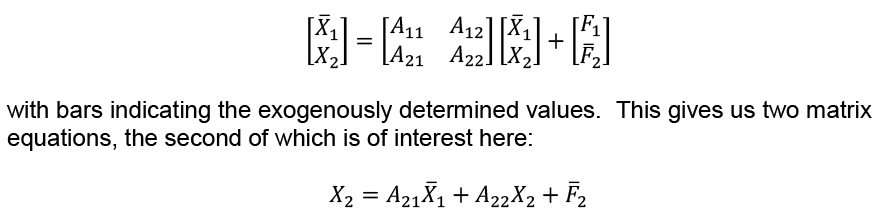
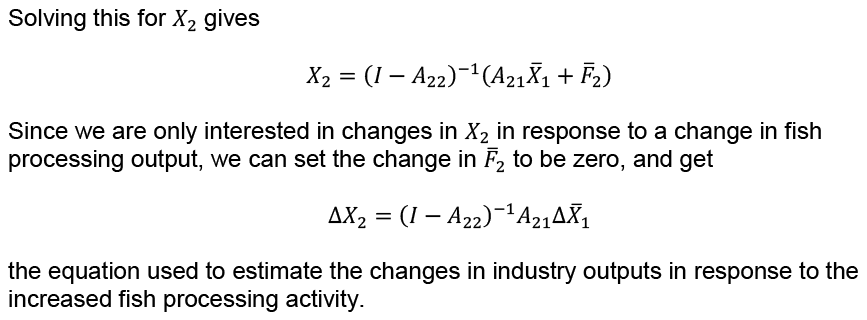
the equation used to estimate the changes in industry outputs in response to the increased fish processing activity.
The fish, fruit, and vegetable processing industry also purchases fruit and vegetables from the agriculture industry, and farmed fish from the aquaculture industry. It does not make sense that the fish, fruit, and vegetable processing industry would purchase more of these simply because it increased the quantity of fish it was processing. Therefore the coefficients 𝐴21 in corresponding to purchases from the agriculture and aquaculture industries by the fish, fruit, and vegetable processing industry were zeroed out to exclude such effects from the model and prevent them from inflating the results.
Having obtained the vector of output changes in the economy using the equation above, it was then converted into changes in GVA (and FTE) using output to GVA (respectively FTE) ratios from the standard SG Input-Output model.
For further details of the mixed exogenous/endogenous variables approach see:
Johnson, T.G. and Kulshreshtah, S.N. (1982), “Exogenising Agriculture in an Input-Output Model to Estimate Relative Impacts of Different Farm Types”, Western Journal of Agricultural Economics, vol. 7, pp. 187-198.
Papadas, C.T. and Dahl, D.C. (1999), “Supply-Driven Input-Output Multipliers”, Journal of Agricultural Economics, vol. 50, pp. 269-285.
21.5 Final Results
These three principal costs and benefits are summed to give a total benefit to the Scottish economy, presented in expected 2023 prices. These figures are presented for the first 10 years of the programme, with all prices presented in expected 2023 values with a social discounting applied of 3.5% for all years after 2023 in line with the Green Book in order to calculate the present value.
21.6 Sensitivity Analysis
The sensitivity analysis is an attempt to monetise some of the costs which cannot be robustly added to the analysis. This gives a range for the possible costs and benefits of this scheme under different circumstances. There are four main scenarios envisioned with rough estimates attached to give an idea of possible alternative ranges. All the ranges used in the sensitivity analysis are arbitrary and do not represent modelled or expected changes.
The first is to reduce one of the assumptions surrounding the benefits by assuming a decrease in raw material production. In the main analysis only the value of the fish caught is added to the downstream and subsequent upstream benefits. Whereas in reality other variable inputs would have to be bought to produce the final product, including packaging and energy, which would increase the output due to the method of multiplying the inputs by a fixed GVA ratio. It is assumed in this scenario that there is a 20% uplift in total inputs on the fish bought, resulting in all fish inputs having a 1.2 multiplier applied to them before the GVA ratio is applied. In the main analysis it is assumed that there would be an increase in other raw materials used in addition to the added fish which would consequently have upstream benefits. The input ratio used was derived using the whole fish and fruit processing industry’s figure and so may not be representative of the primary processing pelagic industry. As such we reduce the input ratio by half, from 1.27 to 1.13 in order to reduce the expected use of inputs.
The second scenario assumes a reduction in GVA to the processors overall, from increased costs relative to overseas competition particularly from energy costs, or due to increased administrative or trade costs from the extra fish they would be processing and exporting. This is modelled by reducing the GVA ratio from 1.26-1.27 to the lowest value observed in demersal processors, 1.18.
The third scenario assumes that processing of fish in Scotland drops from 100% to 70% for pelagic, and 50% to 35% for demersal. This is to reflect the risk in overestimating processing ability/desire in Scotland, as well as the risk of labour shortages resulting in processors needing to reduce their fish input. This change is presented in the model as a modifier on how much of the landed fish is used in downstream and then subsequent upstream calculations. The price differential is still applied to all the fish, assuming that any fish they landed but could not be processed in Scotland would still incur a price difference.
The final scenario assumes there is a drop in mackerel and herring prices in Scotland of 10% for any new fish landed, resulting in a price differential of £144 per tonne less for Mackerel and £84 per tonne less for Herring, against landing outside of Scotland. This decrease in price was not applied to existing fish landed in Scotland as they already have markets, instead it reflects the risk of prices for pelagic species falling due to a failure to find suitable export or domestic markets for the new fish. As there is strong demand internationally for the pelagic species targeted, it is expected that a market will be found, but in this worst case scenario the price demanded would be lower.
This price drop would also affect processors’ GVA as it is assumed it is as a result of being able to offer a lower mark-up, as otherwise it would simply be a transfer of revenue from the fishers to the processors. With the inputted downstream values being lower due to the decrease in value of fish.
The sensitivity analysis has only been presented for year 3 due to the fixed changes applied to the model having a disproportionate effect in the first two years, i.e. it is unlikely that the same price reduction would be seen in the first year where the landings target is a lot lower than the third year when the scheme is fully operational. Rather than attempt to model the change in the sensitivity as the scheme ramps up and add complexity to a non-robust assumption, it was decided to present only the figures of the scheme in full operation. The Year 3 figure is comparable to the Year 3 figure in the costs benefit tables in the main analysis.
It is important to note that these assumptions are not expected but are possible risks and are used to understand what could happen if circumstances change.