Development of a combined marine and terrestrial biodiversity indicator: research
A commissioned research report on development of a new single high level biodiversity indicator covering marine and terrestrial (including freshwater) habitats to measure trends and replace the existing biodiversity indicator in the National Performance Framework.
9. Further recommendations
9.1 Disaggregation
160. The single line in the proposed headline indicator, incorporating trends in an extremely wide range of species across disparate taxa, collectively found in most if not all of Scotland's habitats and regions, and responding both positively and negatively to a disparate range of drivers, is intended to reflect the most broadscale changes in the country's biodiversity. However, amalgamating such a wide range of data means that the single line can mask massive variation in trends between species, and such variation may reflect wider patterns of change. A relatively stable headline indicator can, for example, hide very substantial declines in abundance and occupancy of particular species groups, or within particular habitats or regions, if other groups are showing increases. As such, the headline indicator alone may be a misleading measure of biodiversity health; we strongly recommend the simultaneous and linked publication of disaggregated indicators to aid interpretation (and avoid misinterpretation) of the headline indicator.
161. The most straightforward approach to presenting disaggregations of the headline biodiversity indicator is to identify relevant subsets of the species trends of which it is comprised. Simple options include by realm (terrestrial, freshwater and marine), by taxon, and by the two currencies by which trends are measured, abundance and occupancy. We present draft disaggregations of these in Figures 7-9. Note that these drafts are intended as examples of what is possible; they have been calculated using the geometric mean method, not the new hierarchical modelling approach we advocate for the published indicator. Additional divisions are possible - further taxonomic breakdowns, for example.
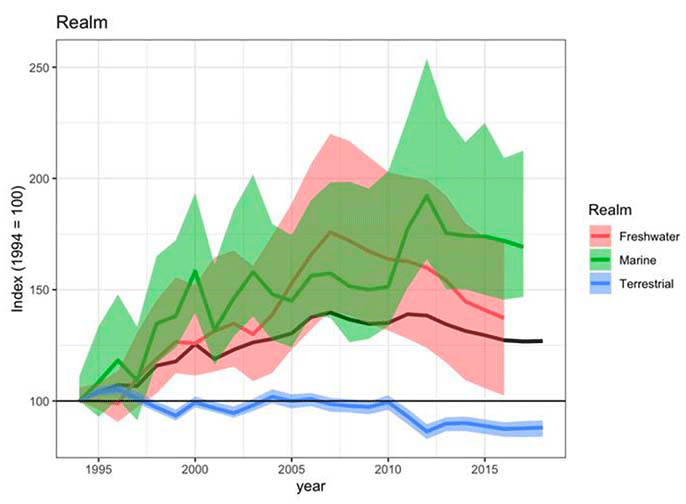
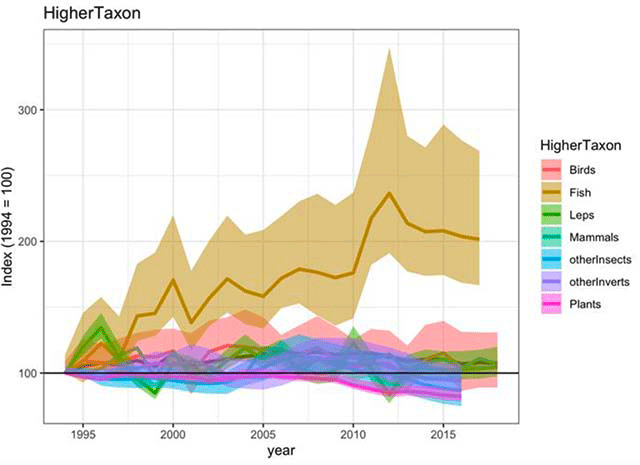
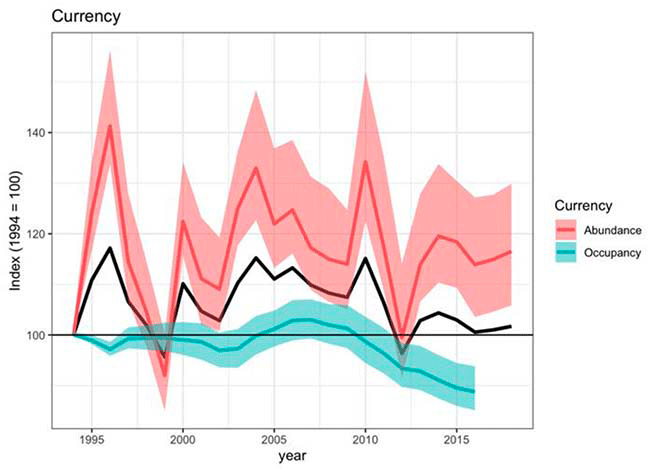
162. These disaggregations aid interpretation; additional disaggregations may be equally or even more informative but may require more work to produce. In some cases, indicators might not be straightforward divisions of the trend dataset used to create the headline indicator, but involve additional analyses of the original data sources. Two obvious disaggregations are by habitat, and spatially (e.g. Scottish regions).
163. Habitat. Two broad approaches can be used to present trends in biodiversity by habitat. The first is to define species by habitat, then produce indicators by grouping species by these definitions and using their national trends. This approach is commonly used for wild bird indicators, such as those within the UK Biodiversity Indicators (indicator C5), in which bird species are defined as belonging to farmland, woodland, wetlands, or seabirds and indicators created for these groups. Typically species are assigned to just a single habitat, although there are instances in which they may be included in more than one habitat class. The habitat designations used are derived from published literature. A similar approach would be possible for biodiversity in Scotland, for those groups for which such habitat definitions are available; such definitions have been created for some taxonomic groups e.g. for vascular plants (Hill et al. 2004), although there is variation in the methods used. Approaches using a standardised approach to allocate species to preferred habitats, such as that of Redhead et al. (2016) who analysed the distribution of biological records in relation to land cover data, may be worthy of further exploration.
164. The alternative approach to producing habitat-specific indicators is to generate trends using only data from specific habitats. This approach has been explored for wild birds and for butterflies in England, for which sufficiently large and robustly-sampled datasets exist to enable habitat-specific trends to be produced for individual species (Newson et al. 2008) which can thus be combined to produce indicators (Renwick et al. 2012). However, the capacity to do so is severely constrained by sample size, as well as the structure of species' datasets, and this approach is unlikely to be possible for a large proportion of species in Scotland.
165. Regional. There is obvious merit in being able to look at spatial patterns of biodiversity change by producing indicators for regions within Scotland and Scottish waters. Unfortunately, at present there is little possibility of doing so. None of the monitoring programmes generating species' trends incorporated in our draft indicator currently produce trends at a spatial scale smaller than all-Scotland. While this might be possible for those more abundant species, for which sample sizes might be sufficient to support the generation of trends at a smaller spatial scale (e.g. 'regional', however that might be defined), this will be a minority of species, and the species for which it is possible will vary between regions. Furthermore, this will introduce a substantial bias towards species with larger datasets (i.e. that receive more recording effort, and more detectable, or are more abundant) and so interpreting change in resultant regional indicators, in comparison with the headline indicator for Scotland, will be extremely difficult. It is conceivable that developments in citizen science-based biodiversity recording, such as those proposed by the recent SBIF review (Wilson et al. 2018), may eventually strengthen data flows to the point at which regional disaggregation becomes viable.
9.2 Reviews
166. Whilst we believe the headline biodiversity indicator recommended in this report, if accompanied by a range of disaggregated indicators to aid interpretation of patterns of change, is the most suitable format possible currently, it is clear that it has a number of shortcomings. Some of these concern the availability of sufficient data to avoid bias in the representation of taxonomic groups, realms and habitats.
167. We recommend a programme of regular reviews of the indicator and the data contributing to it, in order to identify developments to address shortcomings. In particular, such reviews could identify new sources of species' trends suitable for incorporation (for example, when the National Plant Monitoring Scheme has collected data for a sufficient length of time, and with a sufficient sample, to produce trends for vascular plants in Scotland), and identify datasets which could produce appropriate species' trends with suitable collation and analysis (see section 9.3 below).
9.3 Improving indicator coverage
168. Our review of suitable data for inclusion in a headline biodiversity indicator identified a number of data sources that might be of value but are not currently available in a format for inclusion in the indicator. Given the relatively low number of trends for marine species that we have been able to incorporate in our draft indicator, we recommend that if possible further effort should be focussed on enabling the inclusion of more marine species' trends. There are a number of existing datasets which seem to offer considerable potential:
169. The Marine Biological Association's MarClim project has an extensive time-series (from the 1950s onwards) of rocky shore species across a range of taxonomic groups, surveyed annually at over 100 recording locations.
170. The Ocean Biogeographic Information System (OBIS) is an open-data repository for marine biodiversity records, holding over 50 million records globally. Initial research by project team members (TW and NI) has identified the potential for deriving trends in species' occupancy from this data, in a similar way to those terrestrial trends already utilised within our draft indicator.
171. Seasearch, a Marine Conservation Society project, has encouraged the recording of biodiversity records by amateur divers since the 1980s. As with OBIS, occupancy-modelling methods might be applied to this dataset in order to derive species' trends.
172. Data on marine mammals are available from a number of sources, with differing spatial coverage. New analytical approaches, developed under the Marine Ecosystems Research Programme (MERP), may offer the best opportunity incorporate cetacean trends at a later revision, pending peer-review of the new methods.
173. As well as bottom trawl data for groundfish, ICES survey data for pelagic fish is available freely. The resources of this project did not allow us to develop dataflows and analyses for generating suitable abundance trends from this data, notably because the R interface to allow access to data requires further development.
174. Coverage of terrestrial and freshwater species is, in comparison with marine biodiversity, more robust. Incremental improvements in biological recording will mean future improvements in the availability of occupancy trends, but this may not be sufficient to address the significant gaps such as the lack of data on trends in fungi. At present, we do not have vascular plant trends for Scotland as concerns raised by data stakeholders over inconsistencies in recording efforts over time mean the trends derived to date are not regarded as suitable for use. It is possible that this can be resolved with further investigation; alternatively, the National Plant Monitoring Scheme will enable abundance trends to be included in the indicator from 2015 onwards. It is unlikely, however, that such trends will be available for range-restricted and rare species, whereas those from biological records may be.
9.4 Data flows
175. The continued publication of a biodiversity indicator dependent on species' trends derived from both structured monitoring programmes (e.g. the UK Breeding Bird Survey and UK Butterfly Monitoring Scheme) and the analysis of biological records is reliant on the continuation of the data flows that enable these trends to be produced.
176. At present, we believe the programmes that produce the 2,073 species' trends used in the draft indicator to be relatively secure. Most of the structured schemes that produce trends in abundance are funded through long-term partnerships between NGOs, such as the Bat Conservation Trust, British Trust for Ornithology, Butterfly Conservation and the RSPB, and UK Government (Joint Nature Conservation Committee). The work of the Biological Records Centre is supported by the Natural Environment Research Council, with the analysis of occupancy trends funded by the JNCC. International Bottom Trawl Surveys are supported by the International Council for the Exploration of the Seas (ICES).
177. However, such programmes are reliant not only on the continuance of funding, but moreover the wider support of biological surveillance through citizen science: the great majority of data used in the creation of our draft indicator (as with the existing NPF biodiversity indicator) are collected by volunteer surveyors and recorders. This volunteer effort is reliant upon support, e.g. to retain existing volunteers, engage and train new volunteers, maintain and increase standards, encourage efforts to strategically fill gaps in knowledge.
178. As well as the need to nurture the recording and monitoring community, there is a clear case for the transformation of existing infrastructure for biological recording to improve data flows and thereby ensure data collected becomes available for use, and thus encourages increased recording. Our consultation with data stakeholders, who are essential for the successful continuation of the proposed indicator, identified the implementation of the findings of A Review of the Biological Recording Infrastructure in Scotland (Wilson et al. 2018) as the key step in securing a step change in data availability in Scotland. This would not only secure the data required for the indicator proposed in this report, but enable substantial improvements in future iterations.
Contact
Email: envstats@gov.scot