Publication - Independent report
Coalition for Racial Equality and Rights - anti-racist policy making: review
Findings of a research programme into Scottish race equality strategies since 2000. The Coalition for Racial Equality and Rights (CRER) was commissioned to support the implementation of this review, with a focus on exploring opportunities for better practice.
Appendix 3: Statistical Reference Tables
The ethnicity categories used throughout are derived from data sources.
Community Cohesion and Safety
| Very strongly | Fairly strongly | Not very strongly | Not at all strongly | |
|---|---|---|---|---|
| 2012 | ||||
| White | 35 | 43 | 15 | 6 |
| Other ethnic minority groups | 17 | 45 | 22 | 13 |
| 2013 | ||||
| White | 37 | 41 | 16 | 6 |
| Other ethnic minority groups | 23 | 41 | 24 | 9 |
| 2014 | ||||
| White | 37 | 41 | 16 | 5 |
| Other ethnic minority groups | 19 | 40 | 20 | 17 |
| 2015 | ||||
| White | 34 | 43 | 16 | 6 |
| Other ethnic minority groups | 19 | 44 | 25 | 11 |
| 2016 | ||||
| White | 35 | 42 | 16 | 5 |
| Other ethnic minority groups | 21 | 43 | 25 | 7 |
| 2017 | ||||
| White | 35 | 44 | 15 | 5 |
| Other ethnic minority groups | 23 | 40 | 26 | 6 |
| 2018 | ||||
| White | 37 | 42 | 16 | 5 |
| Other ethnic minority groups | 25 | 47 | 21 | 4 |
| 2019 | ||||
| White | 35 | 43 | 15 | 5 |
| Other ethnic minority groups | 19 | 42 | 22 | 11 |
| Question | 2002 | 2006 | 2010 | 2015 |
|---|---|---|---|---|
| Percent of respondents who say equal opportunities have gone too far for minority ethnic groups | 18 | 23 | 23 | 16 |
| Percent of respondents who say it is probably or definitely unfair for a company who had few black and Asian people in senior jobs to decide to give black and Asian people it employed extra opportunities to get training and qualifications | *[188] | 41 | 48 | 41 |
| Percent of respondents who would be unhappy/very unhappy if their close relative formed a long-term relationship with someone who was black or Asian | 17 | 11 | 9 | 5 |
| Percent of respondents who agree with the statement 'people from ethnic minorities take jobs away from other people in Scotland' | 20 | 27 | 31 | 27 |
| Percent of respondents who do not personally know anyone who is from a different racial or ethnic background to themselves | 26 | 24 | 19 | 19 |
| Percent of respondents who would prefer to live in an area where most people are similar to themselves | 46 | 49 | 43 | 33 |
| Percent of respondents who agree or agree strongly with the statement that 'Scotland would begin to lose its identity if more black and Asian people came to live in Scotland?' | * | 46 | 45 | 34 |
| Percent of respondents who agree with the statement 'Sometimes there is good reason for people to be prejudiced against certain groups' | 26 | 29 | 28 | 22 |
| Yes Discrimination | No Discrimination | Yes Harassment | No Harassment | |
|---|---|---|---|---|
| 2015 | ||||
| Ethnicity - White | 7 | 93 | 6 | 94 |
| Ethnicity - Other ethnic minority | 17 | 83 | 13 | 87 |
| 2016 | ||||
| Ethnicity - White | 6 | 94 | 6 | 94 |
| Ethnicity - Other ethnic minority | 18 | 82 | 14 | 86 |
| 2017 | ||||
| Ethnicity - White | 6 | 94 | 6 | 94 |
| Ethnicity - Other ethnic minority | 19 | 81 | 11 | 89 |
| 2018 | ||||
| Ethnicity - White | 8 | 92 | 6 | 94 |
| Ethnicity - Other ethnic minority | 17 | 83 | 11 | 89 |
| 2019 | ||||
| Ethnicity - White | 7 | 93 | 6 | 94 |
| Ethnicity - Other ethnic minority | 19 | 81 | 17 | 83 |
| Year | Total number of charges of race crimes |
|---|---|
| 2010-11 | 4178 |
| 2011-12 | 4547 |
| 2012-13 | 4034 |
| 2013-14 | 4160 |
| 2014-15 | 3820 |
| 2015-16 | 3721 |
| 2016-17 | 3367 |
| 2017-18 | 3278 |
| 2018-19 | 2921 |
| 2019-20 | 3038 |
| Year | Agree |
|---|---|
| 2008-09 | 7.2 |
| 2009-10 | 8.3 |
| 2010-11 | 9.1 |
| 2012-2013[192] | 6.9 |
| Year | Agree |
|---|---|
| 2012-13 | 2.9 |
| 2014-15 | 3.7 |
| 2016-18[194] | 5.6 |
| 2018-20 | 4.5 |
Participation and Representation
| Years | Other minority ethnic | White |
|---|---|---|
| 2007 | 19 | 20 |
| 2008 | 19 | 22 |
| 2009 | 18 | 22 |
| 2010 | 24 | 21 |
| 2011 | 23 | 22 |
| 2012 | 16 | 22 |
| 2013 | 24 | 22 |
| 2014 | 23 | 23 |
| 2015 | 30 | 23 |
| 2016 | 29 | 23 |
| 2017 | 32 | 22 |
| 2018 | 21 | 20 |
| 2019 | 17 | 18 |
Education and Learning
| Ethnicity | Number | Percent |
|---|---|---|
| White - UK | 644,649 | 92 |
| White - Other | 10,357 | 1.5 |
| Mixed | 5,458 | 0.8 |
| Asian - Indian | 2,388 | 0.3 |
| Asian - Pakistani | 9,129 | 1.3 |
| Asian - Bangladeshi | 515 | 0.07 |
| Asian - Chinese | 2,275 | 0.3 |
| Asian - Other | 2,199 | 0.3 |
| Black - Caribbean | 110 | 0.02 |
| Black - African | 2,090 | 0.3 |
| Black - Other | 464 | 0.07 |
| Occupational Traveller | 207 | 0.03 |
| Gypsy / Traveller | 428 | 0.06 |
| Other Traveller | 91 | 0.01 |
| Other | 2,284 | 0.3 |
| Not known / not disclosed | 19,747 | 2.8 |
| Total | 702,391 | 100 |
| Ethnicity | Number | Percent |
|---|---|---|
| White - Scottish | 544,241 | 78 |
| White - Other | 63,291 | 9 |
| White - Gypsy/Traveller | 1,387 | 0.2 |
| White - Polish | 15,681 | 2.3 |
| White - Irish | 1,492 | 0.2 |
| Mixed | 10,066 | 1.44 |
| Asian - Indian | 6,598 | 1 |
| Asian - Pakistani | 14,101 | 2 |
| Asian - Bangladeshi | 1,195 | 0.2 |
| Asian - Chinese | 4,327 | 0.6 |
| Asian - Other | 4,208 | 0.6 |
| Caribbean/Black | 1,298 | 0.2 |
| African | 8,550 | 1.2 |
| Arab | 3,435 | 0.5 |
| Other | 4,081 | 0.6 |
| Not known/not disclosed | 13,917 | 2 |
| Total | 697,868 | 100 |
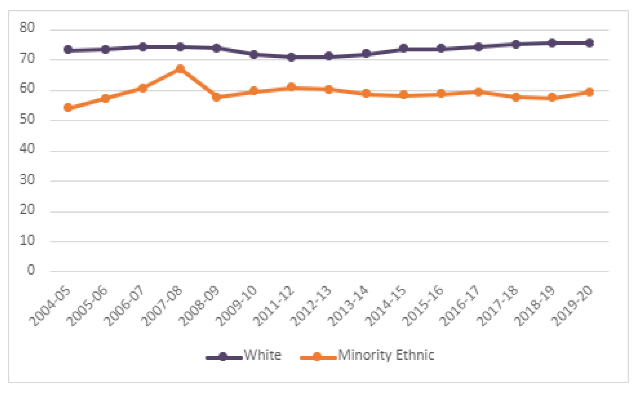
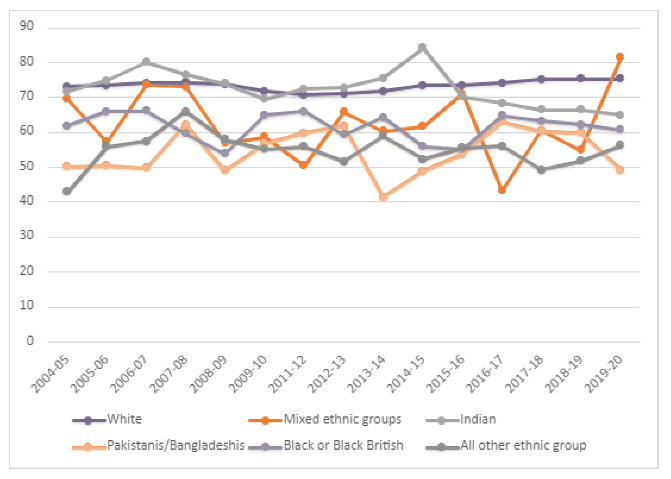
| Ethnicity | 2009/10 | 2010/11 | 2011/12 | 2012/13 | 2013/14 | 2014/15 | 2015/16 | 2016/17 | 2017/18 | 2018/19 | 2019/20 |
|---|---|---|---|---|---|---|---|---|---|---|---|
| White - Scottish | n/a | n/a | 89.5 | 90.3 | 91.5 | 91.9 | 91.3 | 92.7 | 93 | 94.9 | 93.2 |
| White - non-Scottish | n/a | n/a | 89.9 | 92.1 | 92.8 | 92.1 | 92.5 | 93.8 | 94 | 95.8 | 93.3 |
| Mixed or multiple ethnic groups | 87.1 | 88.9 | 86.4 | 92 | 93.6 | 92.8 | 92.7 | 92.4 | 93.6 | n/a | 92.3 |
| Asian - Indian | 93.3 | 94.2 | 93.9 | 91.2 | 96.6 | 96.3 | 96.9 | * | 97.2 | n/a | * |
| Asian - Pakistani | 88.7 | 89.5 | 92.7 | 92.4 | 93.2 | 95.2 | 92.5 | 95.6 | 93.5 | 93.8 | 97.2 |
| Asian - Chinese | 95.2 | 94.3 | 98.3 | 98.8 | 98.8 | 97.1 | 95.9 | * | 96.4 | 97.2 | * |
| Asian - Other | 91 | 89.6 | 94.4 | 95.7 | 97 | 96.2 | 95.1 | 95.3 | 93.9 | 97.1 | 95.0 |
| African/ Black/ Caribbean | 89.3 | 92.1 | 94.8 | 91.9 | 96 | 94.4 | 92.3 | 93.7 | 96 | * | 94.7 |
| All other categories | 77.8 | 81 | 91.9 | 92.1 | 91.9 | 91.2 | 87.9 | 94 | 92 | * | 93.4 |
| Not Disclosed/Not known | 79.6 | 84.5 | 87 | 88.1 | 88.5 | 90.1 | 88.8 | 90.7 | 89.6 | 96.4 | 91.2 |
Employment and Employability
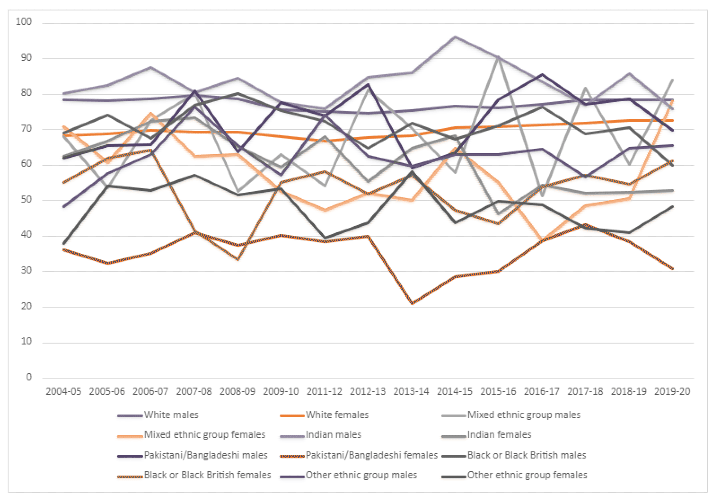
| Years | Ethnic minority | White |
|---|---|---|
| 2011 | 33.2 | 27.9 |
| 2012 | 36.9 | 27.8 |
| 2013 | 28.7 | 29.2 |
| 2014 | 29.5 | 27.8 |
| 2015 | 26.6 | 25.8 |
| 2016 | 18.3 | 22.9 |
| 2017 | 19.2 | 23.2 |
| 2018 | 17.3 | 22.8 |
| 2019 | 17.5 | 24 |
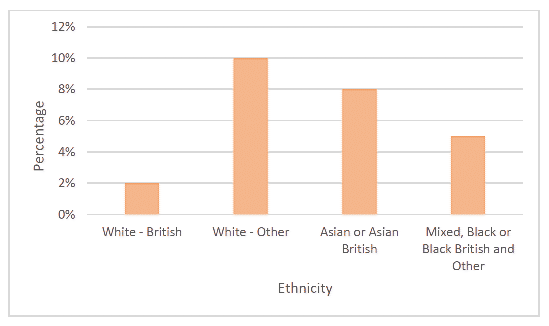
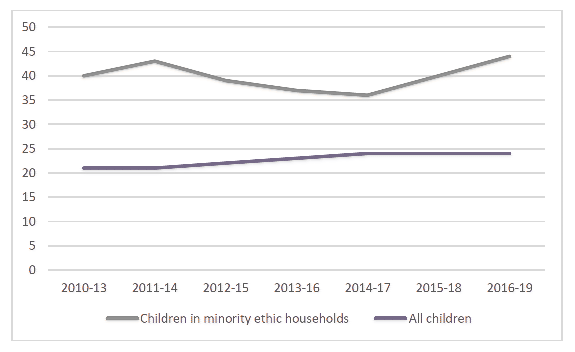
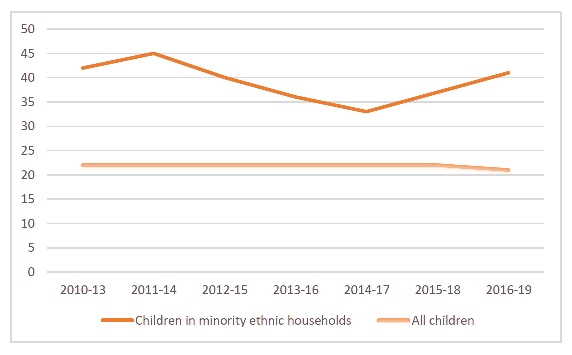
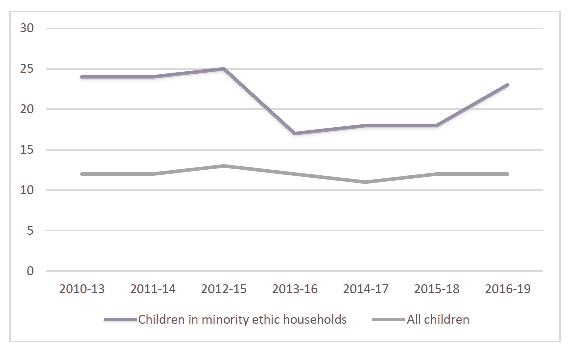
Income / Poverty
| 2013-18 | 2014-2019 | 2015-20 | |
|---|---|---|---|
| White-British | 18 | 18 | 18 |
| Asian or Asian British | 34 | 39 | 41 |
| White-Other | 26 | 25 | 24 |
| Mixed, Black or Black British and Other | 38 | 38 | 43 |
| Ethnicity | Relative poverty rate | Severe Poverty |
|---|---|---|
| White – British | 17 | 12 |
| White – other | 25 | 18 |
| Mixed/Multiple ethnic groups | 27 | 23 |
| Asian – Indian | 22 | 18 |
| Asian – Pakistani | 45 | 31 |
| Asian – other | 42 | 35 |
| Asian – Chinese | 51 | 43 |
| Black/African/Caribbean/Black British | 39 | 32 |
| Other ethnic group | 30 | 24 |
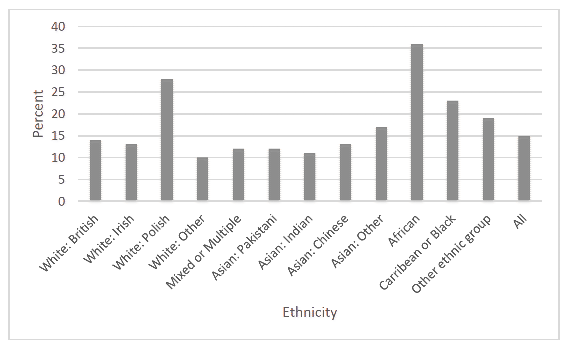
Health and Social Care
| Ethnic Group | Limiting condition | No limiting condition |
|---|---|---|
| 2012 | ||
| White: Scottish | 25.2 | 74.6 |
| White: Other British | 23.7 | 76.3 |
| White: Polish | 8.1 | 91.9 |
| White: Other | 15.1 | 84.8 |
| Asian | 10.8 | 89.2 |
| All other ethnic groups | 11.2 | 88.8 |
| 2013 | ||
| White: Scottish | 24 | 75.7 |
| White: Other British | 21.6 | 78.1 |
| White: Polish | 6.8 | 93 |
| White: Other | 11.5 | 87.7 |
| Asian | 8.1 | 91.5 |
| All other ethnic groups | 11.8 | 87.3 |
| 2014 | ||
| White: Scottish | 24.9 | 74.7 |
| White: Other British | 21.1 | 78.4 |
| White: Polish | 7.5 | 92.5 |
| White: Other | 15 | 84.9 |
| Asian | 9.2 | 90.8 |
| All other ethnic groups | 12.4 | 86.4 |
| 2015 | ||
| White: Scottish | 24.5 | 75.1 |
| White: Other British | 23.3 | 76.3 |
| White: Polish | 6.1 | 93.4 |
| White: Other | 12.4 | 87.6 |
| Asian | 14.6 | 85.3 |
| All other ethnic groups | 11.6 | 87.8 |
| 2016 | ||
| White: Scottish | 26 | 73.6 |
| White: Other British | 23.5 | 76.3 |
| White: Polish | 7 | 93 |
| White: Other | 12.4 | 87.5 |
| Asian | 10.3 | 89.5 |
| All other ethnic groups | 15 | 84.1 |
| 2017 | ||
| White: Scottish | 25.1 | 74.6 |
| White: Other British | 24.3 | 75.4 |
| White: Polish | 10.6 | 89.4 |
| White: Other | 14.2 | 85.5 |
| Asian | 12.3 | 86.4 |
| All other ethnic groups | 13.1 | 85.6 |
| 2018 | ||
| White: Scottish | 26.4 | 73.6 |
| White: Other British | 24.5 | 75.5 |
| White: Polish | 11.4 | 88.6 |
| White: Other | 12.1 | 87.9 |
| Asian | 12.9 | 87.1 |
| All other ethnic groups | 18.2 | 81.8 |
| 2019 | ||
| White: Scottish | 27.6 | 72.4 |
| White: Other British | 27.3 | 72.7 |
| White: Polish | 12.4 | 87.6 |
| White: Other | 15.2 | 84.8 |
| Asian | 13.3 | 86.7 |
| All other ethnic groups | 12.4 | 87.6 |
Housing