Coronavirus (COVID-19): framework for decision making - assessing the four harms
Sets out the four harms process for assessment used to establish when coronavirus restrictions could be safely lifted after lockdown and the scientific evidence underpinning the decisions.
The importance of demographics
Before considering the details of the four harms and to help make informed judgements, it is important to take account of the make-up of the population. The four harms impact differently on different groups within the population according to age, diversity and geography. This section of the report provides that background.
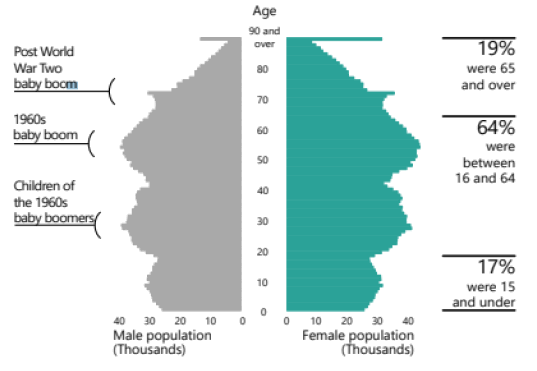
The age distribution of the Scottish population in mid-2019 is shown below. One in seven (14%) people in Scotland were aged 70 and over, two-fifths of people (40%) were aged 50+, and 11% were aged 16-24[2].
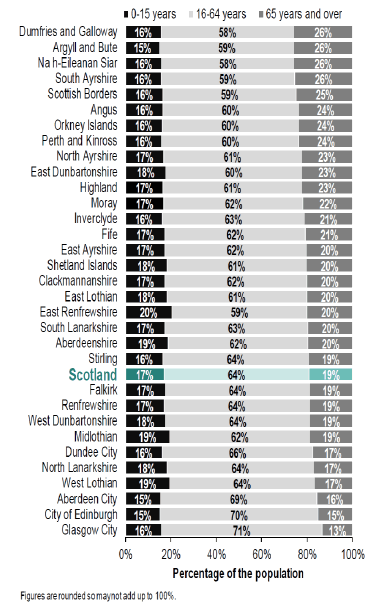
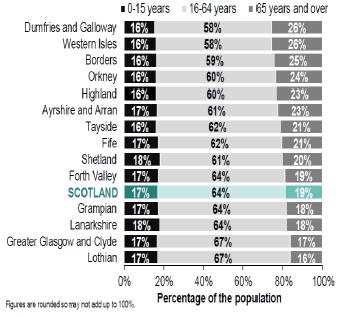
Looking at the age profile by local authority assists in identifying specific local concerns. It is important to understand the makeup of each local authority area. Figures 2 and 3 highlight the varying age ranges present in each of our local authorities and health boards. Given the importance of age in terms of vulnerability to the virus and the eventual outcome, areas with an older population may wish to assess risk differently to those with a younger population and to take different actions to protect the population.
Looking at the impact of age on health boards raises issues of capacity in hospitals, as an older population is more likely to need hospital and/or ICU care and also aftercare in the community[3].
As shown in Figure 4, since February, reported cases per 100,000 of the population have been highest for adults in those aged 85+ (3725 per 100,000 of population) and they are now lowest in 65-74 and 75–84 year olds (1047 and 1653 respectively). More women overall have been affected than men (1881 per 100,000 of population compared to 1586).
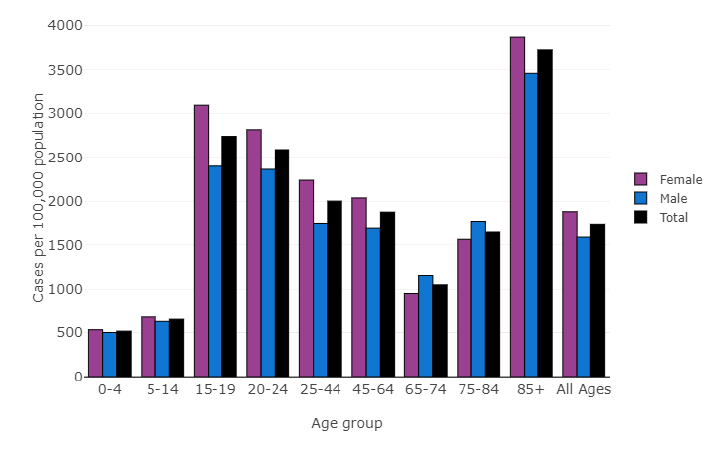
Understanding a country's age demographics and the pattern of cases across age over time, see Figure 5, can help predict the number of critical cases and assist in more precise planning of availability of hospital beds, staff and other resources.
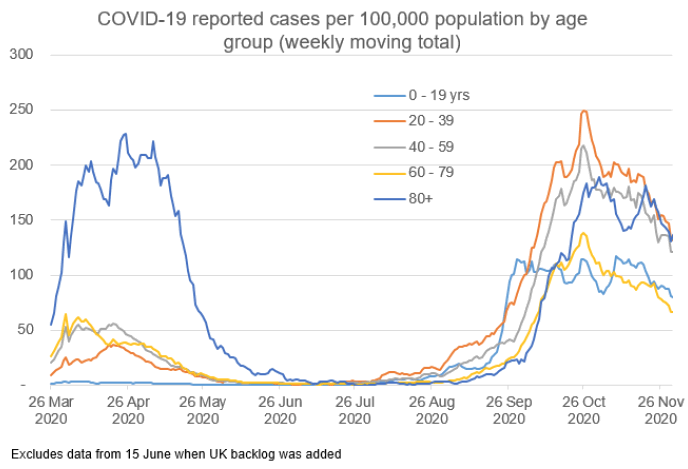
During the first peak of the pandemic, confirmed COVID-19 cases were disproportionately high among older people (aged 80+). However, during the second peak confirmed COVID-19 cases have been more evenly distributed among all age groups. The increased availability of tests could have led to the detection of cases of COVID-19 in a wider range of people, including those with less severe or no symptoms. The confirmed case rate among 20-39 year olds reached 250 weekly cases per 100,000 people in the week ending 26 October and is now at 133 (week ending 30 November). The pattern for 40-59 year olds is similar at a slightly lower rate, and is now at 122 weekly cases per 100,000 people. The increase in cases among people aged 80 and over followed the increases seen in younger age groups. Reported cases in 60-79 year olds has reduced recently and they now have the lowest case rate per 100,000 people (67 weekly cases in the week ending 30 November).
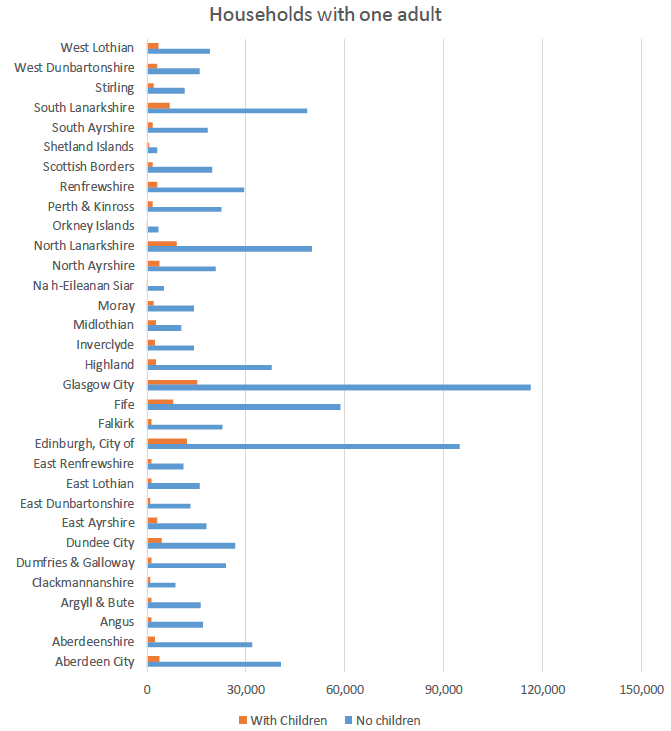
Figure 6shows the number of adults living alone or with children under 18[5]. As adults living alone are particularly impacted by restrictions on socialising and may also be in more need of support or assistance if self-isolating, the number of single adult households in the population is an important consideration.
Throughout the pandemic, we have used 'the household' as the basis for restrictions and activities and therefore it is important to understand something about household types in each local authority. For example, restrictions on meeting up can have a particular impact on larger families, more common in ethnic minority families, and on lone person households.
Table 1 shows the makeup of households across Scotland by ethnicity. Households from Asian, Asian Scottish or Asian British backgrounds tend to be larger. Larger households may be disadvantaged in terms of their ability to meet with other households depending on how socialising rules are specified.
Table 1 Average size of all households, and average number of children
| Ethnicity | Average number of children | Average household size |
|---|---|---|
| White | 0.4 | 2.1 |
| Any Mixed or Multiple Ethnic Groups | 0.4 | 2.0 |
| Asian, Asian Scottish or Asian British | 0.7 | 2.7 |
| African | 0.8 | 2.4 |
| Caribbean or Black | 1.3 | 3.0 |
| Other Ethnic Group | 0.9 | 2.9 |
| All | 0.4 | 2.1 |
Multi-generational households have been shown to be more vulnerable to transmission. In Scotland, around 260,000 households (10% of all households) include parents living with their adult children. This includes 169,000 couple households with non-dependent children, along with 91,000 single parent households with non-dependent children. There are a further 16,000 "multi-family households" (less than 1% of all households)[6]. This includes multi-generational, unrelated families and siblings. Minority ethnic households are far more likely to be multi-family, particularly South Asian households. (12.8% of Pakistani, 5.7% of Bangladeshi and 5.4% of Indian households.)
Around 53,000 households (2%) lived in overcrowded accommodation under the bedroom standard[7]. Social sector dwellings (4%) were more likely to be overcrowded than private sector dwellings (1%)[8].
In terms of gender, there is evidence to suggest that men are at greater risk of dying from the disease than women. For example, age-standardised rates for males were significantly higher than for females (164 compared with 113 per 100,000 people in March to October[9]) although recent evidence suggests higher infection rates amongst women than men[10]. In the pre-COVID-19 labour market, women were more unequal in terms of pay, participation and progression due to a variety of drivers, including occupational segregation, job valuation, discrimination, and time available to work[11].
It would also appear that people of minority ethnicities are at a greater risk of transmission and serious illness, and research is being carried out to determine the reasons for this[12]. Some of these may be socio-economic, in that deprivation can play a role in the spread of the virus. There could be a cultural element with large families with several generations living under one roof. Some may be genetic, where some groups react differently to infection with the virus and some may be related to public facing employment in health, care, tourism or retail.
Likewise disabled people are also at a greater risk. Data from Public Health England show that[13] disabled people had a higher age standardised rate of death involving COVID-19 than those who were non-disabled[14]. Again, there will be a range of reasons for this. Whilst some health conditions are known to be risk factors for COVID-19, there will also be wider issues. The wearing of face coverings may not be appropriate for disabled people with particular impairments or health conditions, meaning that they are less protected. Disabled people may be more likely to live in poverty, and deprivation can play a role in the spread of the virus. Disabled people may also be more likely to use public transport or car share for essential journeys and to have limited access to the internet, resulting in their experiencing greater levels of risk. People with learning disabilities, mental health conditions or sensory impairments may find it more difficult to respond to protection guidance and comply with safety advice, exposing them to greater risk.
Contact
Email: covidexitstrategy@gov.scot