Funded early learning and childcare in private, third sector and childminding settings: delivery costs
This report presents findings from a national data collection exercise commissioned by the Scottish Government to understand the costs of delivering funded Early Learning and Childcare (ELC) in private, third sector, and childminding settings.
Profile of Respondents
This chapter provides an overview of the settings that participated in the data collection exercise. It presents information on the number and type of providers, their geographic distribution, operational characteristics, and premises arrangements. The chapter also explores changes in commissioned hours and discusses how these factors influence cost structures across different types of ELC provision.
Number and type of settings
A total of 506 funded ELC providers participated in the data collection exercise. This included:
- 342 day care of children services, comprising:
- 224 private providers
- 118 third sector providers
- 164 childminding services, although many childminders did not complete the financial sections of the survey with only around 40 doing so.
This sample represents a broad cross-section of the sector. While the overall response rate is strong, the drop-off in financial data completion highlights a recurring challenge in engaging services in detailed cost reporting. This has implications for the robustness of cost estimates across provider types and across different geographies.
Approximately 270 responses contained sufficient financial data to support cost per hour calculations. These responses form the analytical base for the cost estimates presented later in the report.
Geographic Spread
Responses were received from settings in all 32 local authority areas across Scotland, providing broad national coverage (see Figure 1). However, the number of responses, and particularly the number of complete financial returns, varied significantly by area. For example, Glasgow City, Highland, and Moray had relatively high levels of engagement, while areas such as Na h-Eileanan Siar, Orkney Islands, and Clackmannanshire had very few responses. This reflects the very low numbers of private, third sector, and childminder providers in these local authorities; for instance, at the time of the survey there were no private or third sector providers in Orkney (only childminders).
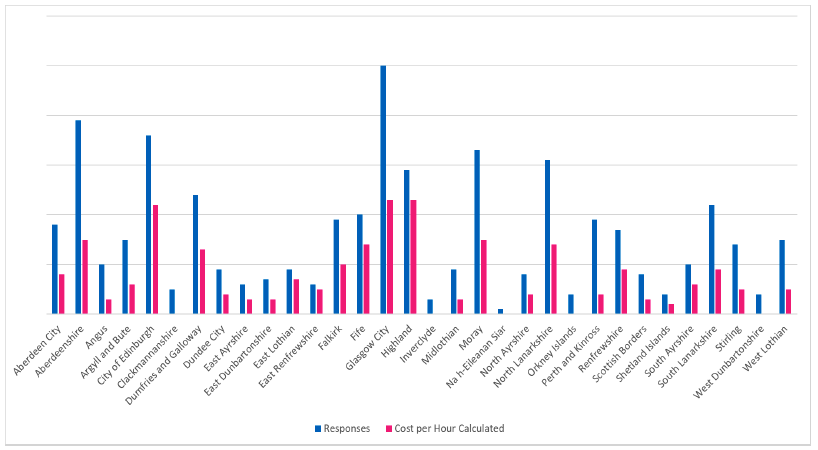
This uneven distribution means that local authority-level cost estimates are only available for a subset of areas where sufficient data was returned. In many cases, the number of settings providing complete financial information was too low to support robust analysis at the local level. Where these are possible they are presented in the accompanying data tables (available here). As a result, while the dataset supports national-level findings and broad regional comparisons, caution should be exercised when interpreting results for individual local authorities.
The variation in response rates may reflect differences in local engagement, capacity, or perceptions of the data collection exercise. It also reinforces the importance of continued collaboration with local authorities and provider networks to support any future rounds of data collection.
Operational characteristics
The survey captured a range of operational metrics that help contextualise cost structures across settings. These included the number of weeks settings were open per year, hours open per week, and the number of children registered.
Childminding services reported being open for an average of 46 weeks per year, with both the mean and median values aligning. Day care of children services were open slightly longer on average, with a mean of 47 weeks and a median of 50 weeks, indicating some variation in operating patterns across settings (see Figure 2). A notable pattern was a significant proportion of settings reporting being open for 38 or 39 weeks reflecting being operational during term time. This arrangement was more common among third sector day care of children settings than private day care of children settings.
| Type of Service | Mean | Median |
|---|---|---|
| Childminding service | 46 | 46 |
| Day care of children service | 47 | 50 |
| Private Provider | 50 | 50 |
| Third Sector | 42 | 39 |
In terms of weekly operating hours, childminders reported a mean of 44 hours and a median of 45 hours, while day care of children services reported a mean of 43 hours and a median of 50 hours (see Figure 3).
| Type of Service | Mean | Median |
|---|---|---|
| Childminding service | 44 | 45 |
| Day care of children service | 43 | 50 |
| Private Provider | 48 | 50 |
| Third Sector | 34 | 30 |
The number of children registered also varied significantly by provider type (see Figure 4). Childminders reported an average of 6 children, with a median of 7, reflecting their smaller scale and more personalised service model. Day care of children services, by contrast, reported a mean of 47 children and a median of 41, highlighting their larger capacity and more formalised structure. It should be noted that these averages are lower than the known population as a whole which must be taken into account when considering the estimates provided throughout the remainder of this report.
| Type of Service | Mean | Median |
|---|---|---|
| Childminding service | 6 | 7 |
| Day care of children service | 47 | 41 |
These operational characteristics are important when interpreting the cost data. Settings open for more weeks or longer hours may have higher staffing and utility costs, but also greater capacity to spread fixed costs across more children. Similarly, smaller settings may face proportionally higher costs per child due to limited economies of scale (see Figure 12).
Tenure
Premises arrangements varied significantly across provider types, with implications for fixed costs and financial sustainability. Among childminding services, the majority (59%) operated from premises owned with a mortgage, while 25% owned their premises outright (see Figure 5). A smaller proportion (11%) rented from public sector organisations, and very few rented from private landlords or received premises rent-free.
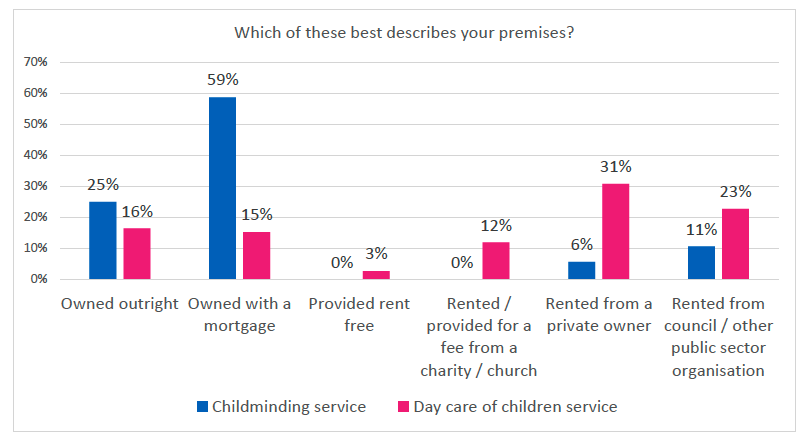
Day care of children services showed a more diverse range of arrangements. Around 31% rented from private owners, 23% rented from councils or other public sector organisations (this is higher among third sector providers), and 16% owned their premises outright. A further 12% rented from charities or churches, and 3% reported receiving premises rent-free.
These findings reflect the diversity of business models across the sector. Childminders are more likely to operate from their own homes, which may reduce rental costs but introduce other financial pressures such as mortgage repayments and utility bills. Day care of children providers, particularly in the private sector, are more likely to rent premises, often at commercial rates, which can be a significant cost driver.
Change in number of funded hours
Providers were asked whether the number of funded ELC hours they were commissioned to deliver had changed over the past year. The responses reveal notable differences between childminding services and day care of children services (Figure 6).
Among childminders, the picture is mixed:
- 26% reported a decrease in commissioned hours, a significant proportion that may reflect shifting demand, local authority commissioning decisions, or challenges in sustaining funded provision.
- 44% said their hours had stayed the same, suggesting relative stability for many.
- 30% reported an increase, indicating growth opportunities for some childminders.
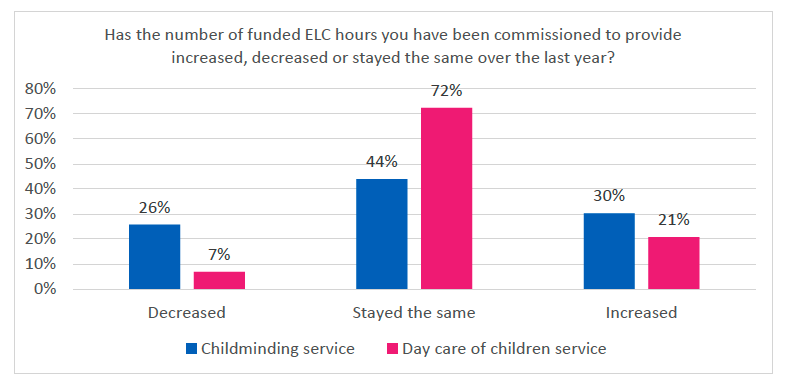
In contrast, day care of children services showed greater stability across all types of service:
- Only 7% reported a decrease in commissioned hours.
- A large majority, 72%, said their hours had stayed the same, suggesting that commissioning arrangements for centre-based provision have remained relatively consistent.
- 21% reported an increase, pointing to some expansion in funded delivery, though less pronounced than among childminders.
These findings suggest that childminders are experiencing more volatility in commissioned hours than day care of children providers. This may be a result of the smaller number of children per setting meaning that even small changes in the number of children being provided for can have significant impact on perception of the provision being delivered. Changes of 1 or 2 children in larger settings may be more likely to be reported as the same.
Implications for cost structures
Insights from provider engagement throughout the data collection process highlighted a number of structural factors that influence the cost of delivering funded ELC. Providers consistently pointed to differences in scale, staffing models, premises arrangements, and access to support as key drivers of variation in costs.
Smaller settings, particularly childminders, noted that while their overall costs may be lower, they often face higher costs per child due to limited capacity and fewer opportunities to spread fixed costs. Many childminders operate from their own homes, which can reduce rental costs but introduce other financial pressures such as mortgage repayments and utilities. Several also highlighted the number of hours devoted to administrative tasks that take place out of hours.
Private providers, especially those renting premises from commercial landlords, reported significant exposure to inflationary pressures and rising fixed costs. These providers emphasised the importance of sustainable rates that reflect the realities of operating in a competitive market, including the need to pay staff fairly and invest in quality improvements.
Third sector providers reported that they often operate with tighter margins and rely on a mix of local authority contracts and grant funding. Some benefit from in-kind support such as subsidised premises or shared resources, but others face challenges in maintaining financial sustainability while delivering high-quality care.
Contact
Email: elc@gov.scot