Coronavirus (COVID-19): state of the epidemic - 16 April 2021
This report brings together the different sources of evidence and data about the Covid epidemic to summarise the current situation, why we are at that place, and what is likely to happen next
Method
This report brings together a wide range of publically available figures from a range of data sources. These include publications by Scottish Government, Public Heath Scotland, National Records of Scotland, Office for National Statistics along with scientific publications and SAGE summaries where appropriate to summarise the state of the epidemic in Scotland in a given week. We also provide information on public attitudes to the virus from weekly You Gov polling surveys.
The national picture
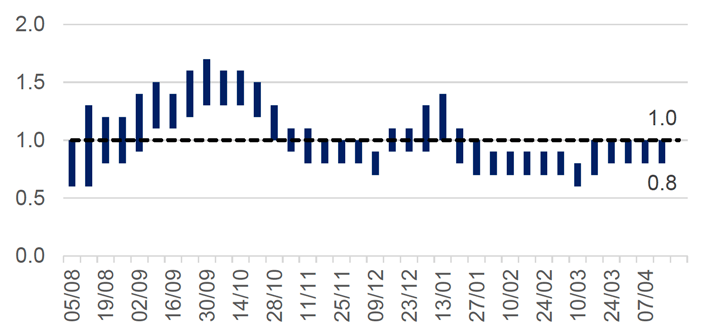
The latest R value for Scotland (published on 15 April)[2] has remained the same this week and was between 0.8 and 1.0 (Figure 1), with a growth rate of between -4% and 0%.
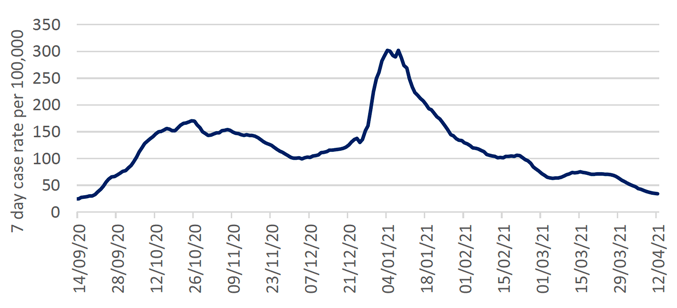
Since they were introduced in early January at a national level we have seen the impact of stay at home measures in reducing the level of SARS-CoV-2 in Scotland. An average of 250 cases were reported per day in the 7 days to 15 April, this is a 24% decrease from the daily average cases recorded a week earlier to 8 April[3]. Average daily cases reported are now around a tenth of the peak of 2,323 in the week to 7 January. Our current position is 34 weekly cases per 100,000 in the week to 12 April[4]. This compares to 302 weekly cases per 100,000 on 8 January and is similar to the weekly case rate observed on 21 September (see Figure 2)[4].
The number of locations where the levels of Covid in wastewater are monitored has increased from 28 to 97 sites around Scotland. In contrast to COVID-19 case records, virus shedding into wastewater is a biological process. This means that wastewater data is unaffected by factors that impact whether testing is done. The overall level of wastewater RNA was similar to last week, consistent with a slow decline in the rate of new cases.
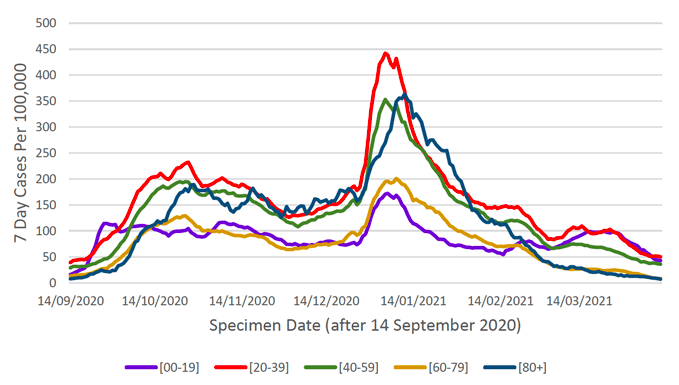
Case rates in all age groups have decreased, with a sharpest decline in cases in those aged 60+ this week (Figure 3).
Not everyone who has the virus will be tested, as many people do not realise they have COVID, or have mild symptoms and do not come forward. Latest modelled estimates suggest there are currently anywhere between 200 and 1,500 people infected in Scotland each day[2]. This means that as of 14 April there were between 4 and 28 new daily infections per 100,000 people.
The number of people in hospital with confirmed Covid for less than 28 days is declining. After peaking at 2,053 on 22 January, this figure has decreased and as of 8 April there were 115 patients in hospital with COVID-19. In addition, there was a fall in daily hospital admissions for people with Covid from a peak of 242 on 11 January to 10 on 11 April[6].
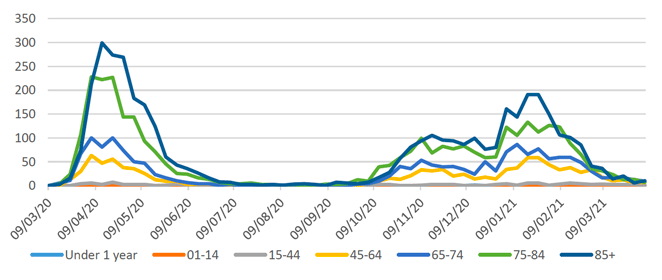
There were 34 deaths registered where Covid was mentioned on the death certificate in the week to 11 April. This is an 11% decrease on the week before (38 deaths), and 95% lower than the peak in April 2020 (663 deaths). The proportion of deaths in care homes has decreased from 36% in mid-December to 15% of total deaths in the week to 11 April. However, this has increased from 9% in the week to 21 March. Deaths involving coronavirus have declined most in those aged 75-84 and have gone down by 70% in this age group over the 3 weeks to 11 April[7] (Figure 4). Deaths in those aged 15-44, 65-74, 45-64 and 85+ have declined by 50%, 47%, 30% and 29% respectively over the same period.
How Scotland compares with the rest of the UK
The latest ONS survey estimates that the proportion of the population infected in the community in Scotland (0.20% people currently testing positive for COVID-19 on 4 -10 April) has decreased slightly since last week and is now below England (0.21%), and above Northern Ireland (0.14%) and Wales (0.11%). In the week to the 10 April the estimated rate of community infection was 1 in 500 people in Scotland, compared to 1 in 480 for England, 1 in 920 for Wales and 1 in 710 for Northern Ireland[8]. Average daily deaths in Scotland (0.04 per 100,000 in the week to 15 April) are below Northern Ireland (0.07), but in line with England (0.04), and Wales (0.04). The Coronavirus Infection Survey estimated that in the week to 28 March, 46.0% of the population in Scotland would have tested positive for antibodies against COVID-19. This compares to 54.9% in England, 49.1% in Wales, and 54.5% in Northern Ireland[9].
Situation by local authority within Scotland
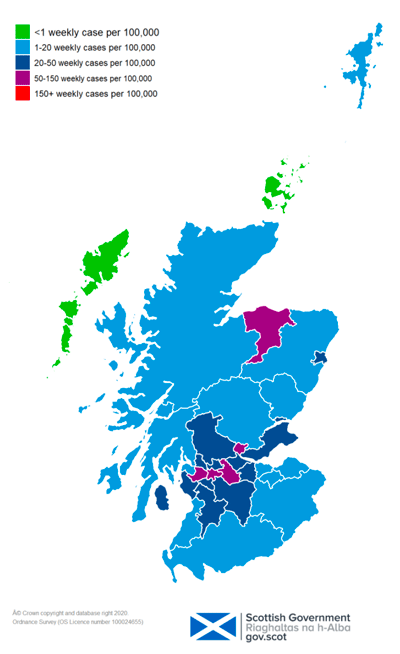
Clackmannanshire currently has the highest case rates in Scotland with 81 weekly cases being reported per 100,000 in the week to 12 April. This is a decrease of 53% from the week to 5 April[4]. There are mostly moderate and low levels of cases across Scotland, with higher levels of cases observed across the central belt (Figure 5). Most Local Authorities recorded a fall in cases in the last week, however Moray saw a 75% increase in its case rates (from 29 to 51 weekly cases per 100,000) in the period of 5-12 April. Angus, Argyll and Bute, Dumfries and Galloway, Midlothian and Scottish Borders each have fewer than 10 weekly cases per 100,000. Na h-Eileanan Siar and Orkney each had 0 cases per 100,000 in the last week[4].
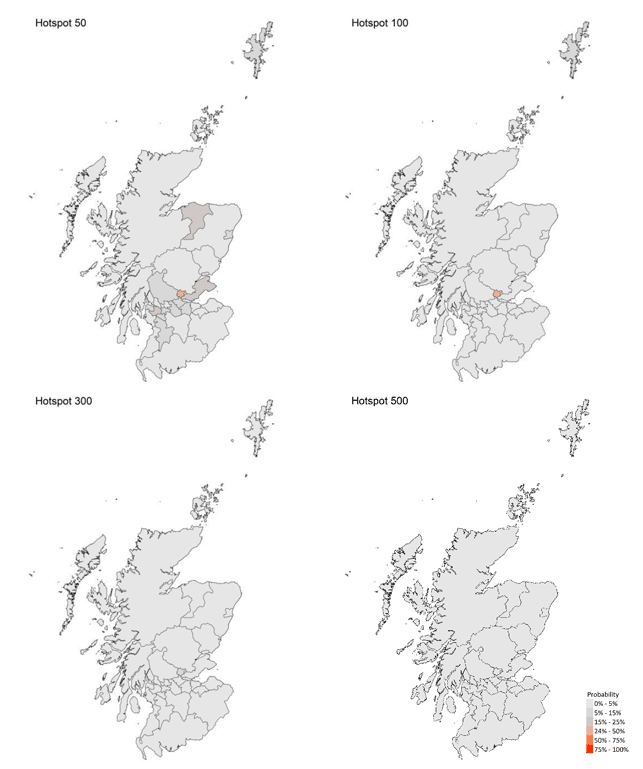
The most recent modelling predicts that for the week ending 1 May, there are no local authorities with at least a 75% probability exceeding 50 cases per 100,000 population (Figure 6)[2].
Children and Education
Children in early learning and childcare and those in primaries 1-3 went back to school or nursery on 22 February, and all children in primaries 4-7 went back on the 15 March. There has also been a phased return to secondary schools, with some Senior Phase (S4-S6) pupils returning to school on a part-time basis to attend practical lessons from the 22 February and all secondary school pupils (S1-S6) returning on a part-time basis from the 15 March. All children and young people are expected to return to full time education on the 12th or 19th April.
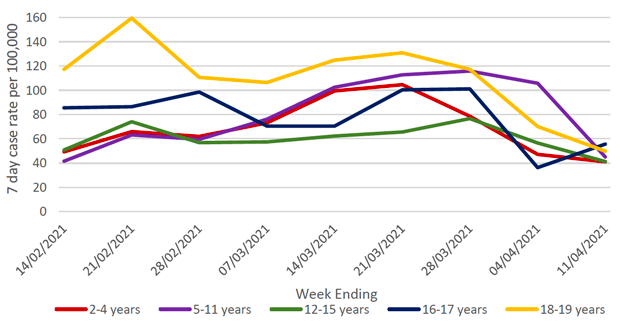
Over the last week there was a decrease in the total number of COVID-19 cases in children, which has gone down from 776 cases in the week to 4 April to 471 cases in the week ending 11 April. This is lower than in any week since September. The sharpest fall in 7 day cases per 100,000 was observed in those aged 5-11 (Figure 7)[11], with the highest proportion of cases still observed in those under 12 (258 cases). There has been a decrease in testing amongst most age groups in week ending 11 April, with a slight increase in those aged 16-17. Test positivity rates have increased in those aged 2-4, 5-11 and 16-17, however decreased in those aged 12-15 and 18-19 in the same period[11]. Overall, the proportion of school, early learning and childcare settings with incidents remains low.
Looking ahead
Changes in patterns of mixing and adherence to restrictions will impact on future case numbers. The Scottish Contact Survey measures times and settings that people mix where they could potentially spread Covid[2]. From this survey we can say that contacts are still higher than seen during the lockdown period (averaging around 3 daily contacts) but have decreased slightly in the last two weeks, with a current level of 3.5 daily contacts. Contacts within the work setting have shown a decrease in the last two weeks by 25% and 36% respectively, coinciding with spring holidays that commenced from 26th March. Mean contacts in the home setting have increased by approximately 16% over the same period. Those aged under 50 have shown a decrease in overall contacts whereas those aged 50 and over have increased their contacts. Although the older population have increased their contacts in the last two weeks, daily cases and deaths have declined over the same period.
Self-reported compliance with the current regulations and guidance has decreased since January but remains at a high level. On 13-14 April, 74% of people reported 'complete' or 'almost complete' compliance[12].
Hospital bed and ICU occupancy are projected to fall over the next few weeks, but these both may plateau or increase as a result of schools reopening and other relaxations of non-pharmaceutical interventions[2].
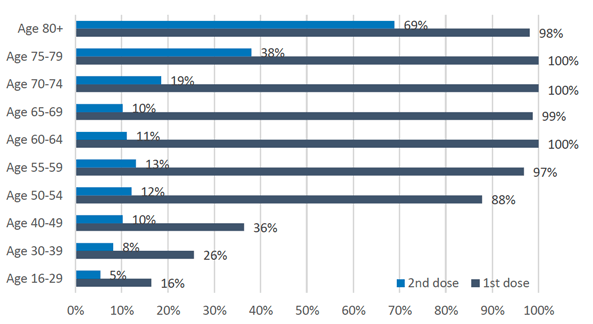
Vaccinations are continuing across the priority groups and almost 60% of the adult population in Scotland has now been vaccinated with the first dose[4]. The first vaccines were administered on Tuesday 8 of December and 2,708,691 had received their first dose by 15 April 2021, a 4% increase from the 8 April[3]. By the 15 April over 34,000 residents in care homes had received their first vaccination along with over 52,000 care home staff. In older adult care homes almost 90% of residents have now received their second dose. By age group, almost 100% of individuals aged 55+ and 88% of those aged 50-54 had received their first vaccination (Figure 8). 69% of the over 80s and 38% of those aged 75-79 have received their second dose. Overall, 661,975 (14.6%) of those aged 16 and had received their second dose by 15 April[6]. There are continual decreasing hospitalisations and deaths among those groups vaccinated first (Figure 4).
The proportion of people surveyed who said they would be likely to be vaccinated for COVID-19 remains high. 63% of all respondents have already received at least their first vaccine dose. Of those not vaccinated, 75% report they are likely to be vaccinated when a vaccine becomes available to them[13].
How the virus is changing
The variant of the virus commonly known as the UK variant (VOC-20DEC-01) has been increasing its share of confirmed cases since it was first detected in Scotland in mid-December and is now the dominant strain[14]. This new variant of Covid is more transmissible[15]. It is likely that infection with this variant is associated with an increased risk of hospitalisation and death compared to infection with non-VOC viruses[16].
Other variants of concern (VOCs) are being monitored by sequencing of SARS-CoV-2 samples. To date there are four VOCs and six variants under investigation[17]. Up to 14 April, there have been 32 genomically confirmed cases of the variant VOC-20DEC-02 (first seen in South Africa) detected in Scotland. There have been 6 confirmed cases of the variant VOC-21JAN-02 (first identified from Brazil). There have also been a number of cases of other variants, which are currently under investigation, including 26 cases of B.1.525, first seen in Nigeria. There is some concern, that some of these new variants may partially escape immunity, from both natural infection and from vaccines currently being deployed, and we are monitoring the evidence on this[18 19 20].