Coronavirus (COVID-19): state of the epidemic - 11 March 2022
This report brings together the different sources of evidence and data about the Covid epidemic to summarise the current situation, why we are at that place, and what is likely to happen next.
Estimated Infection Levels and Case Numbers
Estimated Infection Levels
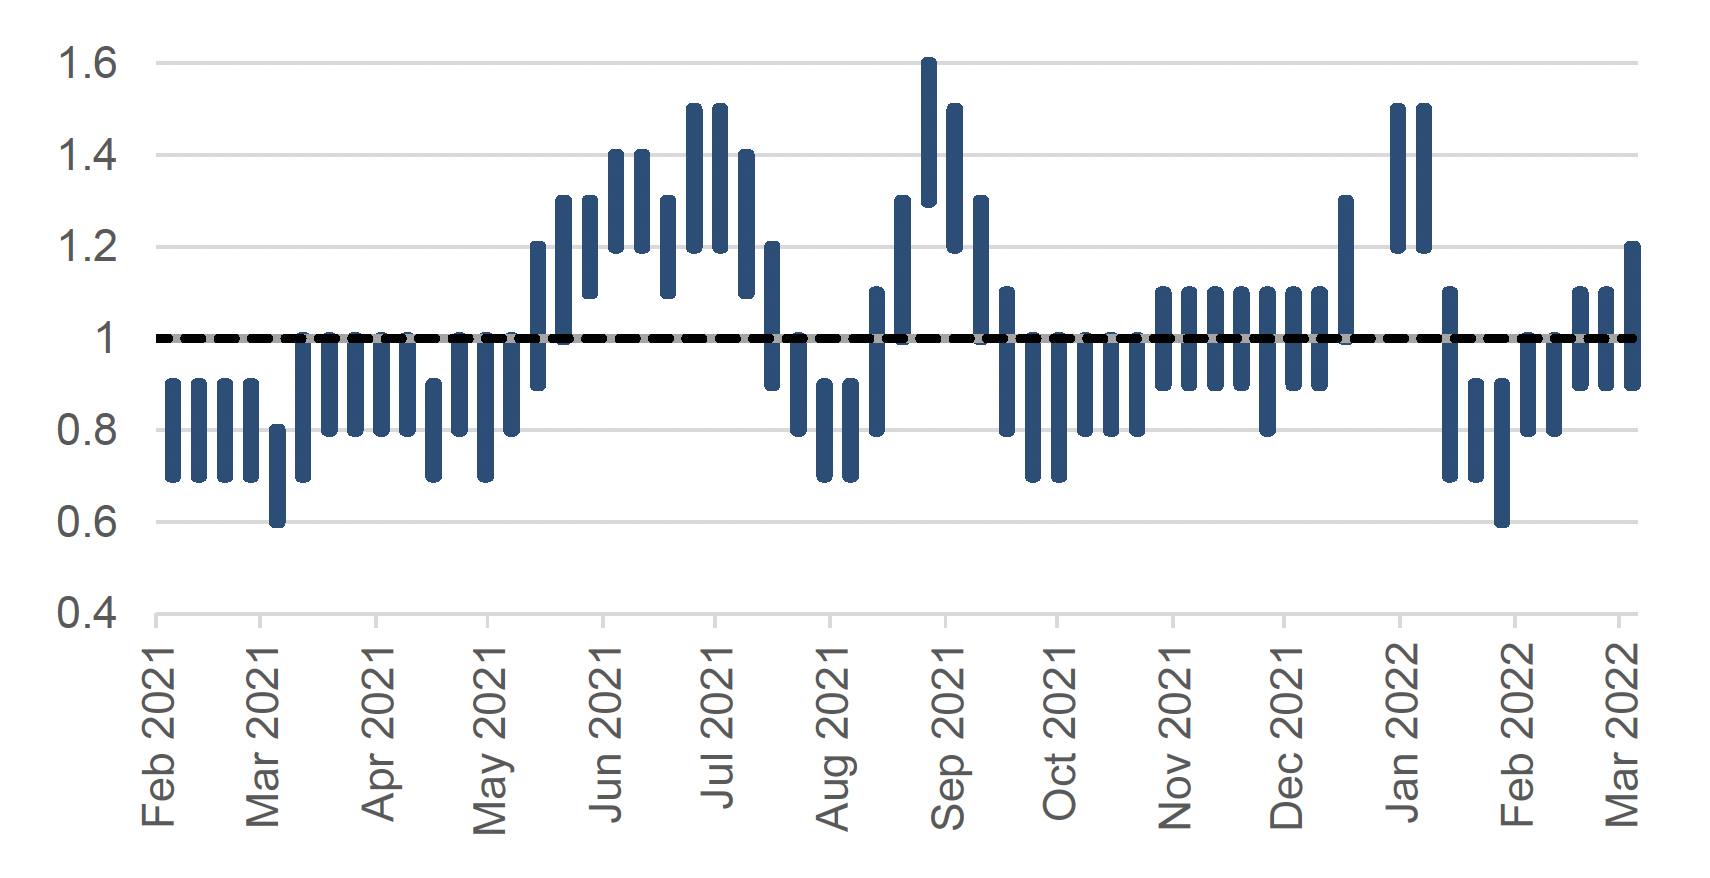
The reproduction number (R) is the average number of secondary infections produced by a single infected person. If R is greater than one the epidemic is growing, if R is less than one the epidemic is shrinking. The higher R is above one, the more people one infectious person might further infect other people and so the faster the epidemic grows. Please note that R is an indicator that lags by two or three weeks. For more information please visit the UK government website.
The UK Health Security Agency's (UKHSA) consensus estimate for R in Scotland as at 22 February is between 0.9 and 1.2. The lower limit of the R value has remained unchanged since the last published figure, but the upper limit has increased (Figure 1) [2] [3].
This week, EMRG was not able to agree on a consensus for incidence values in Scotland. The individual model estimates for incidence form two clusters where the confidence intervals of these two clusters do not cross. It is hence deemed that these estimates do not form a consensus, and therefore a combination is not provided[5].
The growth rate reflects how quickly the numbers of infections are changing day by day. It is an approximation of the percentage change in the number of new infections each day. More information can be found on the UK government website.
The latest growth rate for Scotland as at 22 February was between -1% and 2%. Both the upper and lower limits have remained unchanged since the last published figure[6] [7].
Covid Infection Survey
The Covid-19 Infection Survey is a UK wide study carried out by the Office for National Statistics (ONS) and the University of Oxford. The survey invites private residential households to test whether they have the infection, regardless of whether they have symptoms, using a PCR test. Participants are also asked to provide a blood sample to test for antibodies. This means the study is unaffected by testing policy changes mentioned at the start of this report.
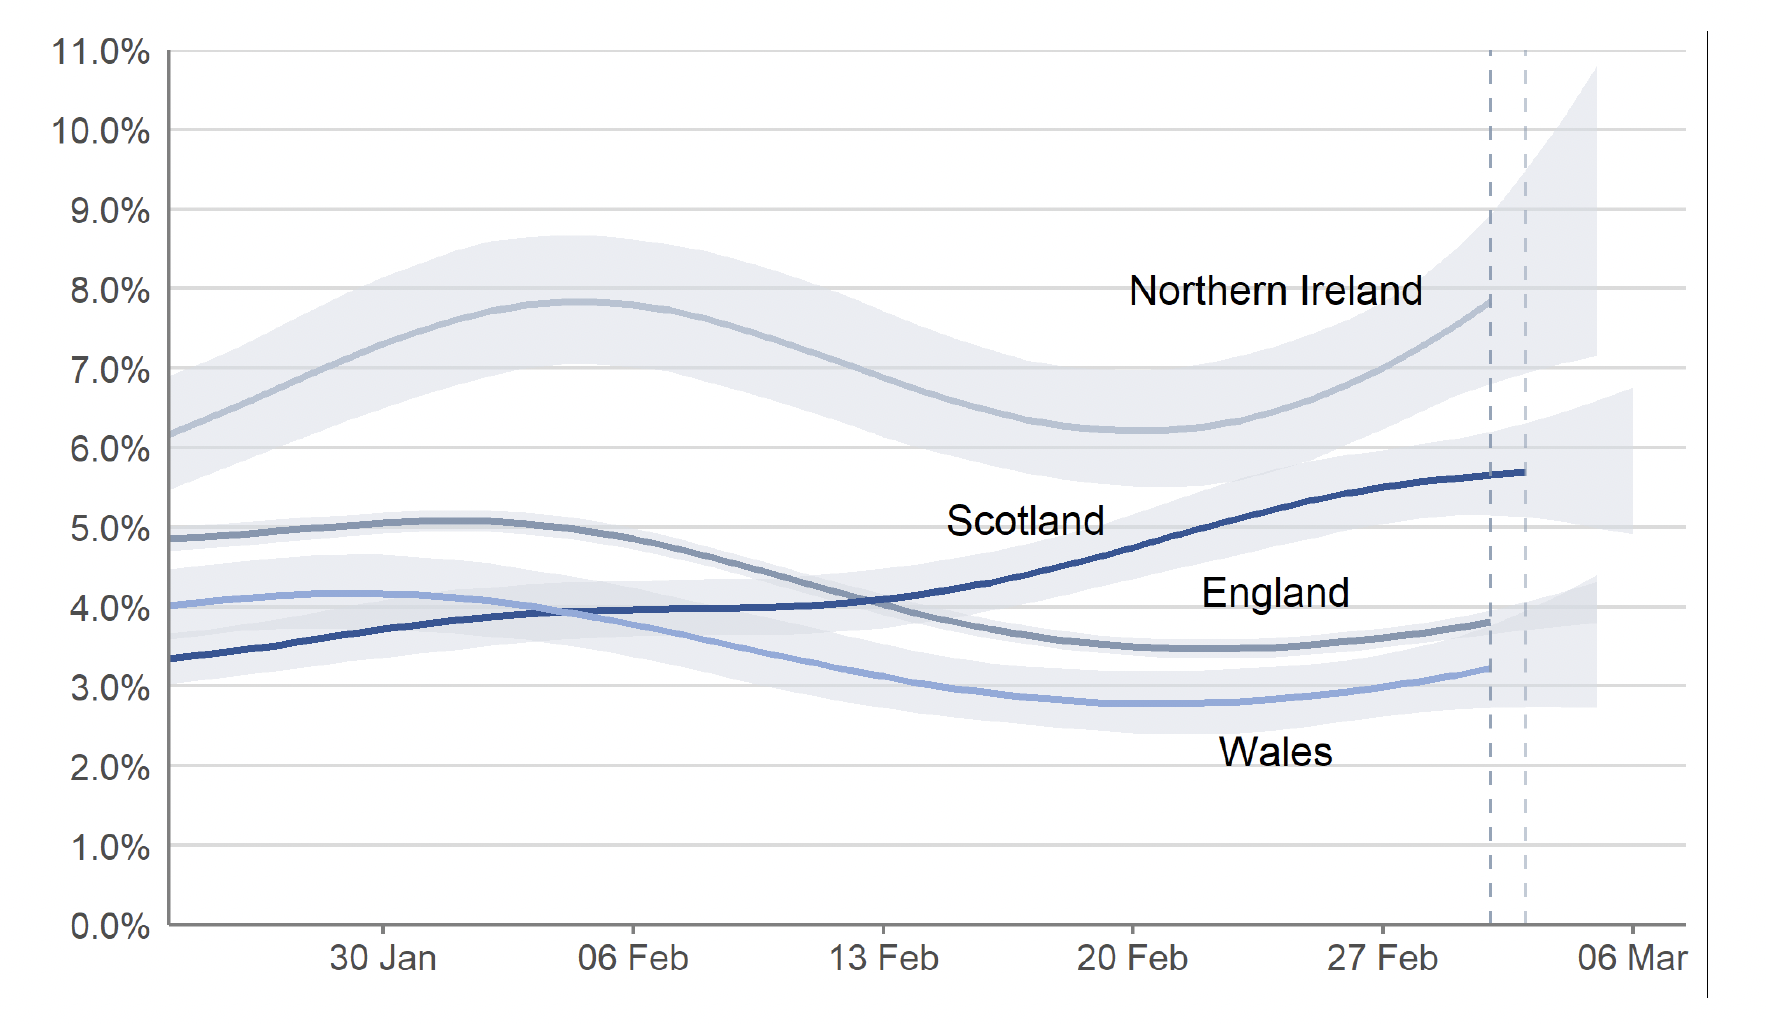
In Scotland, the percentage of people testing positive for Covid-19 as estimated by the Covid Infection Survey continued to increase in the week ending 6 March 2022, as seen in Figure 2, surpassing the previous peak from early January 2022[8]. Meanwhile, the case rate (including reinfections) by specimen date has sharply increased in Scotland in the week to 5 March. See section Covid-19 Cases for further analysis on case rates.
The estimated percentage of people testing positive for Covid-19 in the private residential population in Scotland is 5.70% (95% credible interval: 5.13% to 6.31%)[9], equating to around 1 in 18 people (95% credible interval: 1 in 19 to 1 in 16). This is the highest estimated percentage of people testing positive since the start of the pandemic according to the Covid-19 Infection Survey. The previous peaks in Scotland recorded 2.29% in the week to 11 September 2021, 1.24% in the week to 17 July 2021, and 5.65% in the week to 7 January 2022[10].
In the week 27 to 5 March 2022, estimates for the other nations of the UK are as follows and can be seen in Figure 2:
- In England, the percentage of people testing positive has increased in the most recent week. The estimated percentage of people testing positive is 3.80% (95% credible interval: 3.65% to 3.95%), equating to around 1 in 25 people (95% credible interval: 1 in 25 to 1 in 25).
- In Wales, the percentage of people testing positive in private residential households increased in the most recent week. The estimated percentage of people testing positive is 3.22% (95% credible interval: 2.73% to 3.77%), equating to around 1 in 30 people (95% credible interval: 1 in 35 to 1 in 25).
- In Northern Ireland, the percentage of people testing positive increased in the most recent week. The estimated percentage of people testing positive is 7.84% (95% credible interval: 6.80% to 8.93%), equating to around 1 in 13 people (95% credible interval: 1 in 15 to 1 in 11).
In Scotland, the estimated proportion of people testing positive increased for children of nursery and primary school age, and those aged above 40 in the week to 6 March. The trend is uncertain for children in secondary school and young adults in this week[11]. Meanwhile, the case rates (including reinfections) by specimen date increased in all age groups in the week to 5 March compared to the previous week[12]. See section Covid-19 Cases for further analysis on case rates by age group.
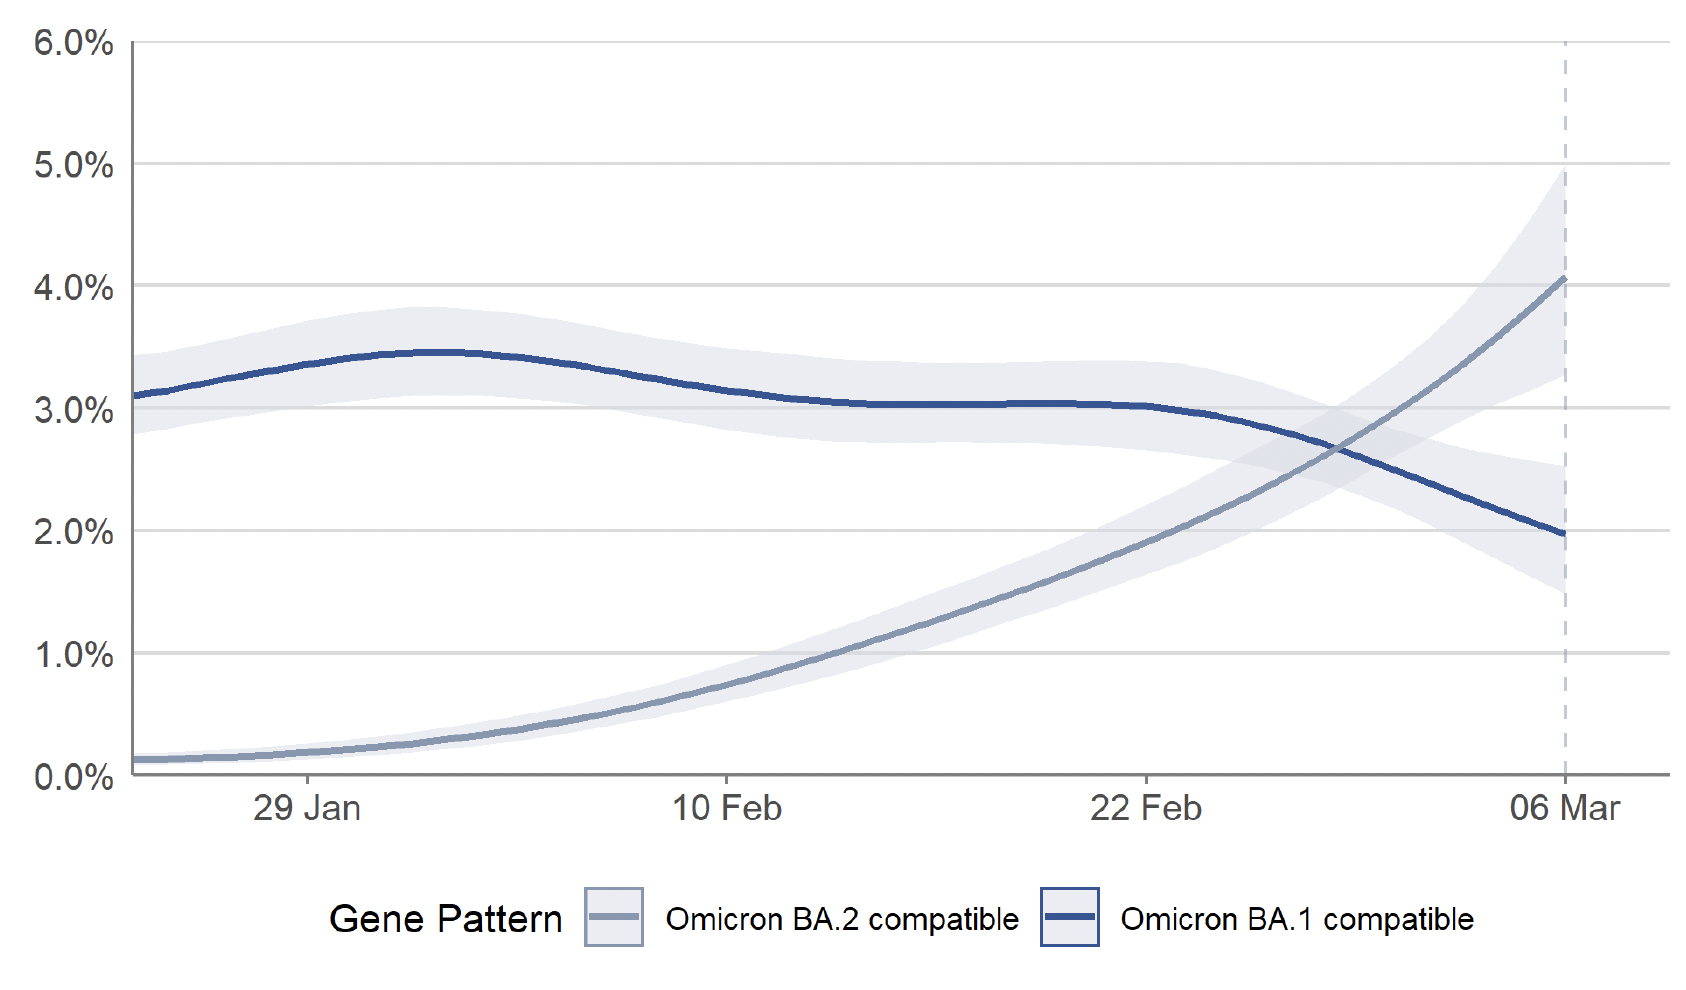
This increase in estimated infection levels in Scotland has correlated with the increasing prevalence of the Omicron BA.2 variant in Scotland since early February. Omicron BA.2 is likely to have a growth advantage over Omicron BA.1[13], and is now estimated to be the dominant variant in Scotland. According to the Covid-19 Infection Survey, the percentage of people testing positive with cases compatible with Omicron BA.2 in Scotland continued to increase in the most recent week to 6 March while the percentage of people testing positive with cases compatible with Omicron BA.1 decreased in the most recent week (Figure 3).
Wastewater Estimates
The Scottish Government has been working with the Scottish Environment Protection Agency (SEPA) to detect and analyse fragments of Covid-19 virus RNA in wastewater. The number of locations where the levels of SARS-CoV-2 in wastewater are monitored has increased to 141 sites around Scotland. In contrast to Covid-19 case records, virus shedding into wastewater is a biological process. This means that wastewater data is unaffected by factors that impact whether testing is done.
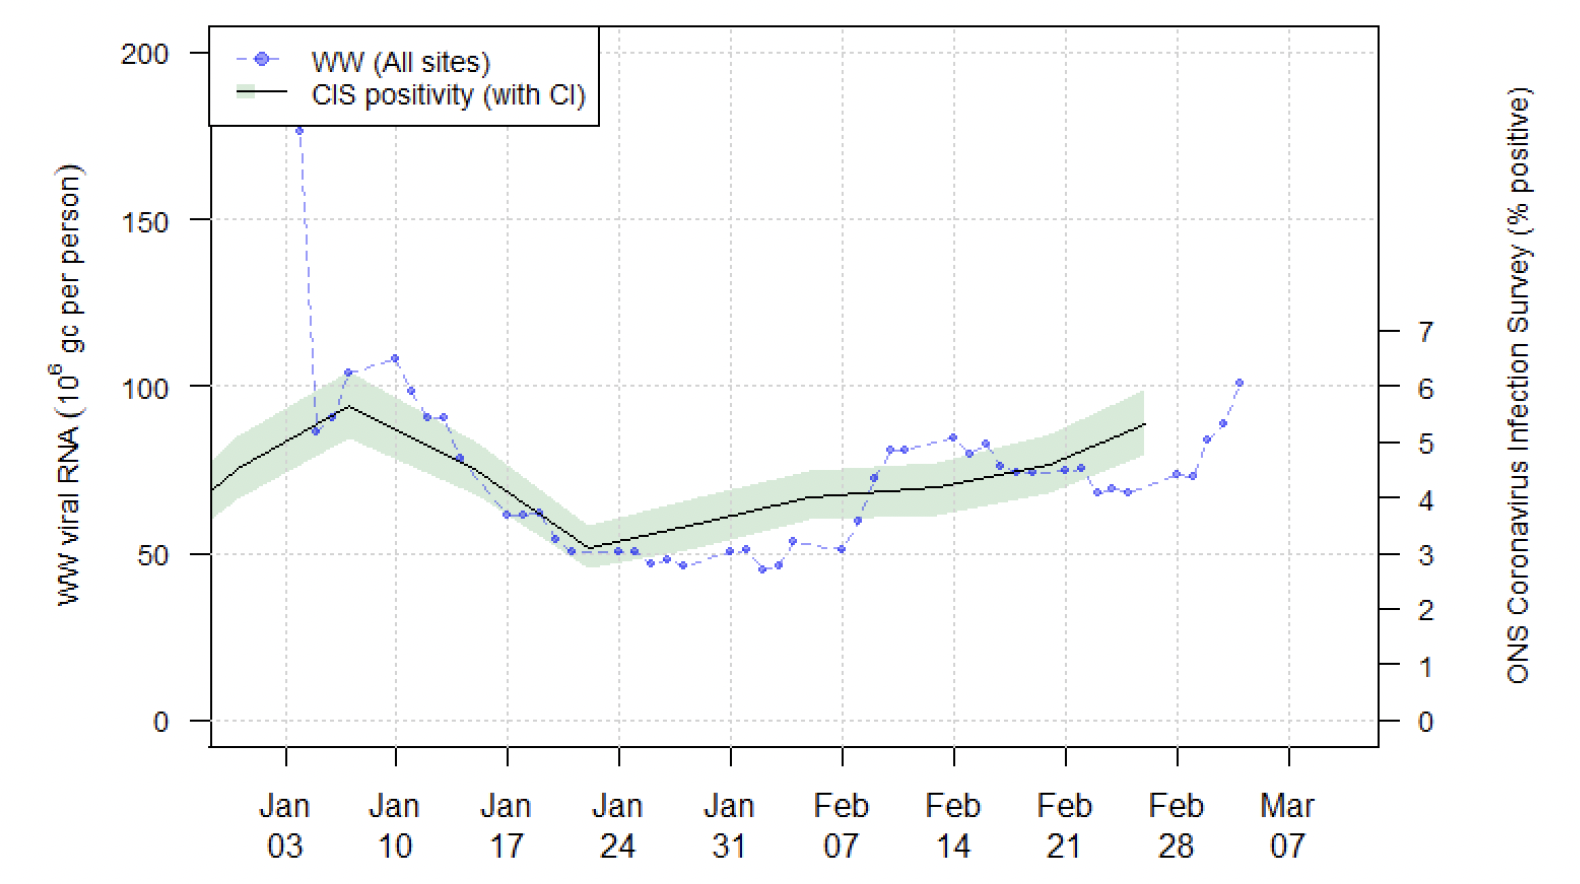
Nationwide, wastewater Covid-19 levels have shown an increase in the most recent week. The week ending on 4 March saw levels of just over 100 million gene copies per person per day (Mgc/p/d), up from 74 Mgc/p/d in the previous week ending 25 February. This is an increase of 35% (Figure 4)[14]. The increase in wastewater Covid-19 levels was seen in the majority of local authorities in Scotland, with only four local authorities seeing a decrease in the week to 4 March compared to the week ending 25 February. Please note that comparisons for Na h-Eileanan Siar and Orkney Islands are not possible due to missing data in the week to 25 February.
This represents a break in the flat or declining trend in wastewater viral Covid-19 levels seen in previous weeks, and means that while previously there was a concern that the trends in wastewater viral levels and positivity estimates from the Covid Infection Survey were showing trends in diverging directions, there now seems to be a better correspondence between the two. Case rates (including reinfections) by specimen date have also shown a sharp increase in the most recent week to 5 March.
Covid-19 Cases
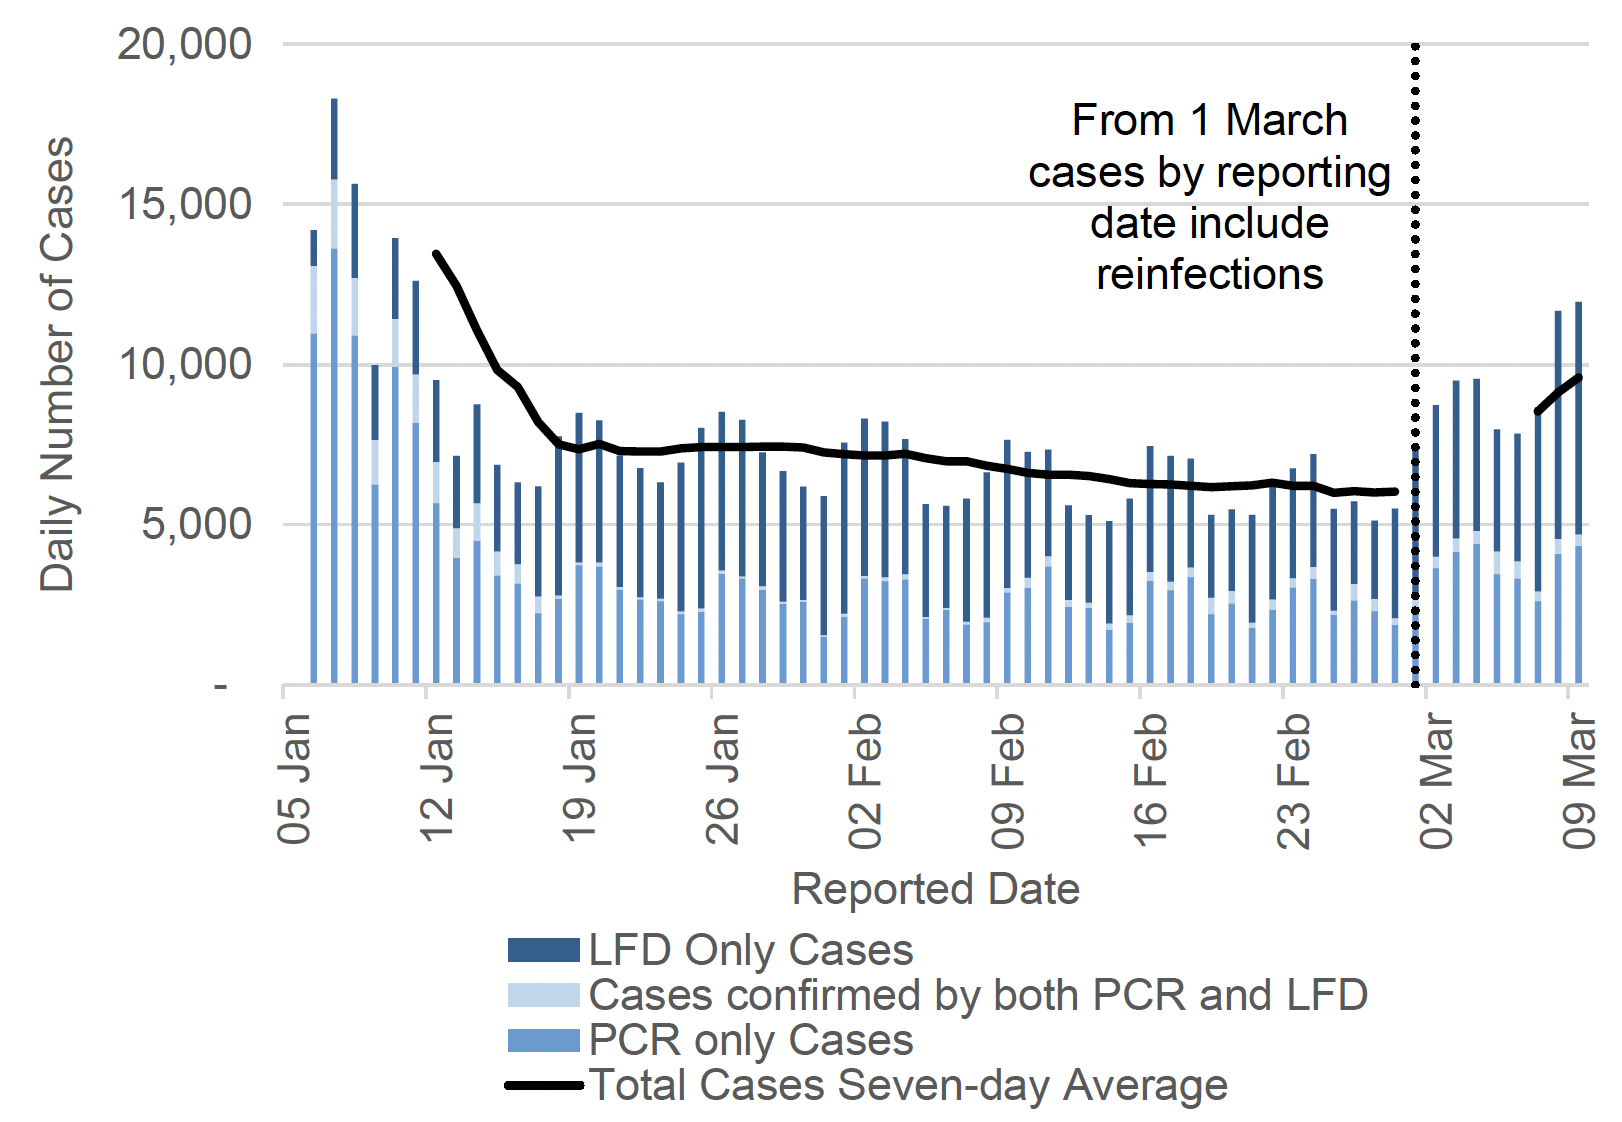
Please note that from 5 January, the Covid-19 case definition includes cases confirmed by either a PCR or LFD test, or both. Comparisons over time need to be made with caution. For more information on the difference between reporting and specimen date, please see this earlier publication.
From March 1, cases data includes reinfections (where a person has a positive test 90 days or more since their last positive test). For cases by specimen date, historical daily cases have been retrospectively updated to include reinfections, whereas for cases by reporting date reinfections were added to the total cumulative number on 1 March 2022 and will be included in daily reporting going forward. Reinfections have not been added retrospectively to data by reported date.
By reporting date[17], 9,596 cases (seven-day average including reinfections) were reported per day in the week leading up to 9 March. Due to the inclusion of reinfections in the reported daily cases from 1 March, this average cannot be compared to previous weeks. However, on 9 March, 11,957 daily cases were reported (including reinfections). This is an increase of 37% from the 8,725 cases reported on 2 March, and indicates an increasing trend of reported cases which can be seen among both PCR and LFD confirmed cases (Figure 5)[18].
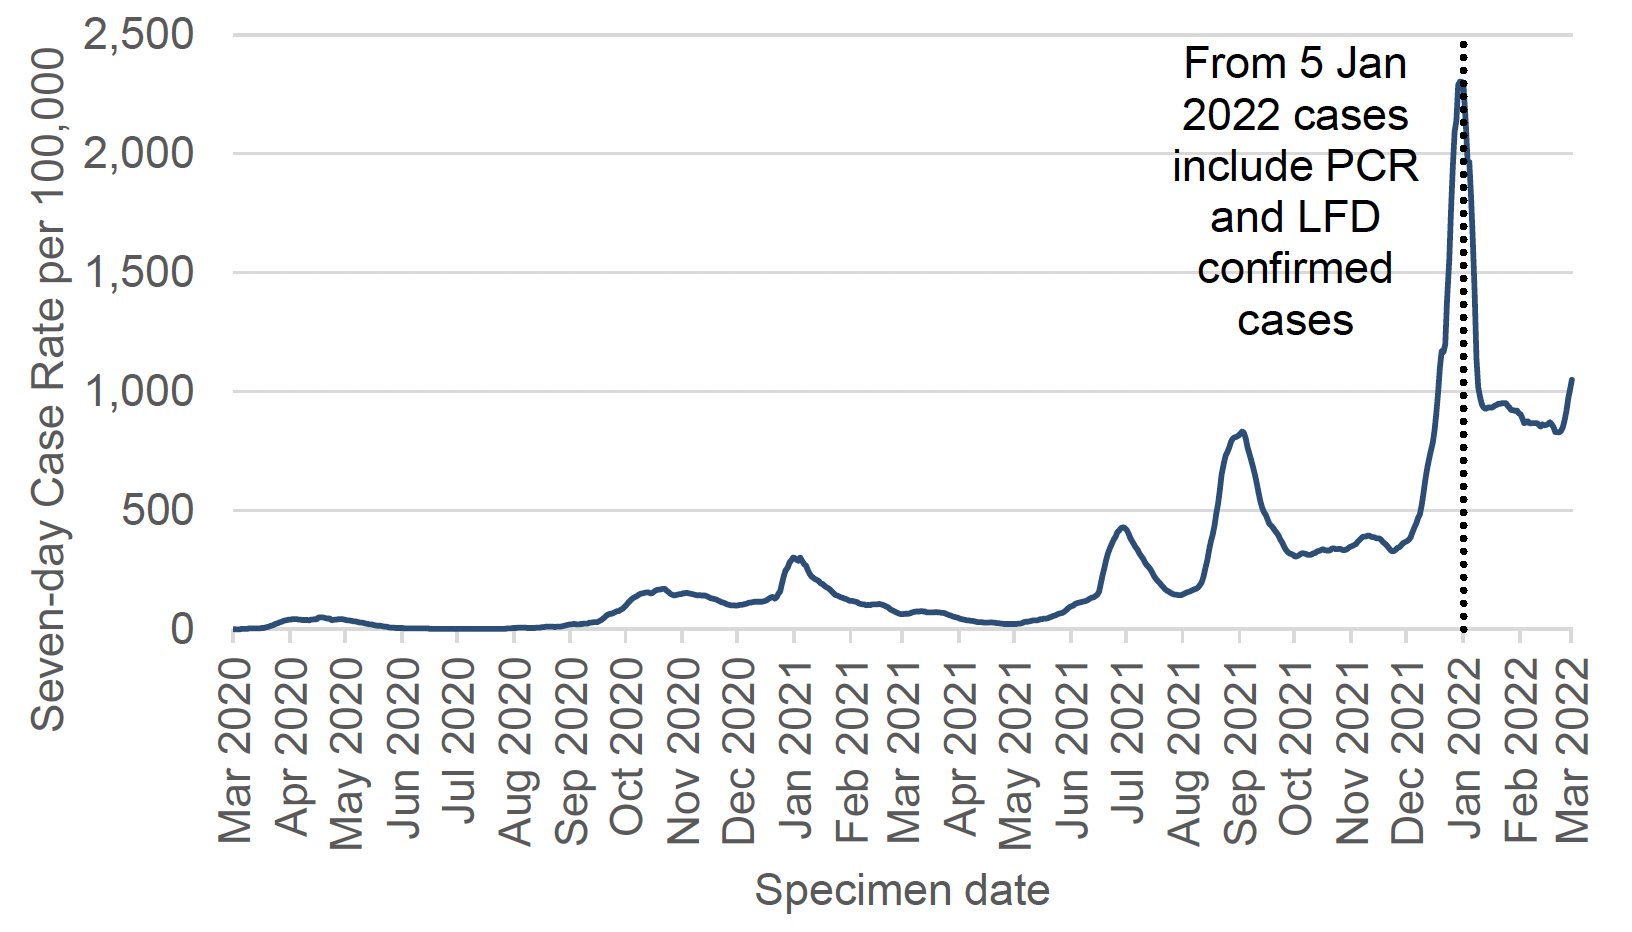
For comparisons over time it is more reliable to look at case rates by specimen date[20]. However, comparisons with data from before 5 January 2022 must be made with caution as differences are likely to reflect changes in testing behaviour and policy rather than changing infection levels alone.
By specimen date, the seven-day combined PCR and LFD case rate (including reinfections) increased sharply in Scotland in the most recent week. There were 1,049 weekly combined PCR and LFD cases per 100,000 population in the week to 5 March, which is a 27% increase from 827 weekly cases per 100,000 on 26 February. This follows a period of slightly decreasing case rates since mid-January and remains a very high case rate compared to previous phases of the pandemic in Scotland (Figure 6)[21].
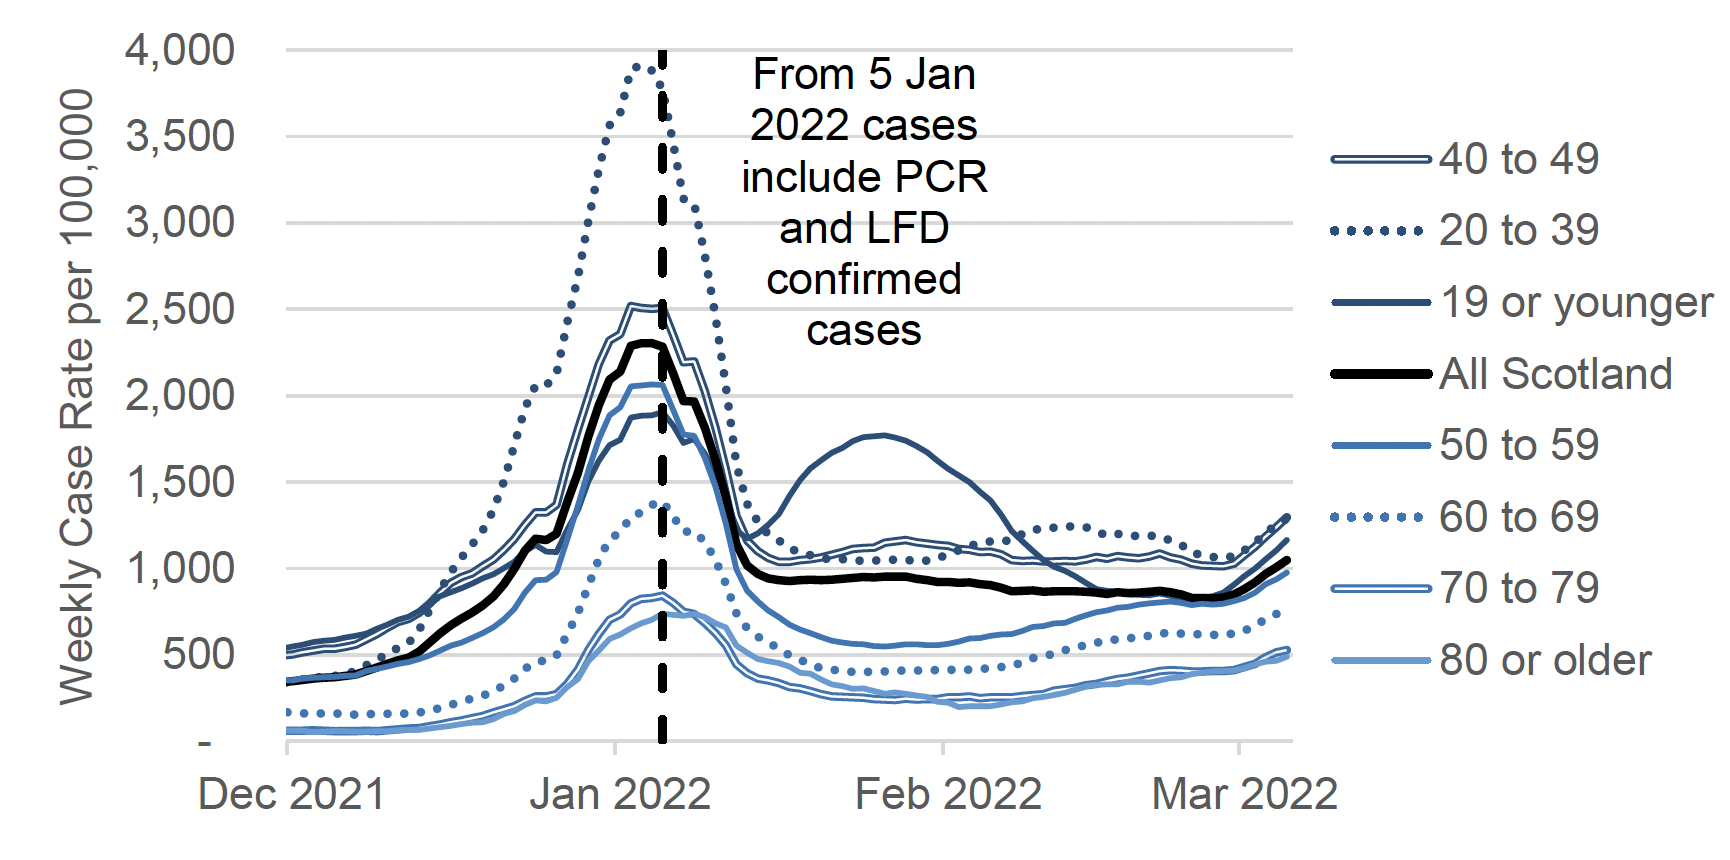
The week leading up to 5 March saw sharply increasing case rates (including reinfections) in all age groups (Figure 7). The combined case rate for those aged 19 or younger saw the biggest increase as the weekly case rate, as it increased by 39% from 838 cases per 100,000 in the week to 26 February to 1,164 in the week to 5 March. Within this age group, the increase ranged from 6% among those aged 16 to 17 to 60% among those aged 5 to 11, while those aged 18 to 19 was the only age band to continue to see a slight decrease in case rates. This follows a period of slightly decreasing or similar levels of Covid-19 among age groups younger than 60 since mid-February.
However, cases among those aged 60 or older have been increasing since early February. In the week to 5 March, this age group had a combined case rate of 632 cases per 100,000, which is a 26% increase from the week to 26 February (502 cases per 100,000), and an 97% increase from 5 February (321 cases per 100,000)[23]. In the most recent week, those aged 60 to 69 saw an increase in case rates of 25% compared to the previous week, those aged 70 to 79 saw an increase of 30%, and those aged 80 or older saw an increase of 21% (Figure 7)[24].
This is in line with the increasing numbers of weekly Covid-19 cases among care home residents throughout February 2022 and early March. In the week to 6 March there were 583 reported cases among care home residents, which is an increase of 16% from the week ending 27 February (503 weekly cases). The number of cases in the most recent week is lower than previous peaks of 833 weekly cases in the week to 9 January 2022 and 641 weekly cases in the week to 10 January 2021[27].
Due to different case definitions across the UK, comparisons between countries cannot be made at this time. Cases data from Scotland and Northern Ireland includes both PCR and LFD test results. Cases data from Wales includes PCR only results, and cases data from England includes PCR, LFD and LAMP (loop-mediated isothermal amplification) test results.
Additionally, from 31 January 2022, case reporting in England and Northern Ireland has changed to an episode-based definition which includes possible reinfections. From 1 March 2022, multiple infection episodes with a 90-day threshold are also included in cases for Scotland. Public Health Wales has reported cases by 42-day infection episodes throughout the pandemic. It intends to move to a 90-day episode length in the coming weeks. Reported case numbers can be found on the UK Government Dashboard.
Due to the different case definitions outlined above, we have not included case comparisons across the four UK nations using data from the UK Government dashboard in this edition of the report. When these definitions are more aligned we will resume reporting on these comparisons. To compare estimated infection levels in private residential households across the UK, please see the previous section on the Covid Infection Survey.
Reinfections
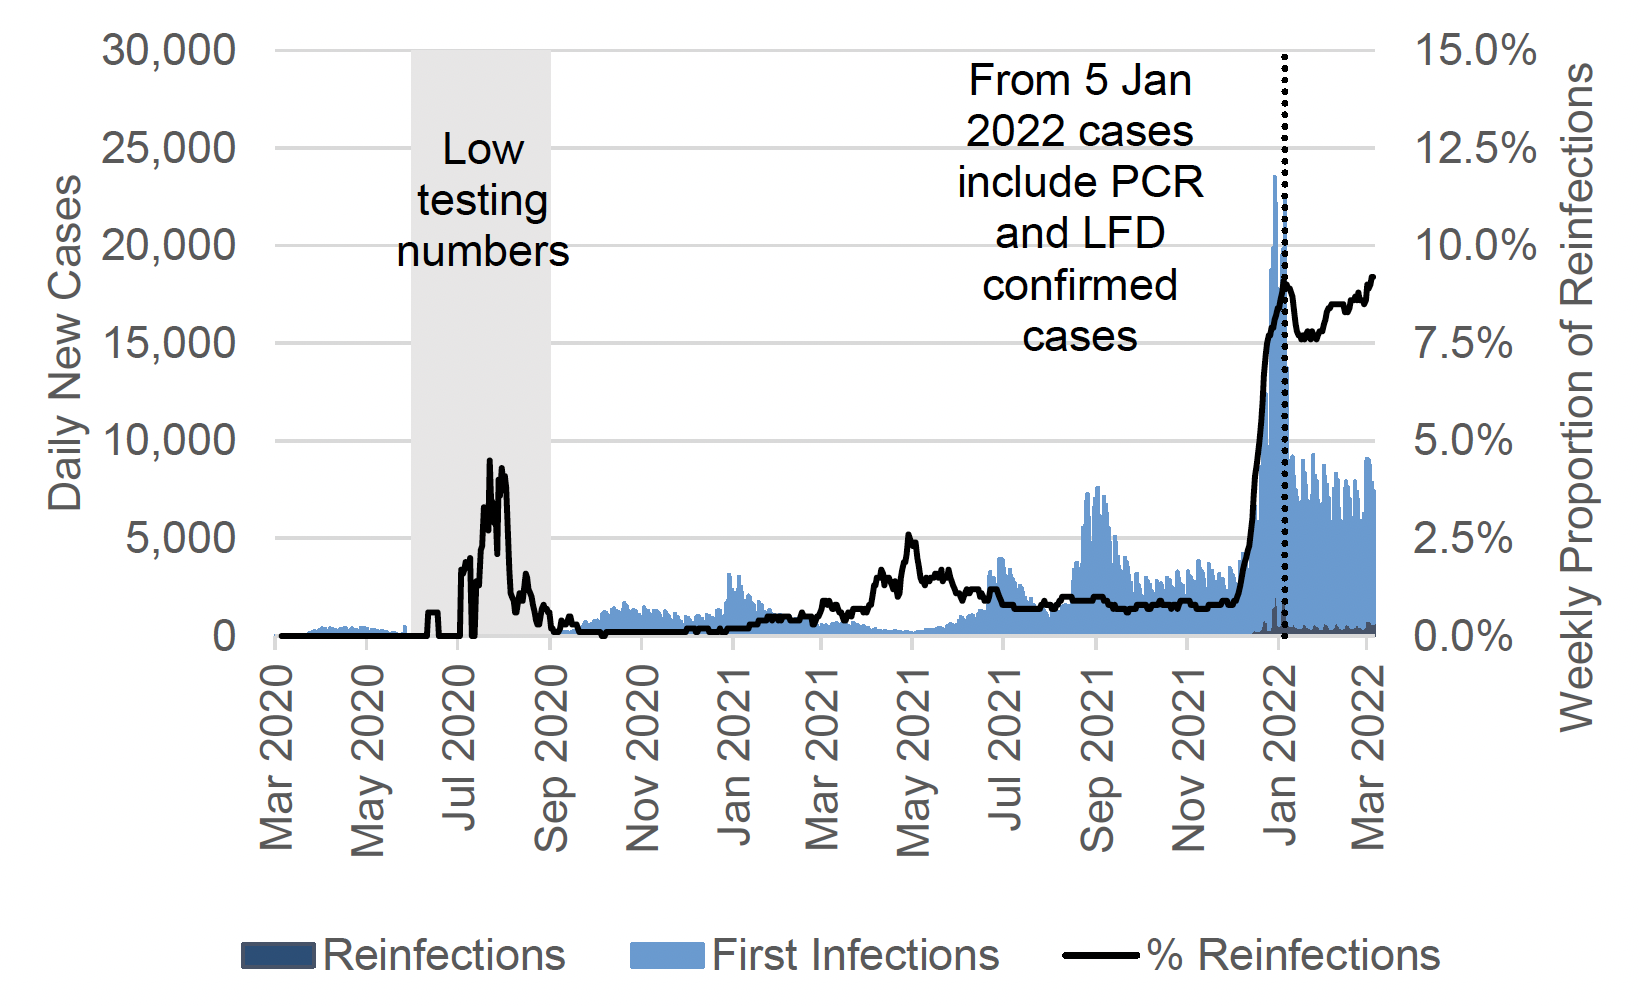
A reinfection is defined as a positive test 90 days or more after a previous positive test. This amount of time is set in order to be able to distinguish between viral persistence of the primary Covid-19 episode and a true reinfection.
The increase in the proportion of reinfections seen in late 2021 corresponds to the emergence of the now dominant Omicron BA.1 variant in the UK. The proportion of reinfections in Scotland when Omicron BA.1 was first detected on 29 November[28] was 0.8% percent of total cases. These are cases in individuals for whom it has been 90 or more days since their last positive Covid-19 test. The proportion of reinfections peaked on 4 January, at 9.1%, before decreasing slightly (Figure 8).
The proportion of reinfections among the total weekly cases has increased in the most recent week. By specimen date, there was a total number of 5,279 reinfection cases confirmed by either a PCR or LFD test in the week leading up to 5 March. This represents 9.2% of reported cases, which is an increase from 8.6% in the week leading up to 26 February, and is the highest level of reinfections seen in the pandemic.
LFD Testing
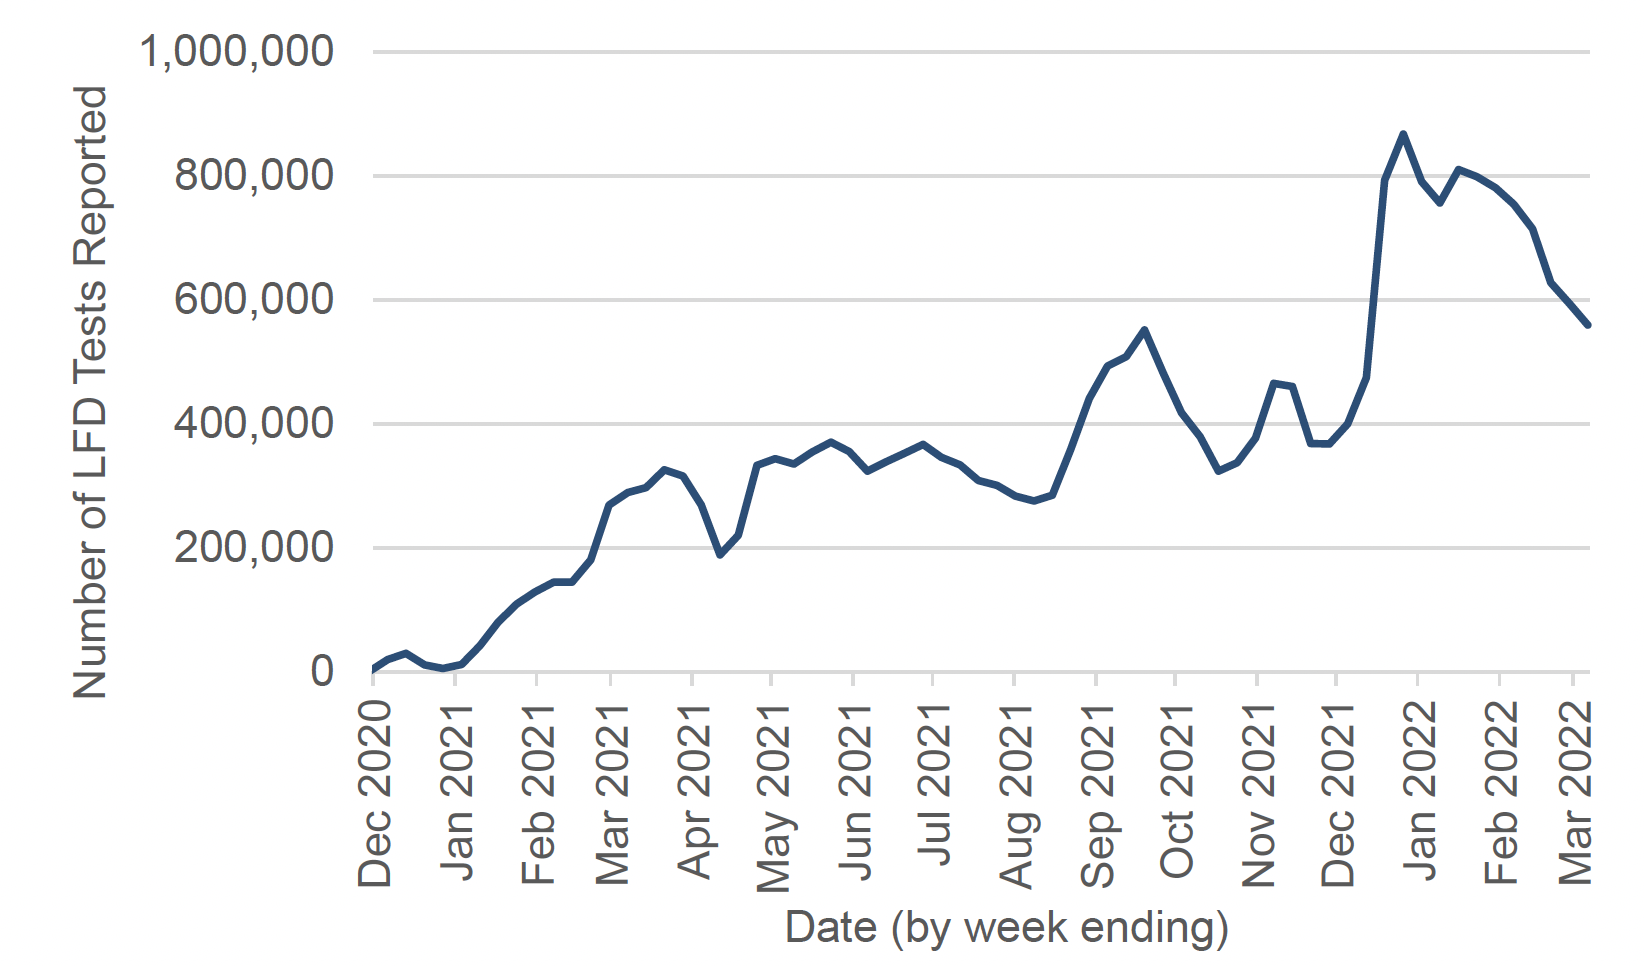
The weekly number of reported LFD tests peaked on 26 December 2021 with 867,417 reported tests, and has shown a decreasing trend since[30]. The weekly total of tests reported in the week to 6 March continued to decrease by 6% from the previous week leading up to 27 February. There were 559,127 reported tests in the week ending 6 March (Figure 9)[31].
YouGov survey results have shown that on 15 to 16 February, 52% of respondents had taken a LFD/antigen test and 9% a PCR test in the past week[32]. Of those who had taken a LFD/antigen test, 45% recorded the result of their last LFD/antigen test online and 50% did not record the results online[33].
The Scottish Contact Survey asks whether people use LFD tests and if so how often. Approximately 76% of individuals had taken at least one lateral flow test within the last 7 days for the survey pertaining to the 24 February - 2 March[34].
There are differences in the results from the YouGov and the Scottish Contact Survey (SCS) which may be likely to be due to differences in sampling and methodology. YouGov is an online survey based on an active sample which is representative of the Scottish population with around 1,000 respondents[35]. The SCS[36] is based on a longitudinal survey with a larger sample of around 3,000, with the responses being modelled to represent the Scottish population.