Coronavirus (COVID-19): state of the epidemic - 7 January 2022
This report brings together the different sources of evidence and data about the Covid epidemic to summarise the current situation, why we are at that place, and what is likely to happen next.
State of the Epidemic in Scotland – 7 January 2022
Background
This report summarises the current situation of the Covid-19 epidemic in Scotland. It brings together the different sources of evidence and data about the epidemic in Scotland at this point in time, why we are at that place, and what is likely to happen next. This summarises the data up to and including 6 January 2022 on Covid-19 in Scotland. This updates the previous publication published on 23 December[1]. The information in this document helps the Scottish Government, the health service and the wider public sector respond to the epidemic and put in place what is needed to keep us safe and treat people who have the virus.
This edition of the State of the Epidemic summarises current data on Covid-19 at a national and local level, and how Scotland currently compares to the rest of the UK. It looks at the vaccination program in Scotland and its impact. Information is provided about variants of concern and what impact these may have. Bringing this information together in one place gives the opportunity to better understand the current state of the epidemic in Scotland.
Public Health Scotland (PHS) are aware of larger volumes of tests being processed by laboratories. This and the holiday weekend appears to have impacted turnaround times resulting in delays between specimens being taken and results being received and reported. Public Health Scotland expect variability in reporting of Covid-19 testing data over the festive period due to availability of testing and people presenting for testing. Caution is advised when interpreting this data.
Cases and testing data continue to be reported in line with the existing definitions and sources. SG and PHS analytical teams are reviewing the recent testing policy changes announced on 5 January 2022 and any changes will be incorporated in future reports[2].
Key Points
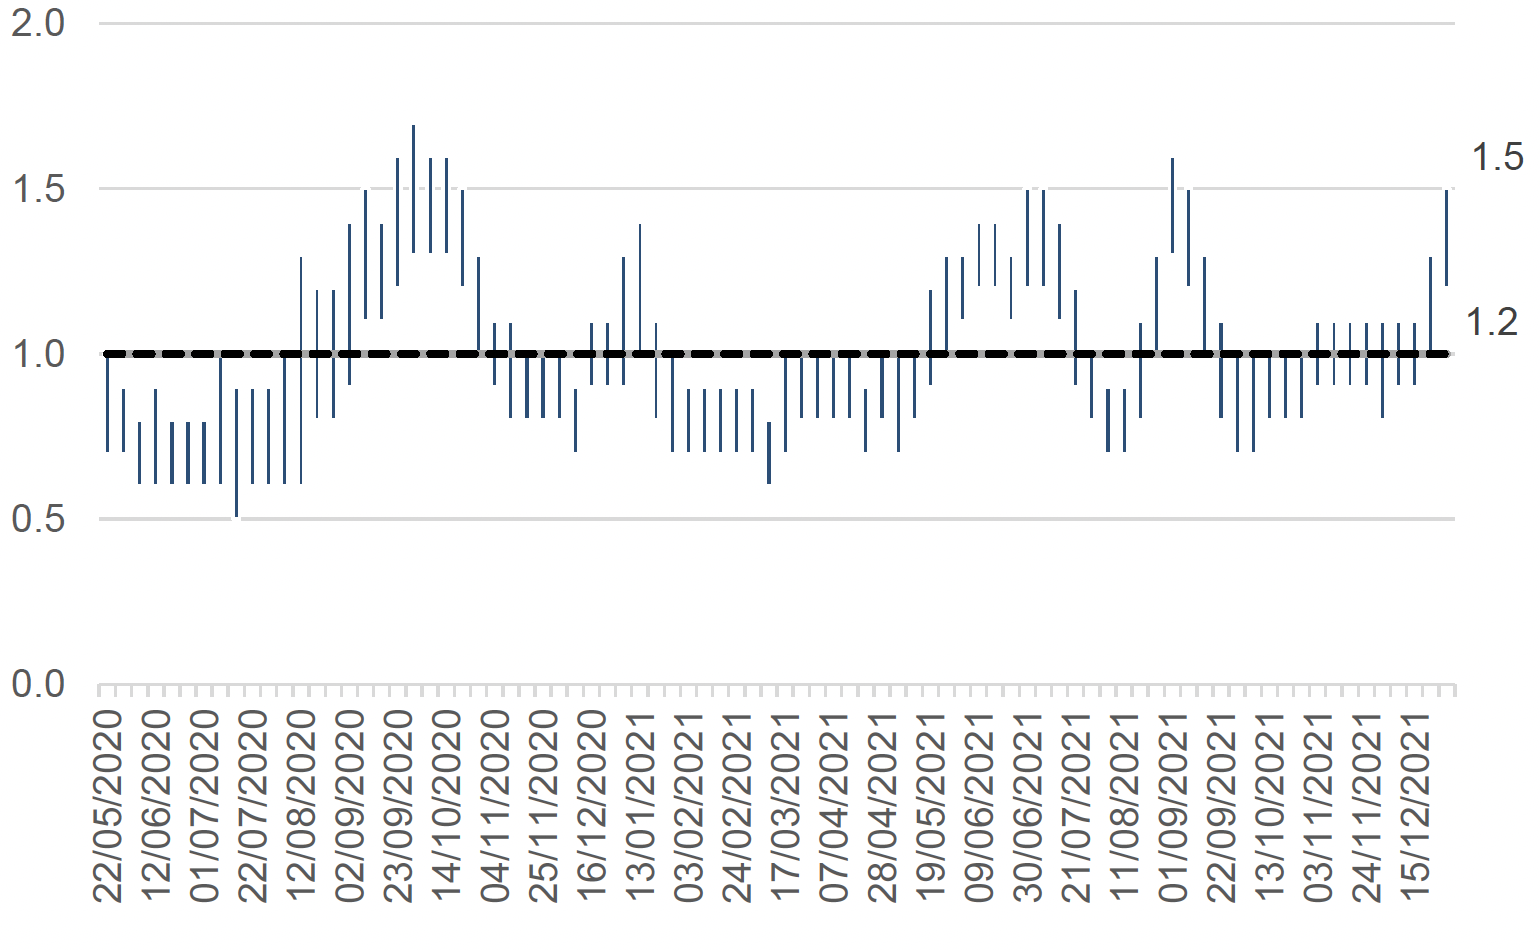
- The latest R value for Scotland, as of 21 December 2021 (using data to 4 January 2022), was between 1.2 and 1.5, with a growth rate of between 4% and 9%. The lower and upper limits have increased since the last publication for both R value and growth rate.
- Latest modelled estimates suggest that, as at 21 December, the incidence of new daily infections in Scotland was between 237 and 507 new infections per 100,000. These figures are based on data to 4 January 2022.
- Nationwide, wastewater Covid-19 RNA levels have shown a large increase during the Christmas period, increasing by approximately 71% since the week ending 21 December. The week ending on 4 January saw levels in excess of 220 million gene copies per person per day (Mgc/p/d), up from around 130 Mgc/p/d in the week ending on 21 December.
- As determined through the latest weekly ONS infection survey, the percentage of people testing positive for Covid-19 in the private residential population in Scotland has continued to increase in the most recent week (25 to 31 December 2021), equating to around 1 in 20 people.
- An average of 15,435 cases were reported per day in the 7 days to 6 January 2022. This is a 37% increase from the daily average of 11,284 recorded on 30 December 2021.
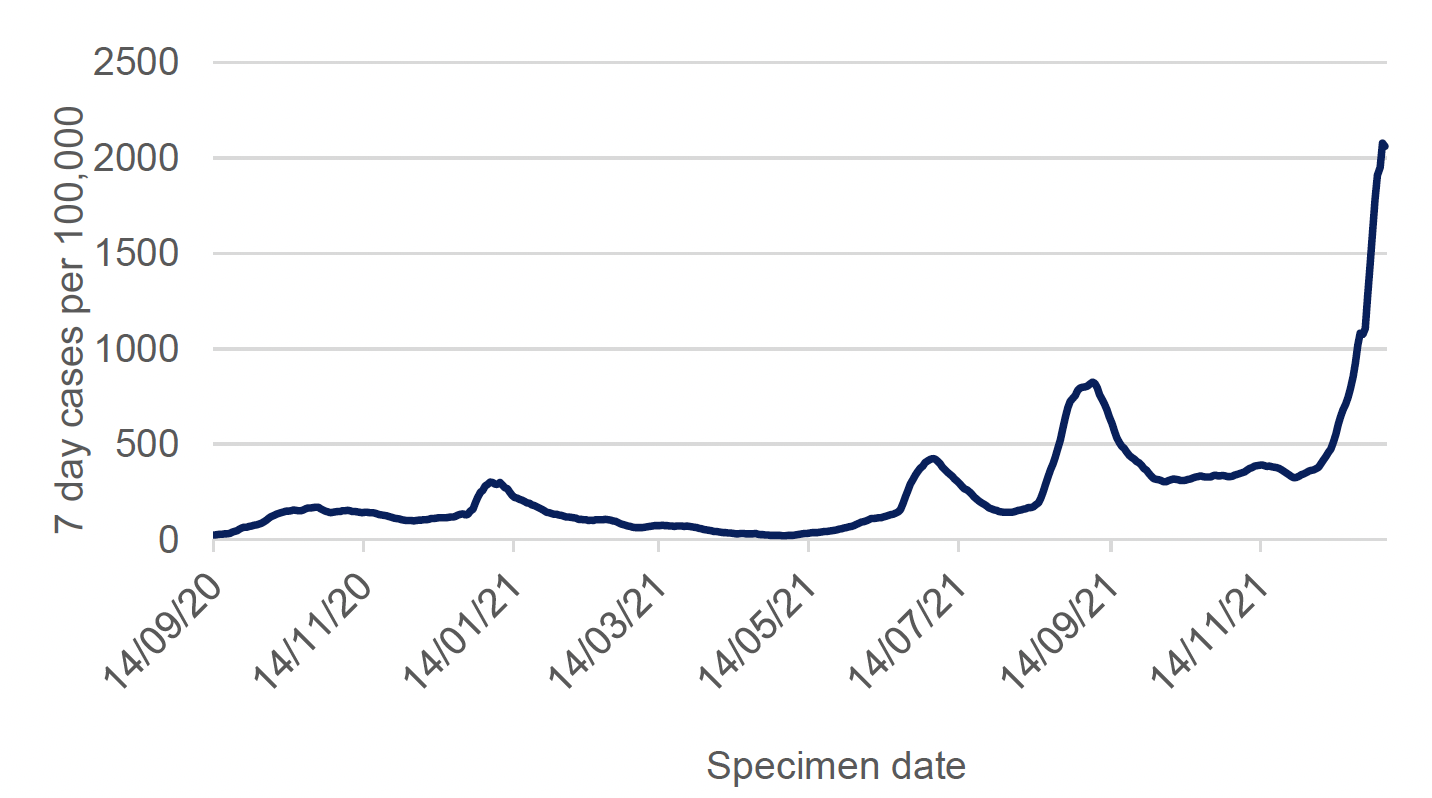
- In the last week, 7 day case rates in Scotland have consistently and rapidly increased. There were 2,062 weekly cases per 100,000 population in the week to 3 January 2022, which is a 62% increase from 1,274 weekly cases per 100,000 on 27 December 2021. This is higher than the most recent peak (825 weekly cases per 100,000 on 6 September 2021) and the peak in July (425 weekly cases per 100,000 recorded on 3 July 2021).
- As of 3 January 2022, the highest case rates (by specimen date) were observed amongst those aged 20-39, followed by 40-59, under 20, 60-79 and 80+. In the week to 3 January 2022, case rates have increased in all age groups.
- 91.1% of all PCR tests from Pillar 2 Lighthouse Labs had the S-gene target failure, as reported on 5 January 2022. S-gene target failure is used as a proxy for Omicron cases.
- A total of 21,832 confirmed cases of Omicron variant (B.1.1.529), as determined through whole genome sequencing, have been reported as of 5 January 2022.
- Following a sharp increase in Lateral Flow Device (LFD) tests throughout December 2021, there was an 8.9% decrease in LFD tests that were reported in Scotland from 26 December 2021 to 2 January 2022. By 6 January 2022 PCR tests per 1,000 people increased to 79.
- In the week to 22 December Covid-19 hospital occupancy and Covid-19 ICU occupancy (short and long stay) increased by 56% and 16% overall from this time last week.
- Average hospital admissions (3-week rolling average) related to Covid-19 in children and young adults have increased overall in the week leading up to 29 December 2021 compared to the previous three-week period. Average hospital admissions have almost doubled in those aged 0-1 and 20-21 in the same time period.
- There were 44 deaths registered where Covid-19 was mentioned on the death certificate in the week to 2 January 2022. This is a decrease of 9 (-17%) in the number of deaths from the previous week.
- Inverclyde currently has the highest weekly case rate in Scotland reporting 2,726 weekly cases per 100,000 in the week to 3 January 2022. Shetland has the lowest case rate in Scotland, reporting 708 weekly cases per 100,000 population.
- Infections, hospitalisations and hospital occupancy have been increasing and are expected to continue to rise as Omicron continues to spread.
Method
This report brings together a wide range of publically available figures from a range of data sources. These include publications by Scottish Government, Public Heath Scotland, National Records of Scotland and Office for National Statistics along with scientific publications and SAGE and UKHSA summaries where appropriate to summarise the state of the epidemic in Scotland in a given week. We also provide information on public attitudes to the virus from weekly YouGov polling surveys.
Summary
Estimated Infection Levels
The latest R value for Scotland as of 21 December was between 1.2 and 1.5 (Figure 1), with a growth rate of between 4% and 9%. R is an indicator that lags by two to three weeks and therefore should not be expected to fully reflect the increased prevalence of Omicron in the recent weeks. These figures are based on data to 4 January 2022[3]. The lower and upper limits have increased since the past publication for both R value and growth rate.
Latest modelled estimates suggest that, as at 21 December, based on data to 4 January, the incidence of new daily infections in Scotland was between 237 and 507 new infections per 100,000[4]. This equates to between 13,000 and 27,700 people becoming infected each day in Scotland.
Covid-19 Cases in Scotland
An average of 15,435 cases were reported per day in the 7 days to 6 January 2022. This is a 37% increase from the daily average of 11,284 recorded on 30 December 2021[5]. A total of 21,832 cases of confirmed Omicron variant (B.1.1.529) which had been reported as of 5 January 2022[6], including 8,183 in the latest 24 hours.
In the last week, 7 day case rates (by specimen date) have consistently and rapidly increased in Scotland. There were 2,062 weekly cases per 100,000 population in the week to 3 January 2022, which is a 62% increase from 1,274 weekly cases per 100,000 on 27 December 2021[7]. This is higher than the most recent peak of 825 weekly cases per 100,000 on 6 September and the previous peak of 425 weekly cases recorded on 3 July (Figure 2).
In the week to 31 December 2021, there were 3,333 cases (PCR testing only) per 100,000 among individuals with one or two doses of a Covid-19 vaccine, compared to 1,243 cases per 100,000 for those that had a booster or 3rd dose of a Covid-19 vaccine[8].
As of 3 January 2022, the highest case rates (by specimen date) were observed amongst those aged 20-39, followed by 40-59, under 20, 60-79 and 80+. In the week to 3 January 2022, case rates increased in all age groups (Figure 3). Case rates among those aged over 60 more than doubled in the week to 3 January.
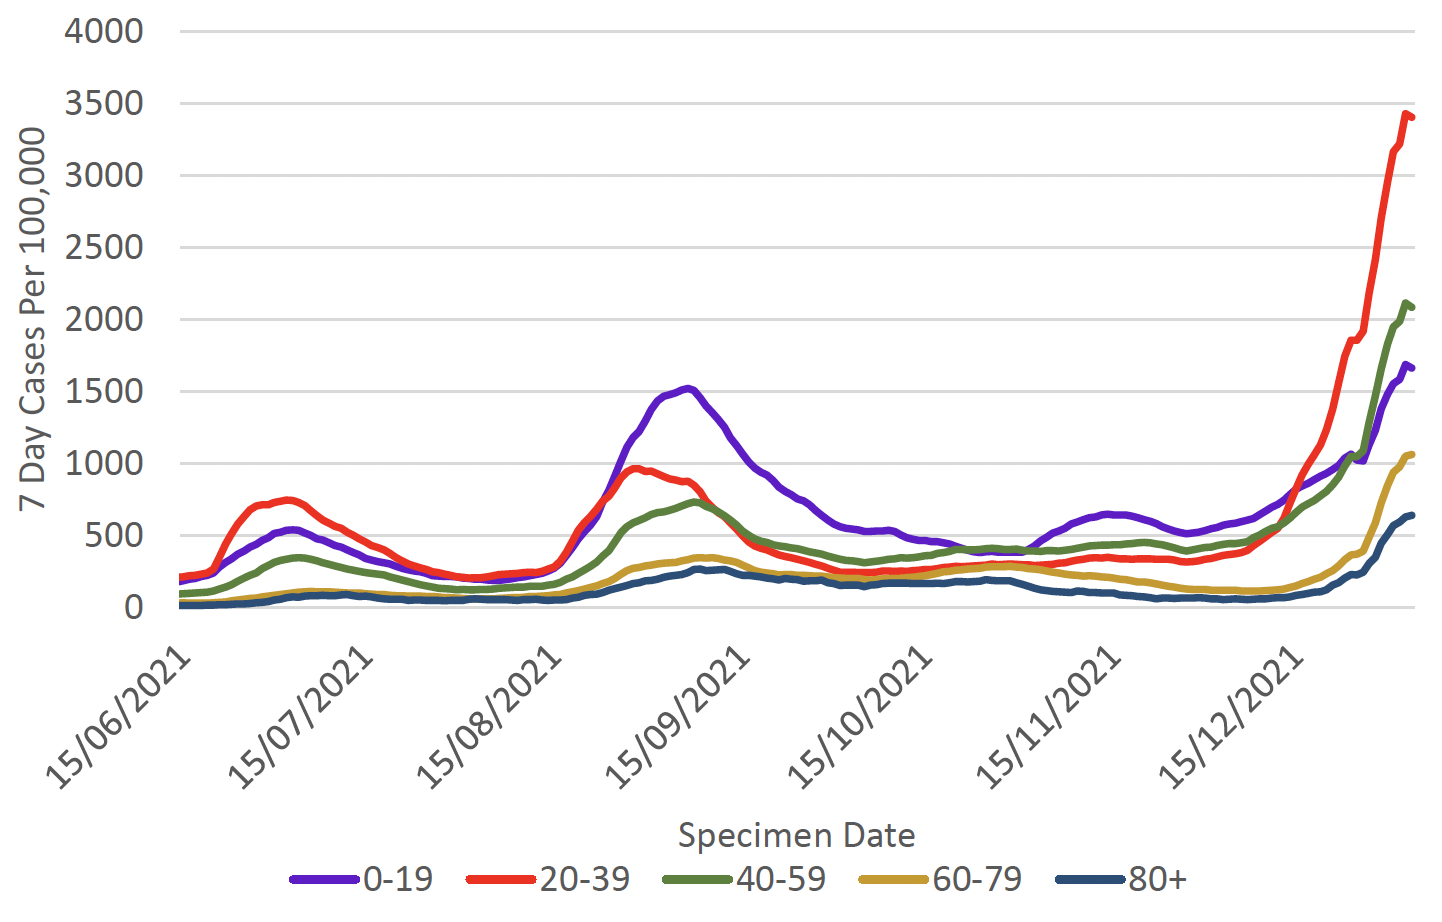
Case rates also increased for all age groups under 22 in the week to 3 January 2022. The largest increase in case rates in these age groups occurred among those aged 0-1, with the case rate more than doubling in a week. Those aged 16-17, 18-19 and 20-21 had a higher 7 day case rate than the Scotland average in the week to 3 January 2022[10].
Wastewater Estimates
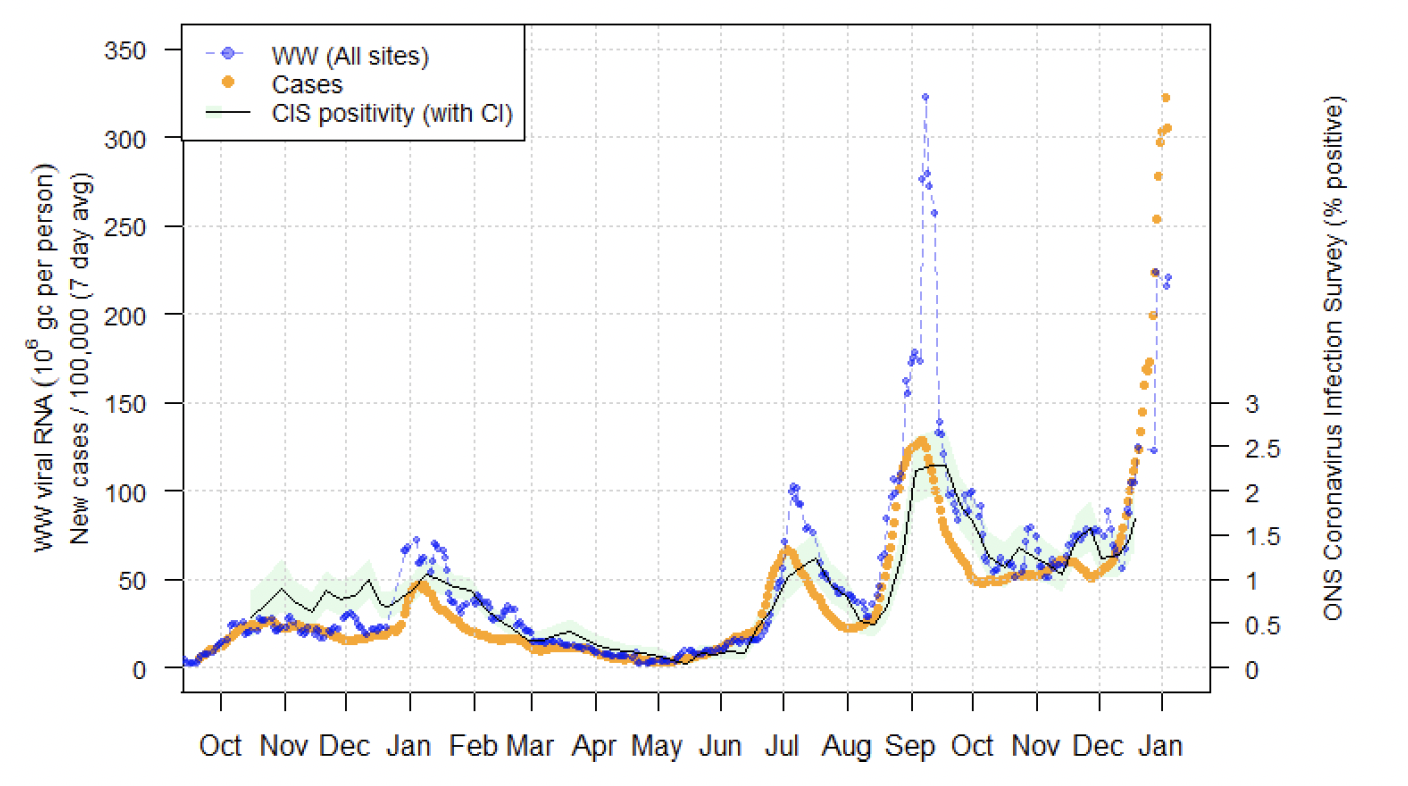
Nationwide, wastewater Covid-19 RNA levels have shown a large increase during the Christmas period, increasing by approximately 71% since the week ending 21 December.
The week ending on 4 January saw levels in excess of 220 million gene copies per person per day (Mgc/p/d), up from around 130 Mgc/p/d in the week ending on 21 December, and 67 Mgc/p/d in the previous reported week ending 14 December, an increase of 71%. The trend confirms the recent steep rise in cases caused by the rapid spread of Omicron variant, although these results arise from a reduced sampling scheme over the festive period (Figure 4).
Covid Infection Survey
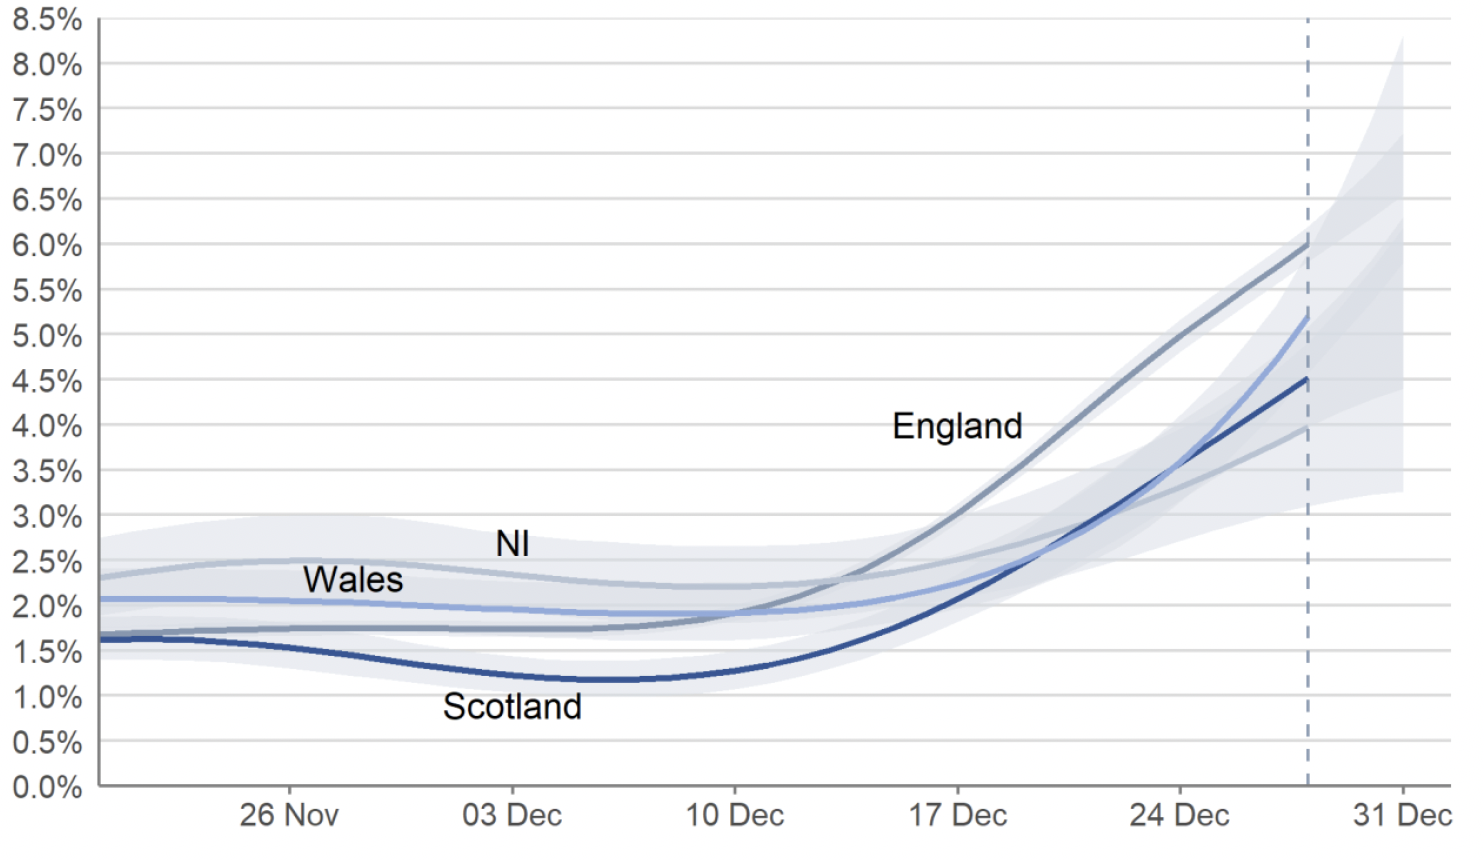
The percentage of people testing positive for Covid-19 in the private residential population continued to increase in the most recent week. The ONS Covid-19 Infection Survey estimates that in the week 25 to 31 December 2021, the estimated percentage of the population living in private residential households testing positive for Covid-19 in Scotland was 4.52% (95% credible interval: 3.98% to 5.09%), equating to around 1 in 20 people. This is higher than the latest peak of 2.29% recorded in the week to 11 September 2021, and higher than the previous peak of 1.24% recorded in the week to 17 July 2021. In the week 25 to 31 December 2021, estimates for the other nations of the UK are as follows and can be seen in Figure 5:
- In England, the trend in the percentage of people testing positive in private residential households has continued to increase in the most recent week: 6.00% (95% credible interval: 5.80% to 6.19%), equating to around 1 in 15 people.
- In Wales, the trend in the percentage of people testing positive in private residential households has continued to increase in the most recent week: 5.20% (95% credible interval: 4.57% to 5.91%), equating to around 1 in 20 people.
- In Northern Ireland, the trend in the percentage of people testing positive in private residential households has continued to increase in the most recent week: 3.97% (95% credible interval: 3.10% to 4.91%), equating to around 1 in 25 people[11].
In Scotland, the percentage of people testing positive for Covid-19 increased for primary school aged children in recent weeks, and increased in all other ages in the most recent week[12].
Testing Rates and Positivity
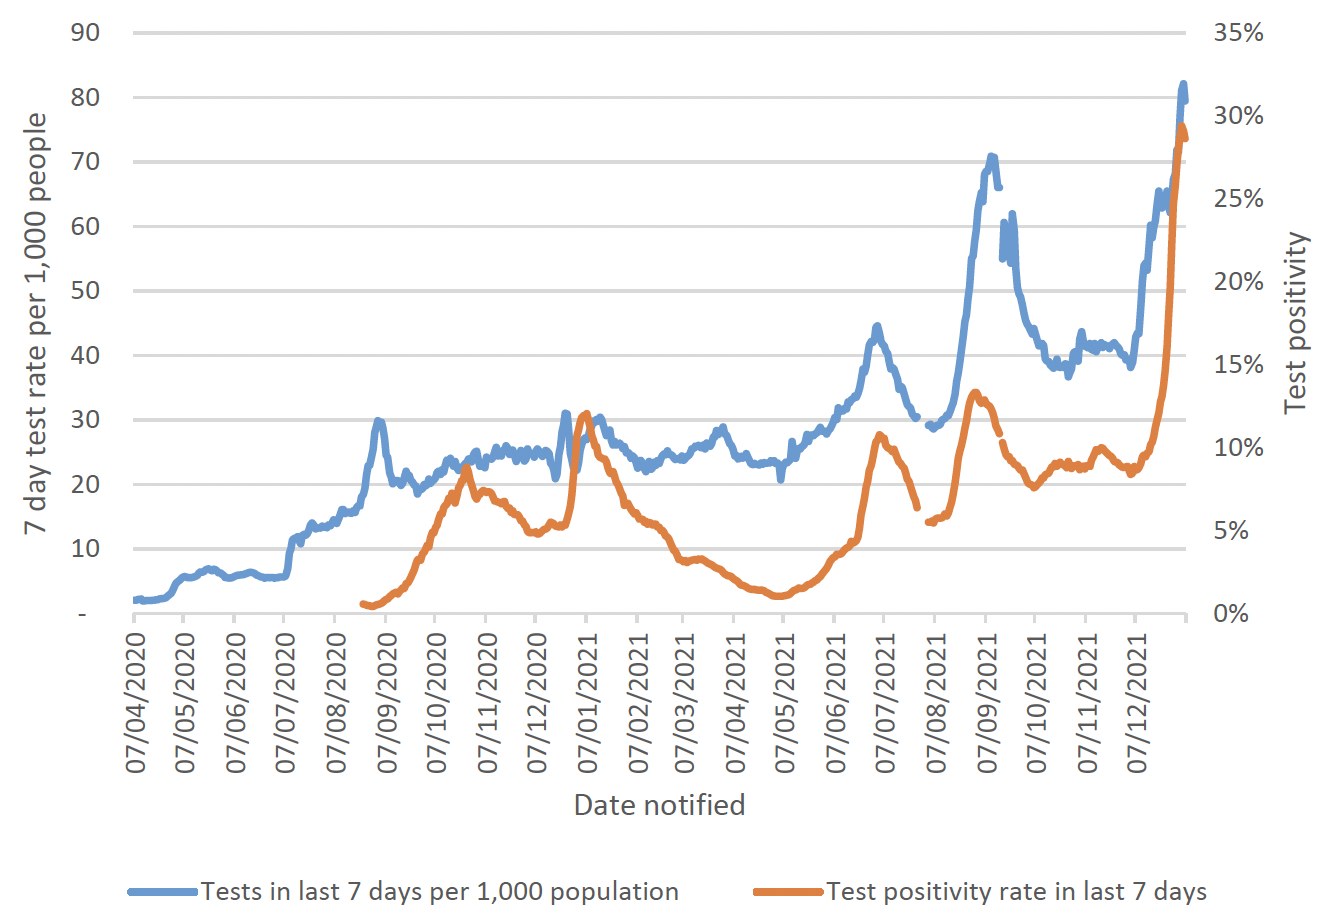
PCR tests per 1,000 population (seven day total) remained relatively stable throughout November with a slight decrease towards the end of the month. By 6 January 2022 PCR tests per 1,000 people increased to 79. Test positivity rate in the last seven days (proportion of positive tests) has increased, and as of 6 January 2022 it was at 29% (Figure 6)[13].
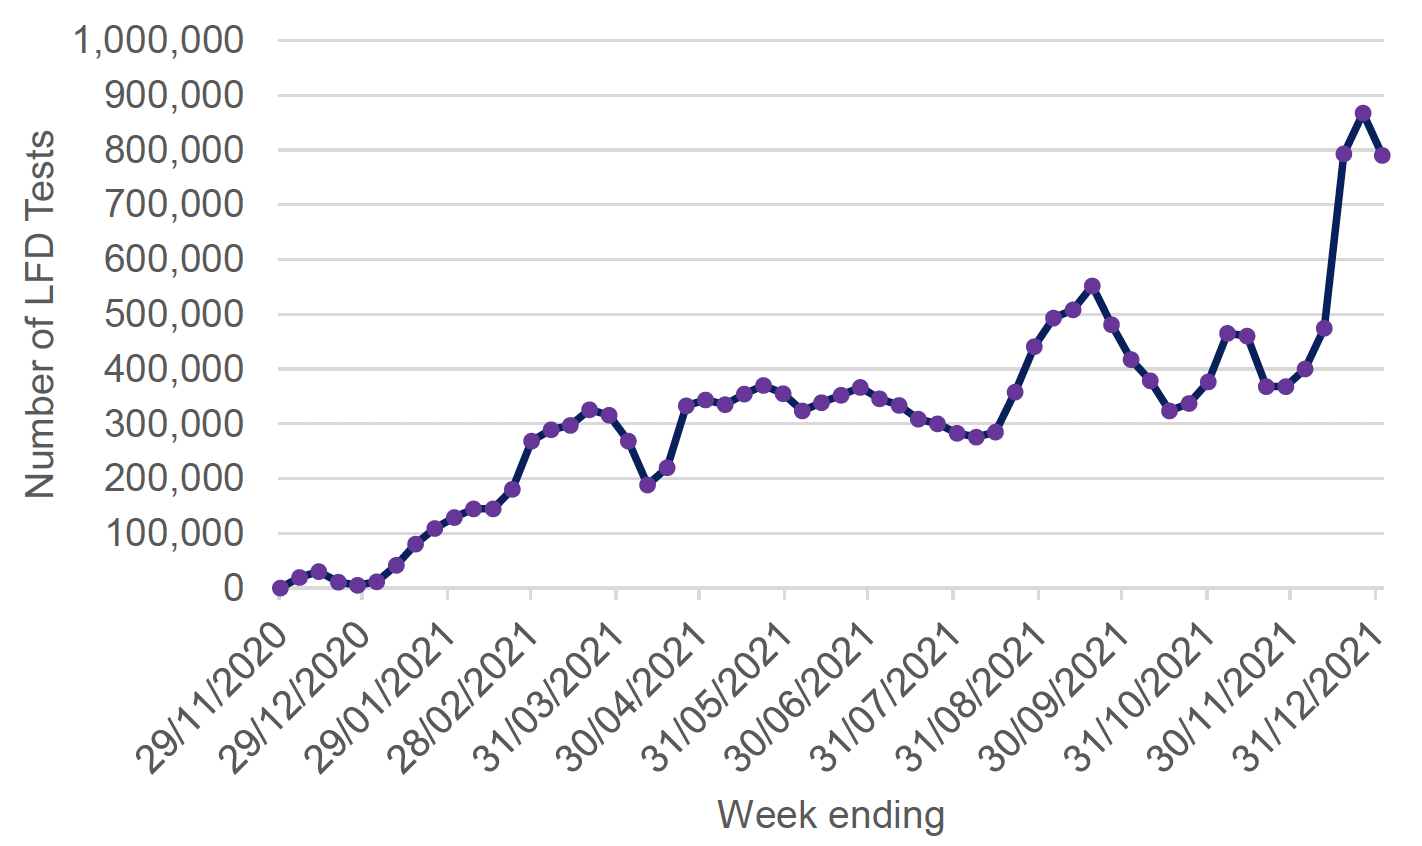
Following a sharp increase in Lateral Flow Device (LFD) tests throughout December 2021, there was an 8.9% decrease in LFD tests that were reported in Scotland from 26 December 2021 to 2 January 2022 (Figure 7)[15].
Scottish Contact Survey now asks whether people use Lateral Flow Device tests and if so how often. Approximately 85% of individuals have taken at least one lateral flow test within the last 7 days for the survey pertaining to the 23-29 December, with 47% of individuals taking at least three[16].
The youngest and oldest age groups (18-29 and 70+) have reported the lowest proportions of individuals who have taken one or more lateral flow tests, 64% and 56% respectively. In contrast, those aged between 30-69 report the highest proportion of individuals taking at least one lateral flow test within the last 7 days, with at least 73% taken at least one[17].
Omicron variant
Omicron, designated as a variant of concern by the WHO on 26 November 2021, is the dominant strain of the virus within Scotland with widespread community transmission. As determined by the ONS Covid-19 Infection Survey, in Scotland, the estimated percentage of the population living in private residential households testing positive for Omicron variant compatible cases of Covid-19 has continued to increase rapidly in the most recent week (25 to 31 December 2021). The percentage of people testing positive for Delta variant compatible cases has continued to decrease in the most recent week[18] [19].
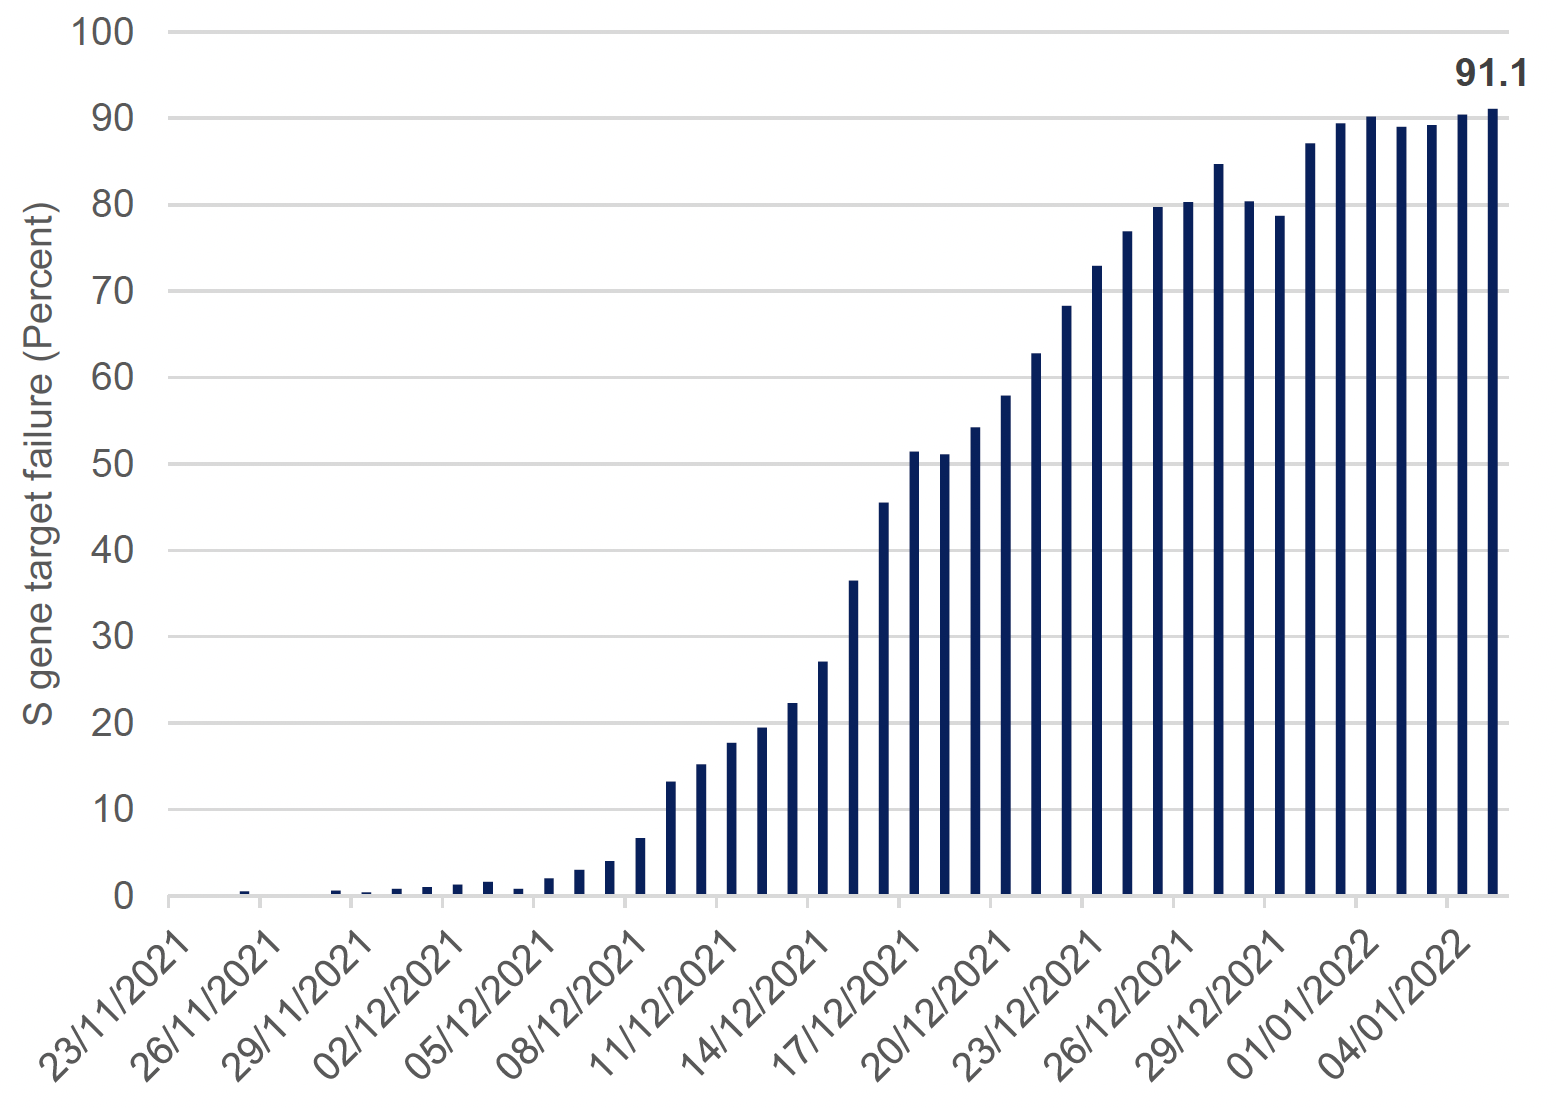
S-gene target failure (combined with positive detection of the other two target genes (ORF1AB and N)) has been identified as a reasonable proxy for Omicron variant (B.1.1.529) in the UK. As of 5 January 2022, S-gene target failure (SGTF) cases were at 91.1% of all PCR tests from Pillar 2 Lighthouse Labs, and have risen exponentially (Figure 8)[20]. For more information on the emergence of the Omicron variant, see earlier publications.
The latest Omicron risk assessment carried out by the UK Health Security Agency (UKHSA), established with high confidence from analysis of UK data that Omicron is showing increased household
transmission risk, increased secondary attack rates and substantially increased growth rates compared to Delta, the previously dominant variant. There is also high confidence that Omicron displays a reduction in immune protection against infection. Omicron infections have a reduced risk of hospitalisation (low confidence)[22].
Scientific evidence indicates that Omicron has some ability to evade natural immunity from prior infection. Multiple laboratory trials report the potential for reduced vaccine efficacy with Omicron compared to previous variants. In addition analysis of real world vaccine effectiveness data in the UK[23] [24] and South Africa highlights reduced protection against infection and an increase in the risk of reinfection with Omicron. However, vaccine effectiveness against hospitalisation is high, currently estimated at 88% (78 to 93%) for Omicron after 3 doses of vaccine[25].
There is evidence that there is reduced overall risk of hospitalisation for Omicron compared to Delta[26] [27], with the most recent estimate of the risk of presentation to emergency care or hospital admission with Omicron was approximately half of that for Delta[28].
Hospital and ICU Occupancy and Admissions
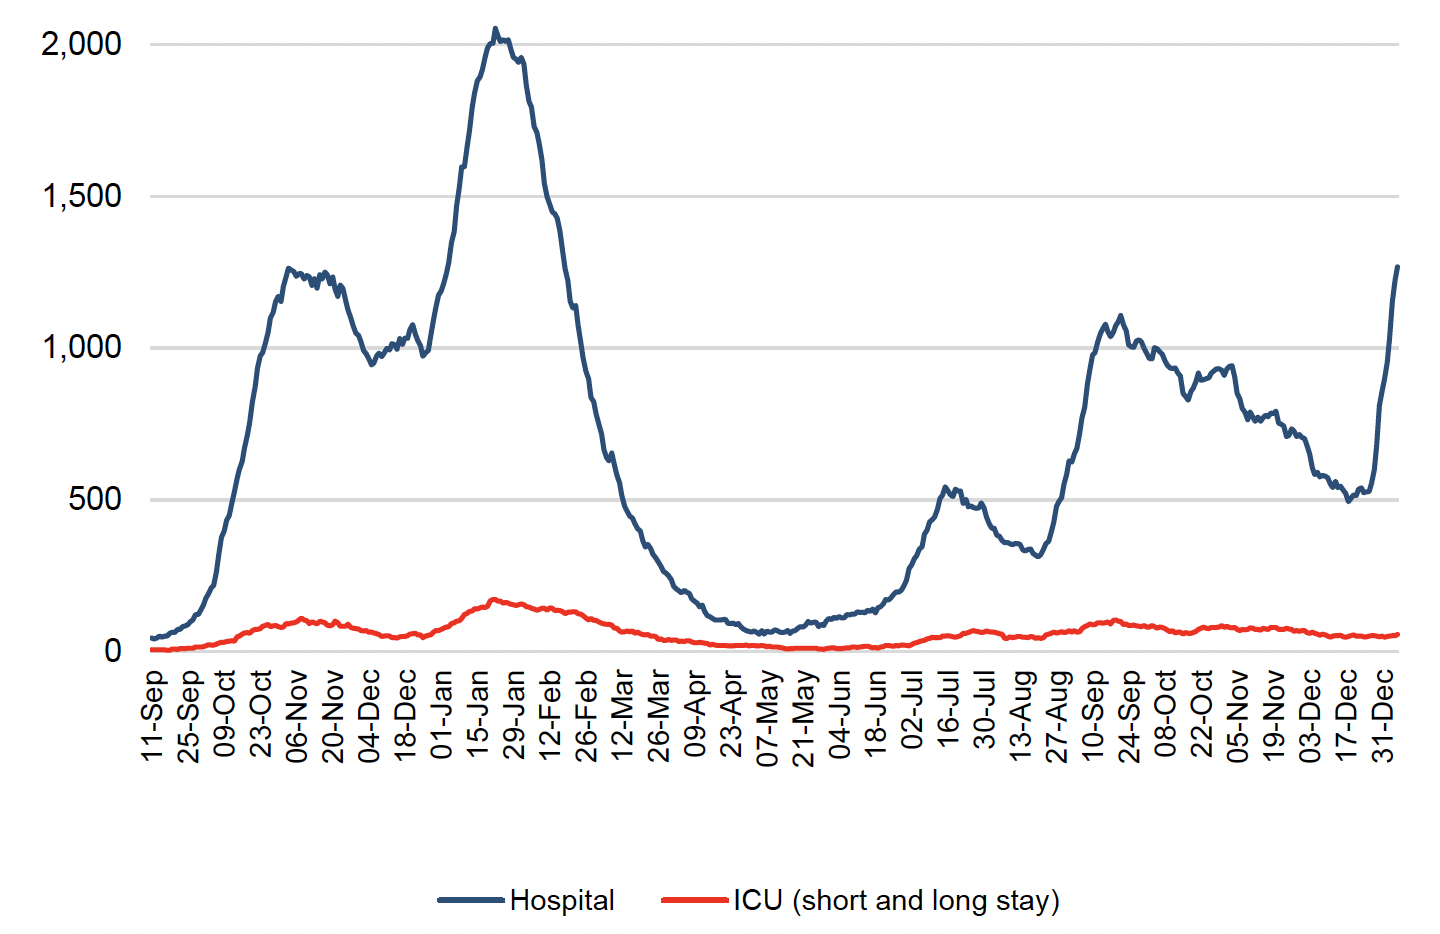
NHS boards reported 1,267 patients in hospital on 6 January 2022 with recently confirmed Covid-19, compared to 1,223 on 5 January and 811 a week ago (30 December 2021). This is an increase of 456 patients (+56%) from last week, and compares with 2,053 patients in hospital at the peak in January 2021 (Figure 9). ICU occupancy (including long stay) has increased to 57 on 6 January, an increase of 16% since last week but lower than the peak of 172 recorded in January 2021[29].
The latest data from PHS shows that admissions to hospitals have increased in the last week, with 904 admissions to hospital for people with confirmed Covid-19 in the week to 2 January 2022 compared to 584 in the week to 26 December 2021[30]. Average hospital admissions (3-week rolling average) related to Covid-19 in children and young adults have increased overall in the week leading up to 29 December 2021 compared to the previous three-week period. Average hospital admissions have almost doubled in those aged 0-1 and 20-21 in the same time period[31] [32].
As the population is increasingly vaccinated, more of the patients in hospital will be fully or partially vaccinated. Therefore, it is important that we can differentiate between patients in hospital because of Covid-19 rather than with Covid-19. Public Health Scotland estimates that as at August 2021, 68% of Covid-19 related acute hospital admissions had a primary diagnosis of Covid-19. In March 2021 this figure stood at 75%, and then decreased to a low of 66% in April 2021. This increased to 75% in July, but saw a decrease in August[34].
A clinical audit of case notes shows that as of 2 January 2022 in NHS Greater Glasgow and Clyde and as of 4 January 2022 in NHS Grampian, 60% of acute hospital admissions were 'because of' Covid-19 as opposed to coincidental 'with' Covid-19. This is lower than the previously reported value of 68% from discharge summaries from NHS boards from between March and August 2021, however these are not directly comparable. Further analysis, based on the clinical audit, showed that 42% of all hospital admissions 'because of' Covid were in those aged over 65[35].
Deaths
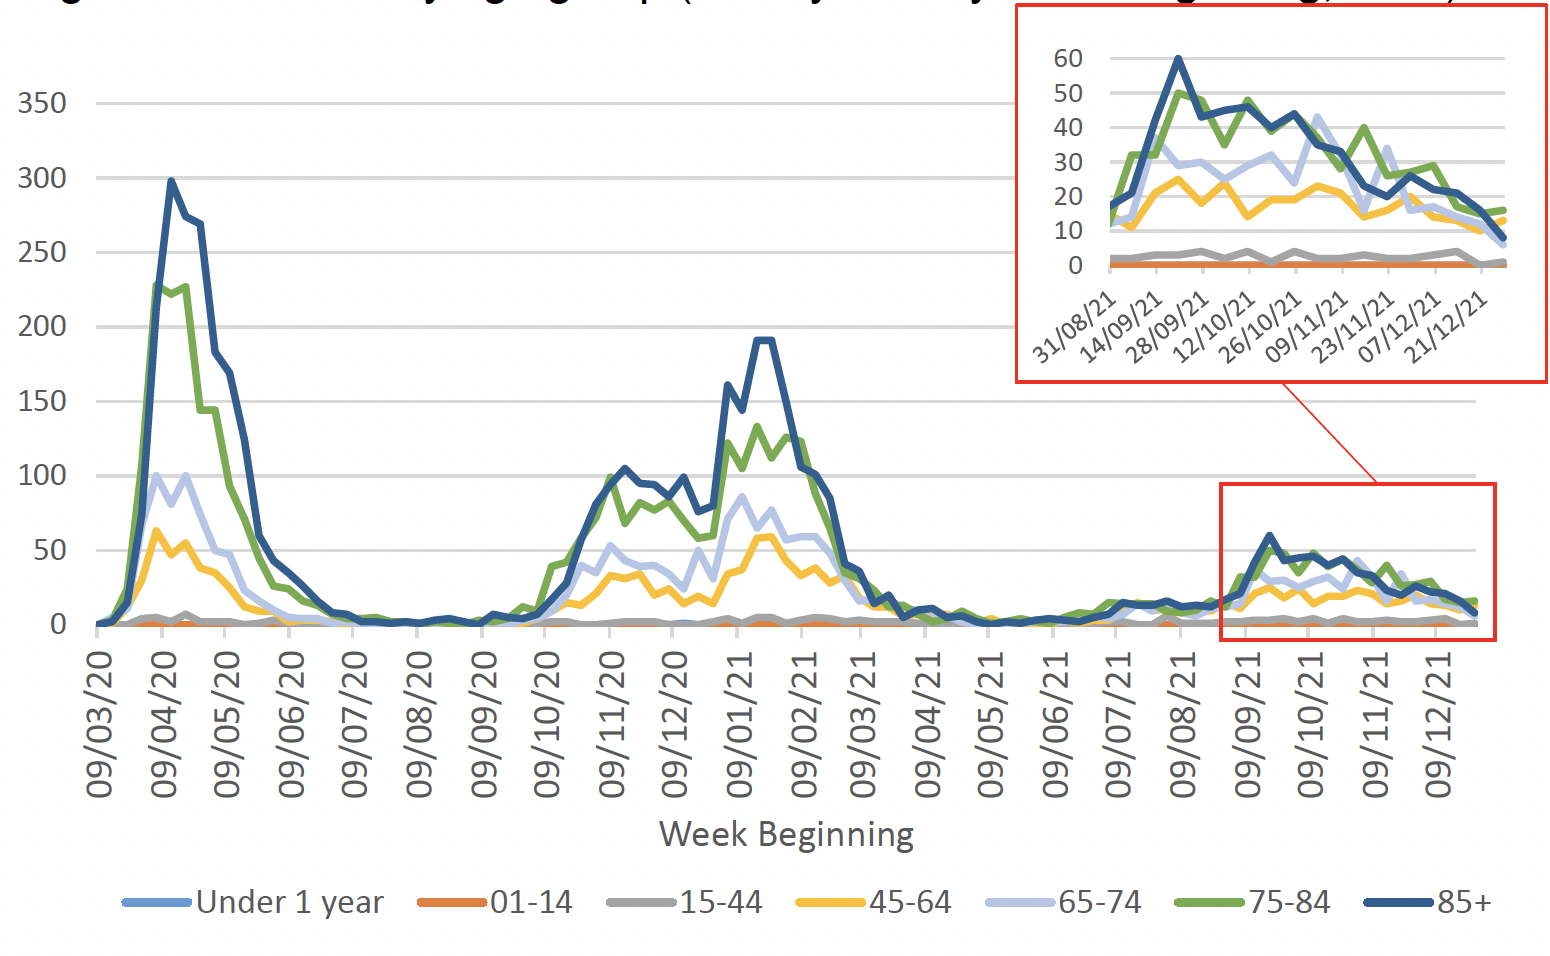
There were 44 deaths registered where Covid-19 was mentioned on the death certificate in the week to 2 January 2022. This is a decrease of 9 (-17%) in the number of deaths from the previous week, and 93% lower than the peak in April 2020 (663 deaths)[36]. In the same week, deaths involving coronavirus increased slightly among those aged 15-44, 45-64 and 75-84, and decreased or remained stable in all other age groups compared to the week ending 26 December 2021 (Figure 10). National Records of Scotland publish a weekly detailed analysis on deaths involving Covid-19 in Scotland in their weekly report[37].
Vaccinations
The first vaccines were administered on Tuesday 8 December 2020 and by 6 January 2022 almost 4.4 million people (91.5% of those aged 12+) had received their first dose and over 4 million people (84.3% of those aged 12+) had received their second dose[38]. There remains a low level of deaths amongst vaccinated individuals.
A booster dose or a third dose of the vaccine is now available in Scotland, in line with JCVI advice including all adults aged over 18 for whom it has been at least 12 weeks since their second dose. Over 3 million people (63.6% of those over 12 years of age) have received their dose 3 or booster vaccine by 6 January 2022[39].
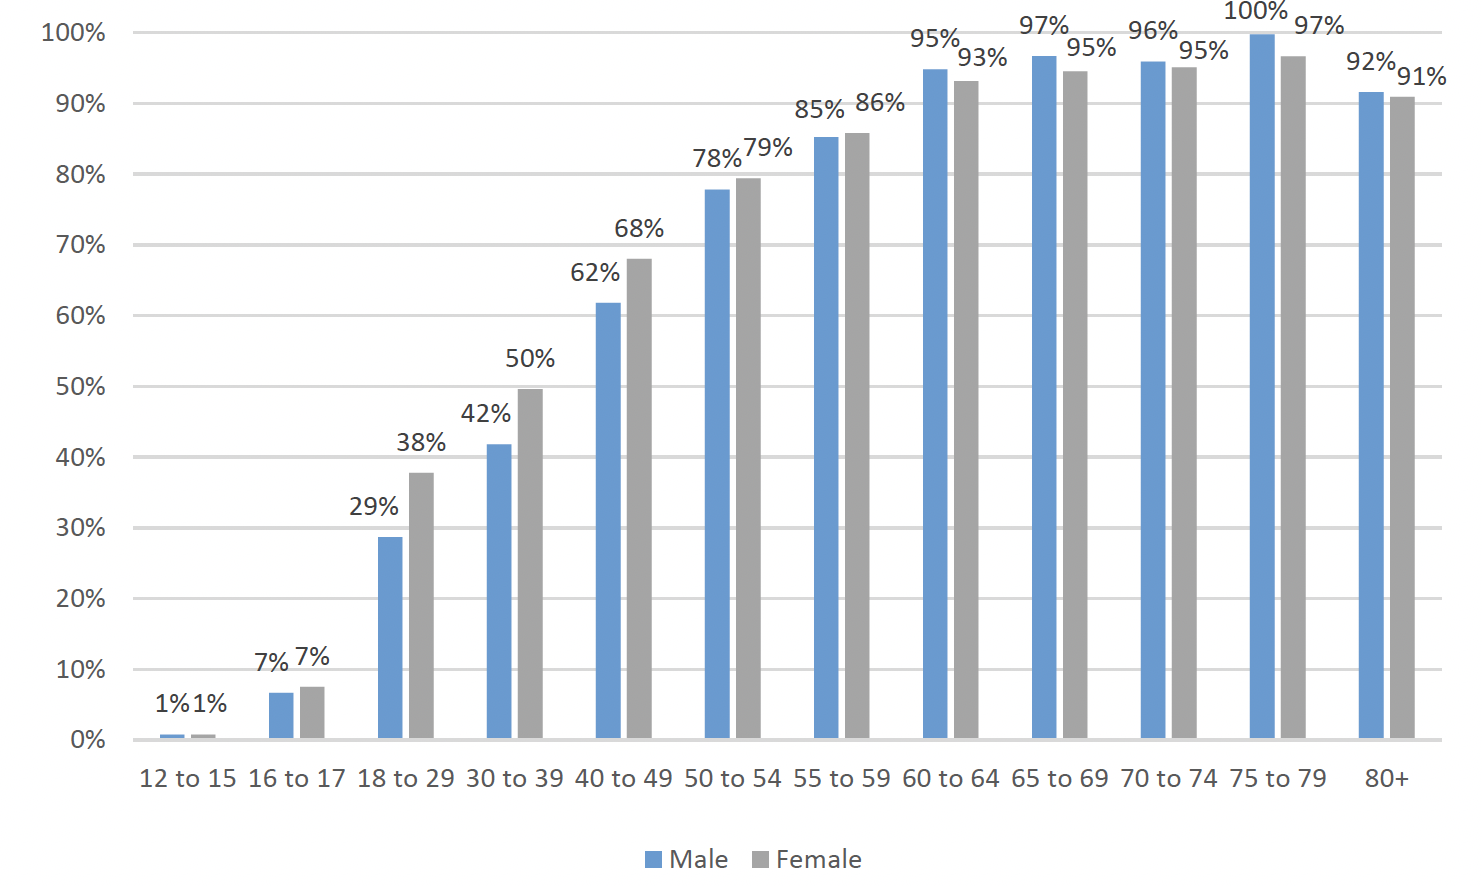
Booster vaccine uptake is at least 91% amongst males and females aged 60 or over, and around 85% for males and females aged 55-59. However, there is a difference between male and female vaccine uptake in those aged between 18 and 49 with females showing a higher uptake compared to males (Figure 11).
Antibodies Estimates
The ONS Covid-19 Infection Survey estimated that in the week beginning 29 November 2021, 95.0% (95% CI: 94.0% to 95.9%) of the adult population living in private residential households in Scotland would have tested positive for antibodies against SARS-CoV-2, as a result of having the infection in the past or being vaccinated. This compares to:
- 95.0% in England (95% CI: 94.2% to 95.7%),
- 93.6% in Wales (95% CI: 92.3% to 94.8%),
- 95.0% in Northern Ireland (95% CI: 94.0% to 95.9%)[40].
The percentage of adults aged 16 to 24 years testing positive for antibodies was 95.8% (95% credible interval: 93.9% to 97.1%). The percentage of adults aged 25 and over testing positive for antibodies ranged from 93.2% to 98.4%. The highest percentage of people testing positive for antibodies was in those aged 75 to 79 at 98.4% (95% credible interval: 97.6% to 98.9%), followed by those aged 65 to 69[41].
The effectiveness of vaccines
On 29 October 2021, the Vaccine Effectiveness Expert Panel (VEEP) published their updated consensus view on the effectiveness of different vaccines on infections, symptomatic disease, and severe disease against Delta variant as well as some initial evidence on vaccine waning effects[42]. The consensus view of vaccine effectiveness against symptomatic disease in fully vaccinated people is between 45-95%, depending on the vaccine and when it was administered however, protection against severe disease including hospitalisation and death remains high (over 80% after two doses of vaccine) over time. The latest UK Health Security Agency (UKHSA) data show an increase in vaccine effectiveness against symptomatic disease with Delta variant after the booster dose[43].
The UKHSA reported that Omicron is displaying a reduction in immune protection against infection, with first estimates of vaccine effectiveness for two doses of Pfizer-BioNTech and AstraZeneca vaccine significantly reduced. The third, booster dose of Pfizer-BioNTech vaccine restores protection against symptomatic disease to 70-75% in the early period after a booster dose. The data are insufficient to quantify the effect of booster on protection against severe disease[44].
PHS estimated in an analysis published on 25 November that 27,656 deaths in people 60 years and older have been directly averted as a result of Scotland's Covid-19 vaccination programme. This equates to an estimated 86% of deaths averted by vaccination in this age group[45].
Situation by local authority within Scotland
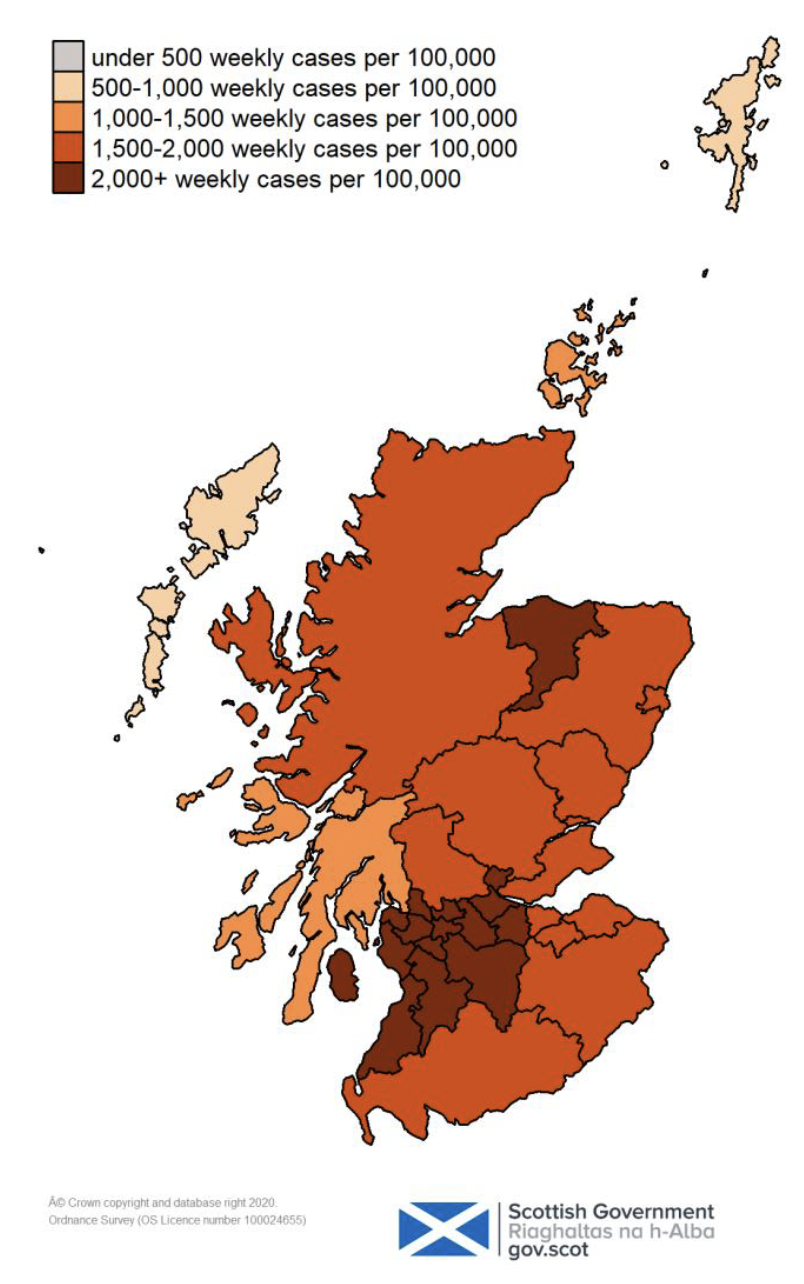
Case rates have increased in Scotland over the past week, with all local authorities seeing an increasing case rate over the week. Inverclyde currently has the highest weekly case rate in Scotland reporting 2,726 weekly cases per 100,000 in the week to 3 January 2022. Shetland has the lowest case rate in Scotland, reporting 708 weekly cases per 100,000 population in the same week (Figure 12 and Table 1)[46].
| Local authority | Total new cases in the week, per 100,000 population | Change since previous week |
|---|---|---|
| Inverclyde | 2,726 | +1,119 |
| South Lanarkshire | 2,687 | +1,061 |
| North Lanarkshire | 2,680 | +0,1034 |
| Renfrewshire | 2,630 | +865 |
| Moray | 2,477 | +1,526 |
| East Renfrewshire | 2,419 | +747 |
| West Dunbartonshire | 2,348 | +770 |
| East Ayrshire | 2,322 | +941 |
| East Dunbartonshire | 2,258 | +581 |
| Glasgow City | 2,194 | +617 |
| North Ayrshire | 2,142 | +1,034 |
| West Lothian | 2,112 | +739 |
| South Ayrshire | 2,061 | +857 |
| Falkirk | 2,019 | +749 |
| Clackmannanshire | 2,012 | +542 |
| Midlothian | 1,914 | +640 |
| Dumfries and Galloway | 1,894 | +1,111 |
| Fife | 1,855 | +860 |
| City of Edinburgh | 1,835 | +418 |
| Stirling | 1,830 | +371 |
| Dundee City | 1,816 | +777 |
| Perth and Kinross | 1,766 | +800 |
| Highland | 1,751 | +1,019 |
| Aberdeen City | 1,748 | +810 |
| East Lothian | 1,744 | +644 |
| Scottish Borders | 1,699 | +497 |
| Angus | 1,662 | +839 |
| Aberdeenshire | 1,540 | +738 |
| Argyll and Bute | 1,332 | +520 |
| Orkney Islands | 1,071 | +67 |
| Na h-Eileanan Siar | 913 | +279 |
| Shetland Islands | 708 | +236 |
| Scotland | 2,062 | +788 |
Modelled rates of positive tests per 100K using data to 4 January indicate that, for the week commencing 16 January 2022, 29 of the 32 local authorities are expected to exceed 50 cases per 100K with at least 75% probability. The exceptions are Na h‑Eileanan Siar, Orkney Islands and Shetland. These 29 areas are also expected to exceed 500 cases per 100K with at least 75% probability.
28 local authorities are expected to exceed 1000 cases per 100K with at least 75% probability. These are Aberdeen City, Aberdeenshire, Angus, City of Edinburgh, Clackmannanshire, Dumfries and Galloway, Dundee City, East Ayrshire, East Dunbartonshire, East Lothian, East Renfrewshire, Falkirk, Fife, Glasgow City, Highland, Inverclyde, Midlothian, Moray, North Ayrshire, North Lanarkshire, Perth and Kinross, Renfrewshire, Scottish Borders, South Ayrshire, South Lanarkshire, Stirling, West Dunbartonshire and West Lothian.
14 local authorities are expected to exceed 3000 cases per 100K with at least 75% probability. These are Aberdeen City, Dumfries and Galloway, Dundee City, East Ayrshire, East Dunbartonshire, Falkirk, Glasgow City, Highland, Inverclyde, North Lanarkshire, Perth and Kinross, Renfrewshire, Scottish Borders and South Lanarkshire.
3 local authorities are expected to exceed 4000 cases per 100K with at least 75% probability. These are Aberdeen City, North Lanarkshire and South Lanarkshire.
Please note that this modelling continues to be based on Covid-19 cases and deaths using data to 4 January from several academic groups to give an indication of whether a local authority is likely to experience high levels of Covid-19 in the future. This has not been compiled via UKHSA into a consensus this week and is based on one modelling group. Due to the Christmas period, there is increased uncertainty due to differences in case reporting. Typically across the regions, case numbers have been lower over Christmas, and have increased sharply since. These trends have been detected to varying degrees by the model.
How Scotland compares with the rest of the UK
Average daily cases in Scotland (2,824 per 1 million population) in the week to 6 January 2022 were above England but below Wales and Northern Ireland:
- England (2,615 per 1 million)
- Wales (3,481 per 1 million)
- Northern Ireland (3,893 per 1 million)[47].
Average daily deaths in Scotland (1 per 1 million population) in the week to 6 January were below all other UK nations (2 per 1 million each)[48].
There were 17,988 confirmed Covid-19 patients in hospital in the UK on 5 January 2022, with 15,659 of them reported in England, 1,223 in Scotland, 702 in Wales and 404 in Northern Ireland[49]. This translates to 24 patients per 100,000 population for England, 18 patients per 100,000 in Scotland, 19 per 100,000 for Wales and 22 per 100,000 for Northern Ireland (based on 7 day averages for all 4 nations). Please note that data about Covid-19 patients in hospitals are collected differently by each nation and therefore might not be directly comparable.
Over the four-week period ending 6 December 2021, an estimated 1,266,000 people (95% confidence interval: 1,228,000 to 1,304,000) in the private residential population in the UK (1.96%; 95% CI: 1.90% to 2.02%) reported experiencing long Covid (symptoms persisting more than four weeks after the first suspected coronavirus (Covid-19) episode that are not explained by something else). In Scotland, over the same period, an estimated 100,000 people (1.90% of the respective population) in the private residential population reported experiencing long Covid of any duration. This compares to 1.98% in England, 1.91% in Wales and 1.57% in Northern Ireland[50].
Looking ahead
Scottish Contact Survey
Changes in patterns of mixing and adherence to restrictions will impact on future case numbers. The Scottish Contact Survey measures times and settings that people mix where they could potentially spread Covid-19. Average contacts from the most recent Panel A cohort of the Scottish Contact Survey (week ending 29 December) indicate an average of 5.2 contacts.
Mean contacts have decreased within the work and other setting (contacts outside home, school and work) reducing by 26% and 23% respectively. Contacts within the home have increased by 22% over the same period.
All age groups, with the exception of those aged 18-29, have decreased their contacts. The 18-29 age group have reported an increase of contacts by 21%. This is largely driven by a rise in contacts within the home and work.
Self-reported compliance with the current regulations and guidance has decreased since January but remains at a high level. On 4-5 January, 69% of people reported 'complete' or 'almost complete' compliance[51].
Modelling the Epidemic
The latest Modelling the Epidemic report shows estimated number of infections, including projections over the four weeks to end of January for combined Delta and Omicron infections. Infections, hospitalisations and hospital occupancy have been increasing and are expected to continue to rise as Omicron continues to spread.
Next steps
The Scottish Government continues to work closely with Public Health Scotland and modelling groups to monitor what is happening across Scotland.
Each week this report will provide an overview of the current Covid-19 situation in Scotland. This will include real time data on case rates, hospitalisations and deaths and how Scotland's figures compare to those from the rest of the UK.
Modelling can tell us where the epidemic is likely to be heading. Local data and data by age group can highlight where problems arise, which can help in addressing some of these issues. In the coming weeks the roll out of the vaccine will continue to be monitored along with the impact of this on case rates and deaths among different age cohorts. Investigations are ongoing by NERVTAG, SPI-M, SAGE, UKHSA, Public Health England and Public Health Scotland regarding the impact of new variants and of vaccination; this will be reflected here as work is undertaken.