Coronavirus (COVID-19): modelling the epidemic (Issue No.96)
Latest findings in modelling the COVID-19 epidemic in Scotland, both in terms of the spread of the disease through the population (epidemiological modelling) and of the demands it will place on the system, for example in terms of health care requirement.
Coronavirus (Covid-19): modelling the epidemic in Scotland (Issue No. 96)
Background
This is a report on the Scottish Government modelling of the spread and level of Covid-19 in Scotland. This updates the previous publication on modelling of Covid-19 in Scotland published on 24th March 2022. The estimates in this document help the Scottish Government, the health service and the wider public sector plan and put into place what is needed to keep us safe and treat people who have the virus.
This edition of the research findings focuses on the epidemic as a whole, looking at estimates of R, growth rate and incidence as well as local measures of change in the epidemic.
Following a consultation, UKHSA is introducing a change in the frequency that the Covid-19 consensus (eg the estimates of R, growth and incidence where available), to every two weeks from this week. This will also affect the frequency of medium term projections. This publication will therefore move to this two week frequency. The next Modelling the Epidemic reports will be published on 14th April, 28th April and 12th May.
Where models rely on PCR and LFD testing, they will be paused and archived ready for re-instatement if needed in the future.
Key Points
- The reproduction rate R in Scotland is currently estimated as being between 0.9 and 1.1, as at 15th March 2022. The lower and upper limits have both decreased since last week.
- The daily growth rate for Scotland is currently estimated as between ‑1% and 2% as at 15th March. The lower and upper limits have both decreased since last week.
- UKHSA was unable to reach a consensus on the incidence of new daily infections in Scotland as at 15th March.
- Average contacts from the most recent Panel A cohort of the Scottish Contact Survey (week ending 23rd March) indicate an average of 4.1 contacts. This has decreased by 15% compared to the previous Panel A of the survey (week ending 9th March).
- Mean contacts have decreased in the majority of locations with the exception of contacts within the home setting which have remained at a similar level in the last two weeks. Contacts have reduced in the work setting by 11% and in the other setting (contacts outside home, school and work) by 8%.
- Individuals within the youngest age groups (18-59) have reported a decrease in contacts within the last two weeks, by at least 15%. Those within the older age groups (60+) have increased their contacts in the last two weeks with those over 70 increasing the most, by 12%.
- The biggest decrease in interactions is between those aged under 18 and the 50-59 age group.
- Visits to an essential shop have shown the biggest decrease, decreasing from approximately 86% to 82%. The biggest increase has been in individuals using public transport, increasing from 25% to 27% in the last two weeks.
- The number of people wearing a face covering where they have at least one contact outside of the home has not changed in the last two weeks, currently at 84%.
- Approximately 80% of individuals had taken at least one lateral flow test within the last 7 days for the survey pertaining to the 17th March - 23rd March, increasing from 75% two weeks prior.
- Approximately 35% of individuals believe they have had Covid-19 at least once since March 2020. Of those who think they have had Covid-19, 84% have had this confirmed through a test.
- Modelled rates of positive tests per 100K using data to 28th March indicate that, for the week commencing 10th April, all 29 of the local authorities included are expected to exceed 100 cases per 100K with at least 75% probability. These same 29 local authorities also have at least a 75% probability of exceeding 300 cases per 100K.
- 21 of the 29 local authorities included are expected to exceed 500 cases per 100K with at least 75% probability. The exceptions are Angus, Clackmannanshire, East Ayrshire, East Dunbartonshire, East Lothian, Inverclyde, South Lanarkshire and West Dunbartonshire.
- None of the local authorities included are expected to exceed 1000 cases per 100K with at least 75% probability.
- Analysis indicates that there remains a substantial variation in geographical risk of infection when considering the average recorded census age and booster vaccination uptake.
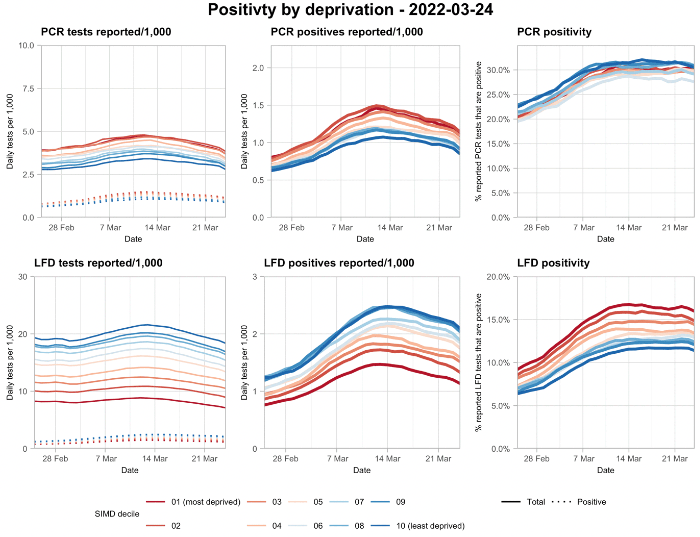
- There is evidence that case ascertainment is stabilising, as while the number of tests reported is decreasing, positivity appears stable across all deprivation deciles.
- The distribution of lateral flow/LFD tests being reported continues to vary substantially by both age and deprivation status, with many fewer tests reported in younger adults and children especially in the more deprived deciles. The high level of LFD positivity in the latter category remains high and when compared to the high number of positives amongst the least deprived, consistent with under ascertainment being concentrated in particular groups.
- Uptake of second vaccine doses is now the best predictor of variation in the number of cases per area.
- Nationwide, wastewater Covid-19 levels have again risen. The week ending on 29th March saw levels of around 297 million gene copies per person per day (Mgc/p/d), an increase of around a half from 200 Mgc/p/d the previous week (week ending 22nd March).
Recent cases
Figure 1 shows the number of Covid-19 cases (from either PCR or LFD) in Scotland between January and March 2022. The vertical dashed lines indicate the cut off points for each of the modelling inputs; after these dates, the number of cases is not incorporated into the outputs.
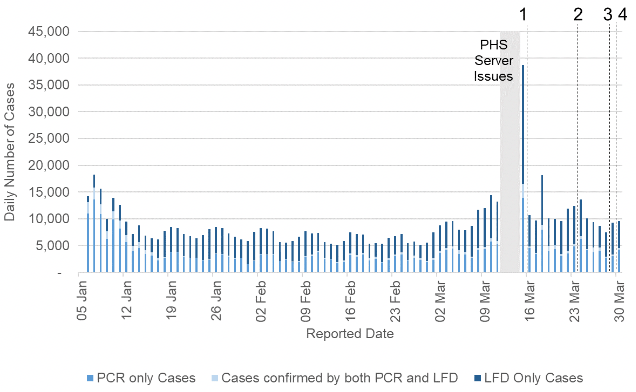
R and growth rate are as of 15th March 2022 (dashed line 1). The Scottish Contact Survey uses data to 23rd March 2022 (dashed line 2). The modelled rates of positive tests per 100K use data to 28th March (dashed line 3). The wastewater analysis and the future scenario work use data to 29th March 2022 (dashed line 4).
Overview of Scottish Government Modelling
Modelling outputs are provided here on the current epidemic in Scotland as a whole, based on a range of methods. Because it takes a little over three weeks on average for a person who catches Covid-19 to show symptoms, become sick, and either die or recover, there is a time lag in what our model can tell us about any change in the epidemic.
This week the Scottish Government presented two outputs to EMRG. The first uses wastewater data. The second uses data from our agent-based model.[2] As outlined above, the Scottish Government will no longer be using our model which uses positive LFD or PCR tests. These outputs are included in Figure 2.
This analysis will continue on a two week basis if a consensus is available.
The R value and growth rates are estimated by several independent modelling groups based in universities and the UKHSA. Estimates are considered, discussed and combined at the Epidemiology Modelling Review Group (EMRG), which sits within the UKHSA. These are based on data to 28th March.
UKHSA's consensus view across these methods was that the value of R in Scotland is between 0.9 and 1.1, as of 15th March 2022[3] (Figure 2). The lower and upper limits have both decreased last week. R is an indicator that lags by two to three weeks.
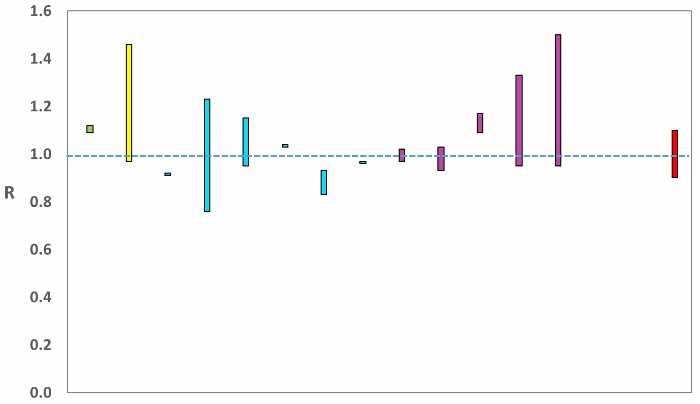
Source: EMRG
The consensus from UKHSA for this week is that the growth rate in Scotland is between -1% and 2% per day as at 15th March. The lower and upper limits have decreased since last week.
UKHSA was unable to form a consensus view on the incidence of new daily infections in Scotland as at 15th March.
What we know about how people's contact patterns have changed
This analysis will continue on a two week basis in future reports.
Average contacts from the most recent Panel A cohort of the Scottish Contact Survey (week ending 23rd March) indicate an average of 4.1 contacts. This has decreased by 15% compared to the previous Panel A of the survey (week ending 9th March), as seen in Figure 3. Mean contacts have decreased in the majority of locations with the exception of contacts within the home setting which have remained at a similar level in the last two weeks. Contacts have reduced in the work setting by 11% and in the other setting (contacts outside home, school and work) by 8%.
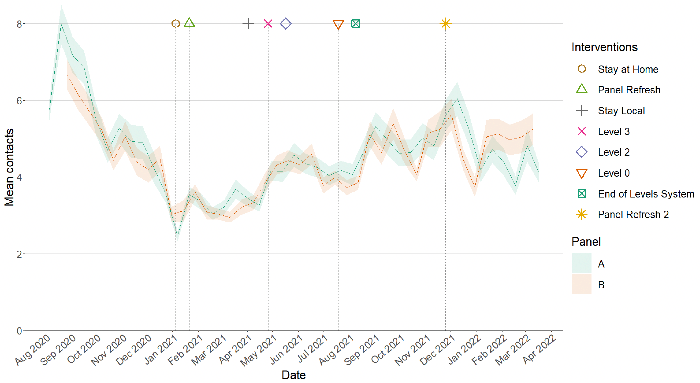
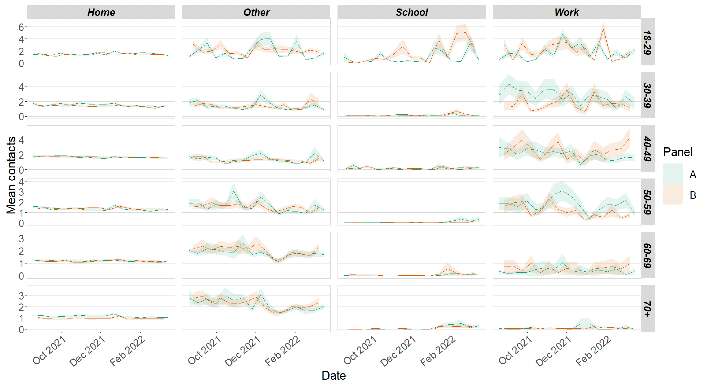
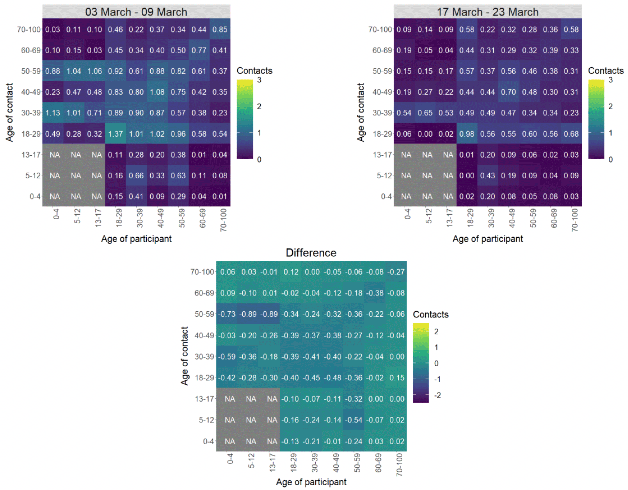
Figure 4 shows how contacts change across age group and setting. Individuals within the youngest age groups (18-59) have reported a decrease in contacts within the last two weeks, by at least 15%. Those within the older age groups (60+) have increased their contacts in the last two weeks with those over 70 increasing the most, by 12%.
The heatmaps in Figure 5 show the mean overall contacts between age groups for the weeks relating to 3rd March - 9th March and 17th March - 23rd March and the difference between these periods. The biggest decrease in interactions is between those aged under 18 and the 50-59 age group.
The majority of locations have shown a decrease in visits in the last two weeks. Visits to an essential shop have shown the biggest decrease, decreasing from approximately 86% to 82%. The biggest increase has been in individuals using public transport, increasing from 25% to 27% in the last two weeks as shown in Figure 6.
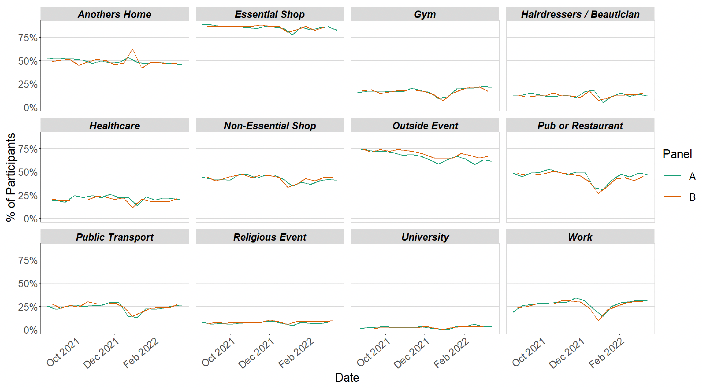
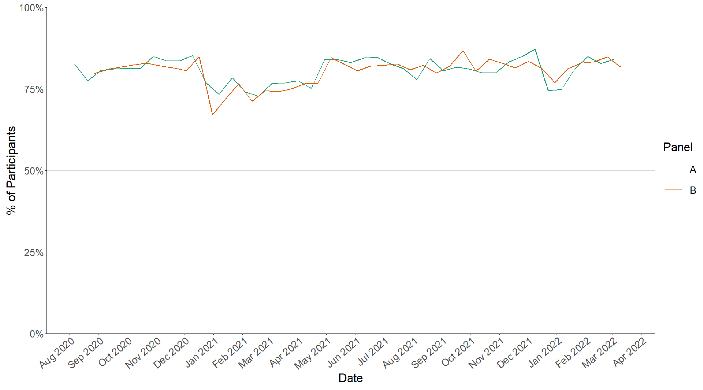
Figure 7 shows the number of people wearing a face covering where they have at least one contact outside of the home. This has not changed in the last two weeks, currently at 84%.
Approximately 80% of individuals had taken at least one lateral flow test within the last 7 days for the survey pertaining to the 17th March - 23rd March, increasing from 75% two weeks prior as shown in Figure 8.
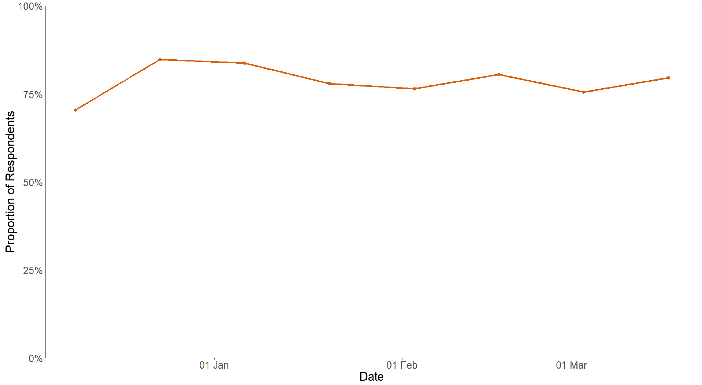
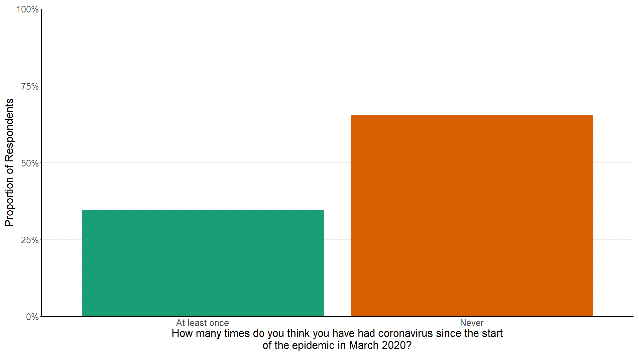
Figure 9 shows that approximately 35% of individuals believe they have had Covid-19 at least once since March 2020. Of those who think they have had Covid-19, 84% have had this confirmed through a test.
What the modelling tells us about estimated infections and hospitalisations
SPI-M-O has not produced medium-term projections this week and therefore we have not included the usual Scottish Government medium‑term projections.
If available, this analysis will continue on a two week basis in future reports.
What we know about which local authorities are likely to experience high levels of Covid-19 in two weeks' time
We continue to use modelling based on Covid-19 cases and deaths using data to 28th March from several academic groups to give us an indication of whether a local authority is likely to experience high levels of Covid-19 in the future. This has been compiled via UKHSA into a consensus.
The local modelling consensus will be paused in future weeks but will be ready to re-instate if required in the future.
In less populated regions in which case numbers are small, there is a greater variation in model estimates, and hence increased uncertainty. This has led to this analysis not including Na h-Eileanan Siar, Orkney Islands and Shetland Islands this week.
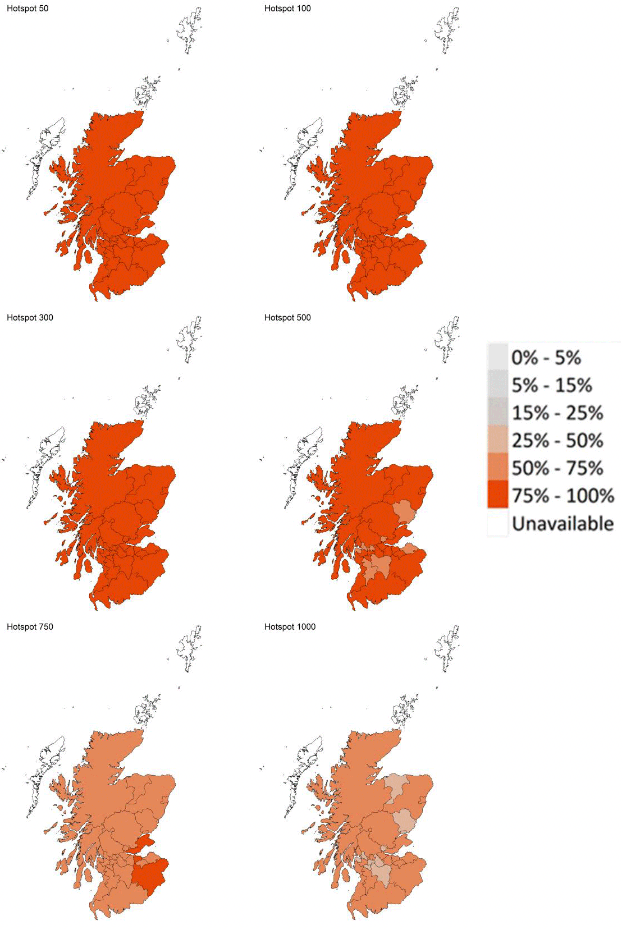
In this, an area is defined as a hotspot if the two week prediction of cases (positive tests) per 100K population is predicted to exceed a threshold, e.g. 500 cases.
Modelled rates of positive tests per 100K using data to 28th March (Figure 10) indicate that, for the week commencing 10th April, all 29 of the local authorities included are expected to exceed 100 cases per 100K with at least 75% probability. These same 29 local authorities also have at least a 75% probability of exceeding 300 cases per 100K.
21 of the 29 local authorities included are expected to exceed 500 cases per 100K with at least 75% probability. The exceptions are Angus, Clackmannanshire, East Ayrshire, East Dunbartonshire, East Lothian, Inverclyde, South Lanarkshire and West Dunbartonshire.
None of the local authorities included are expected to exceed 1000 cases per 100K with at least 75% probability.
Looking to the future
What may happen in the future around SARS-CoV-2 is uncertain and therefore there are a number of possible Covid-19 futures that may occur in the future. For example, the current Omicron wave may dissipate leaving low levels of Covid-19, or a new variant may emerge potentially having vaccine escape or increased severity, or people's behaviours may change. One approach to this uncertainty is to model alternative versions of the future through the development of different Covid-19 scenarios. This scenario modelling was most recently published in Issue 92 and is updated here to include more up to date data and it incorporates our latest assumptions.
Over the coming months we will update these outputs as circumstances change to support ongoing planning and management of the pandemic.
Given what we know about Covid-19 these possible futures range from a world where immunity reduces Covid-19 hospitalisations and deaths to low levels, through to variant world where a variant with immune escape enters Scotland and Covid-19 hospitalisations and deaths could increase. In between these two extremes could be possible futures where vaccine effectiveness wanes or where people's behaviour becomes polarised between those who continue with Covid-19 precautions e.g. hand washing etc. and those who do not.
The scenarios we provide in the next section look at what could happen for planning purposes, not to forecast what will happen. These scenarios include the changes announced on 15th March. The assumptions are based on our most up to date knowledge, but do not include the effect of future changes in treatment of Covid-19 e.g. widespread use of antivirals or changes in behaviour in response to high levels of infections e.g. in variant world. Therefore, in the most extreme scenarios the peak may be lower than suggested if behaviour or restrictions changed.
There is no linear progression between the worlds and all are plausible. Each world inherently contains a different threat level requiring a different approach to management.
Immune World
In this possible future vaccines and natural immunity are effective at keeping Covid-19 at low levels. New variants may emerge in Scotland but for the foreseeable future infections are based around Omicron.
Infections may decrease from current levels over the coming weeks and months to very low levels. Likewise hospital and ICU occupancy may follow this trend relieving the pressure on healthcare services. Issues with new variants are not considered in this world and therefore levels of infections remain low.
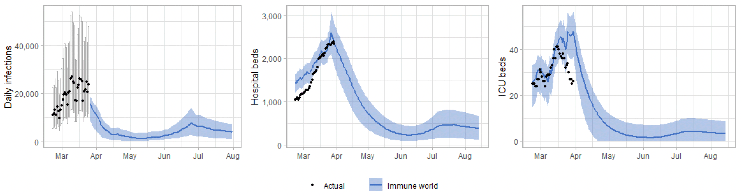
In Immune world Covid-19 in Scotland reduces below epidemic levels, becoming endemic. Cases of Covid-19 therefore spring up only as rare outbreaks which are controlled through public health measures. People's lives return to something close to normality e.g. physical distancing is not needed but people still choose to self-isolate and hygiene is good. As vaccines are effective, take-up of first/second/third doses are good and boosters become part of an annual cycle like flu. The numbers of people who need medical treatment or hospitalisation for Covid-19 remain low.
The focus moves away from Covid-19 response and into recovery. This includes addressing learning losses, treating Long Covid and working through the hospital backlog. Wellbeing measures improve with reduced anxiety and increased happiness. Those from the highest risk groups feel they can reintegrate without government interventions. The economy begins to recover from the effects of Covid-19. Travellers do not face significant issues with trips overseas.
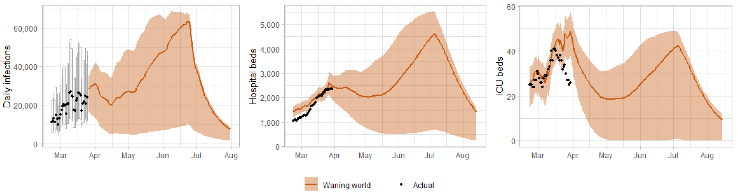
Waning world
In this world Covid-19 vaccines are effective but waning then occurs. It is hard to keep pace with booster vaccinations which become increasingly difficult to justify. Demands for vaccines throughout the rest of the world and the increasing reluctance of people in Scotland to keep being boosted reduces the overall immunity levels of the population.
Infections may remain at current levels initially before increasing with a decrease following thereafter as the natural immunity begins to offset the waning of vaccine acquired immunity.
Impacts on hospital/ICU occupancy are uncertain but levels would be higher than has been observed in summer 2020 and 2021 and higher than what may happen in Immune world (see Figure 12).
The number of people who need medical treatment or hospitalisation for Covid-19 rises particularly in vulnerable/older age groups where it is increasingly difficult to deliver an effective booster regime.
The focus continues to be on Covid-19 response and it is harder to shift on to recovery. Hospitals are still dealing with increasing cases of Covid‑19 putting pressure on healthcare services and workforce which also puts pressure on other public services and budgets. Work is ongoing on rectifying learning loss but continued cases of Covid-19 within education settings with children and staff being off school slows the effectiveness of this work.
The population becomes segmented as the most vulnerable due to vaccine waning lead restricted lives or accept significant risk of serious illness and experience high levels of anxiety and low levels of wellbeing. The rest of the population live a more normal life accepting the possibility of infection with mild illness. Anxiety reduces but does not disappear, likewise wellbeing increases but there is still concern about infection. The economy continues to be impacted by workforce absences, the self-shielding actions of a proportion of the population and risk adverse behaviours.
Polarised world
In this world, vaccines and natural immunity are effective at reducing infections. The approach followed relies on individual risk assessment and behaviours. However, society becomes polarised as some continue to take up vaccines and follow guidance while others are more reluctant. Covid-19 becomes a disease associated with those who do not or cannot get full vaccine benefit and do not or cannot adopt a risk based approach maintaining baseline measures.
Infections may remain at current levels initially before increasing with a decrease following thereafter as the natural immunity begins to offset the waning of vaccine acquired immunity.
This world assumes that behavioural changes beginning to occur in response to the lifting of restrictions and to the better weather.
Vaccine waning is included in this world whereby only some of those with three doses come forward for a potential fourth dose.
Impacts on hospital/ICU occupancy are uncertain but levels would be higher than has been observed in summer 2020 and 2021 and higher than what may happen in Immune world (see Figure 13).
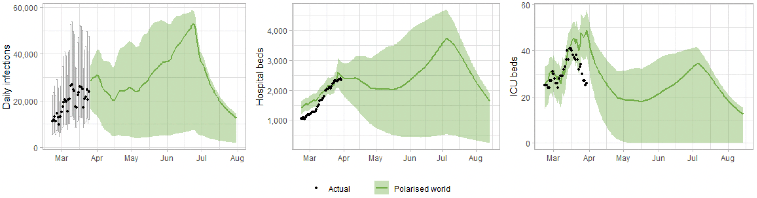
Cases of Covid-19 spring up and are hard to control in those who are not vaccinated or vulnerable. People's lives return to a "new normal" but, due to polarised groups in society with some following and some not following the guidance on baseline restrictions, infections remain.
Vaccines are effective so older and more vulnerable people come forward for future doses in high numbers but those who are less severely affected do not. Vulnerable groups such as the very elderly and immune compromised are at risk from infection from those not vaccinated or boosted.
The focus remains on Covid-19 and the shift onto recovery is slower. Existing learning losses are harder to rectify and continue to accrue due to infections within education settings. The hospital backlog is difficult to address as hospitals are still dealing with Covid-19 cases. The population becomes polarised in to those whose wellbeing improves e.g. lower risk people and those whose wellbeing deteriorates e.g. higher risk or poorer people whose levels of anxiety increase as Covid-19 circulates. They continue to experience greater illness, greater poverty or disruption to their income. The economy continues to be impacted from the effects of Covid-19.
Variant world – vaccine escape with same severity as Delta
In this possible future a variant with vaccine escape emerges in Scotland presenting a challenge even for fully vaccinated people. This new variant leads to increased transmission, but not to increased severity. Baseline guidance remains and, in this scenario other NPIs may need to be put in place for a short time. This world is similar to what has happened in Scotland with the emergence of Omicron.
Omicron may be reduced to low levels within Scotland as a new variant takes over. This causes a new wave of Covid-19 infections. However this wave is not accompanied by significant numbers with serious illness and vaccines continue to protect. People's lives are disrupted due to the increasingly high levels of infections leading to time off work ill or isolating.
To show the potential impact assume a new variant appears in Scotland as people return from their summer holidays and return to work and school. The timing is uncertain and a potential new variant may appear sooner than the summer or significantly later but has currently been lined up with the summer holidays to show illustratively what could happen. The new variant may cause Omicron infections to decrease significantly or disappear entirely (and so we do not show actuals in Figure 14). The new variant is modelled with similar transmissibility and vaccine escape as Omicron with severity characteristics similar to Delta. It could lead to high levels of infections leading to hospital occupancy rising above capacity restrictions. With sustained high levels of infection we could again see increased staff absences in a number of sectors that were affected by this in the recent Omicron wave.
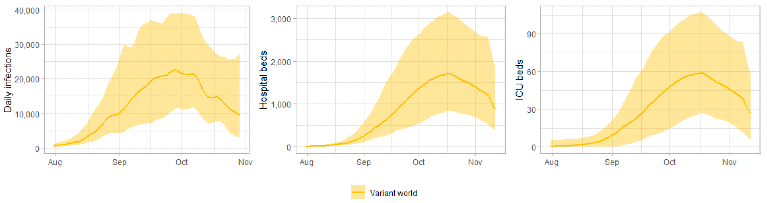
The focus remains on Covid-19 and it is hard to shift on to recovery. Continued infections within education settings and staff shortages make some school closures necessary. The Covid-19 strain on hospitals is high due to the very high numbers of infections and workforce pressures grow making it difficult to address the hospital backlog. Wellbeing measures deteriorate with people reporting low happiness and general 'tiredness with it all'. The economy continues to be impacted from the effects of Covid-19 with many people off work. Travellers may not want to come to the UK as the new variant sweeps through.
Please note that the charts shown in Figure 14 start from zero and do not account for infections, hospital occupancy, or ICU occupancy attributed to the currently circulating variants and hence appear lower than they may be when considering infections and occupancy figures from all Covid-19 variants in aggregate.
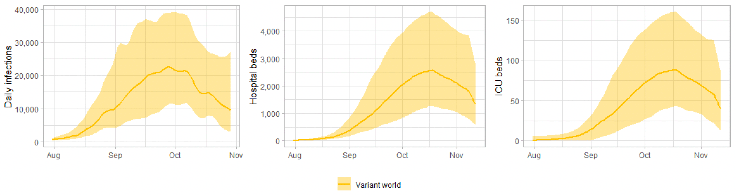
Variant world – vaccine escape with increased severity compared to Delta
As with the other example of Variant world, a new variant appears in Scotland as people return from their summer holidays and return to work and school. The timing is uncertain but has currently been lined up with the summer holidays where reduced travel restrictions may make it more likely that a new variant is brought into Scotland.
The new variant may cause Omicron infections to decrease significantly or disappear entirely (and so we do not show actuals in Figure 15). It is modelled with similar transmissibility and vaccine escape as Omicron with severity characteristics 50% higher than Delta, purely for illustrative purposes.
It could lead to high levels of infections leading to hospital occupancy rising well above capacity restrictions. With sustained high levels of infection we could again see increased staff absences in a number of sectors that were affected by this in the recent Omicron wave.
The four worlds plausible scenarios as presented in this section should not be considered predictions. It is difficult to ascertain which of these scenarios may be the more likely and in reality the situation is likely to move from one to the other and not in a linear fashion. Instead they provide some illustration of what each world could look like and the issues to be considered. Over the coming months they will be updated as circumstances change to support ongoing planning and management of the pandemic.
Please note that the charts shown in Figure 15 start from zero and do not account for infections, hospital occupancy, or ICU occupancy attributed to the currently circulating variants and hence appear lower than they may be when considering infections and occupancy figures from all Covid-19 variants in aggregate.
Summary of spatial analysis of Covid-19 spread in Scotland
This analysis on vaccinations will continue on a two week basis in future reports. However the work on PCR and LFD tests presented below will be paused but ready to re-instate if required.
Researchers at the Edinburgh Roslin Institute have conducted spatial analysis of Covid-19 Spread in Scotland. A summary of findings from the week from 22nd February to 28th February 2022 is included here. Risk factors indicate where the number of cases are higher than expected geographically (i.e. administrative data zones), but do not necessarily represent the risk to individuals in those areas.
Table 1 shows the outcome of a Negative binomial model of risk factors by data zone. eDRIS[10] data was taken on 28th March , covering the period from 12th to 25th March.
| Risk factor | DZ Range (5%-95%) | % Change in cases from mean at 5% | % Change in cases from mean at 95% | |
|---|---|---|---|---|
| Log(population) | 6.22-7.0 | 66.8% | 146.0% | |
| Deprivation | SIMD score | 4.14 – 56.3 | 100.9% | 98.2% |
| SIMD housing | 1.17 – 63.7 | 102.9% | 94.2% | |
| SIMD access | 1.16 – 61.8 | 102.9% | 94.3% | |
| Vaccine uptake | % First vaccine uptake | 76.4 – 107.1 | 98.8% | 101.0% |
| % Second vaccine uptake | 93.2 – 96.8 | 86.6% | 111.3% | |
| % Booster uptake | 75.8 – 89.1 | 90.0% | 108.7% | |
| Mean age | 33.3 – 50.0 | 120.4% | 84.2% |
There remains a substantial variation in risk of infection by average census age in each datazone. Deprivation in this period is not a substantial factor when comparing across local authorities. Second vaccine dose uptake is now the best predictor of cases per datazone.
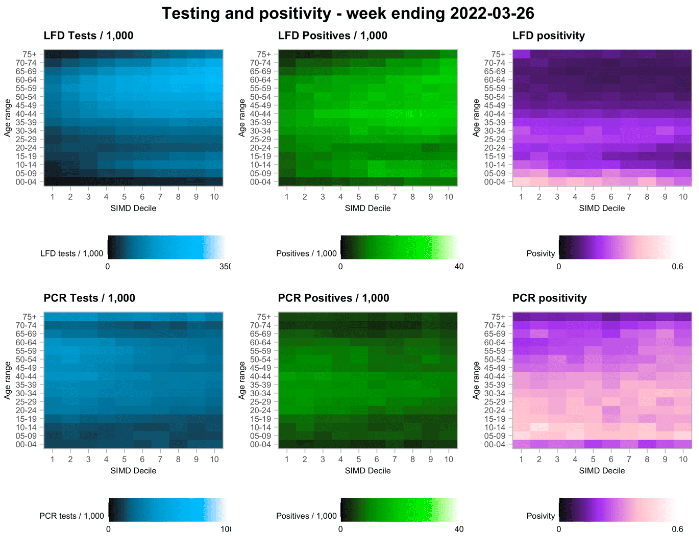
The numbers of PCR and LFD tests are both still declining, but positivity appears to be stabilising, though not yet decreasing. This occurs across all deprivation scores and therefore ascertainment may also be stabilising.
The distribution of lateral flow/LFD tests being reported varies substantially by both age and deprivation status, with many fewer tests reported in younger adults across all deciles of deprivation, and for children in more deprived deciles. The high level of LFD positivity in the latter category is marked, and when compared to the high number of positives amongst the least deprived, suggests that ascertainment may be lower in younger people in deprived areas. Patterns of PCR testing and positivity are now also more similar to each other, than in previous weeks.
What can analysis of wastewater samples tell us about local outbreaks of Covid-19 infection?
This analysis will continue on a two week basis in future reports.
Levels of Covid-19 RNA in wastewater (WW) collected at a number of sites around Scotland are adjusted for population and local changes in intake flow rate (or ammonia levels where flow is not available). See Technical Annex in Issue 34 of these Research Findings for the methodology. These reports are based on the most recent data available. Future updates to data may lead to small retrospective changes.
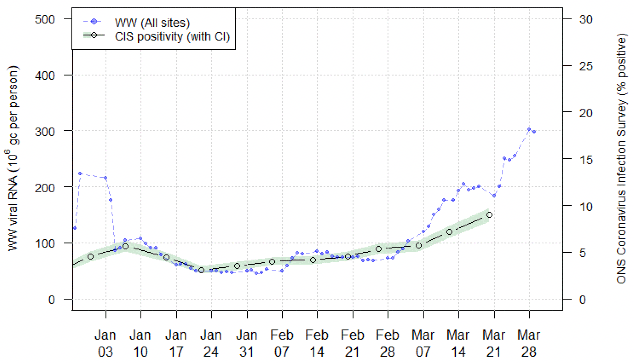
Nationwide, wastewater Covid-19 RNA levels have again risen. The week ending on 29th March saw levels of around 297 million gene copies per person per day (Mgc/p/d), an increase of around a half from 200 Mgc/p/d the previous week (week ending 22nd March).
In Figure 18, plotting covers the period from the start of 2022. The Omicron variant emerged in Scotland around mid-December 2021. After the end of 2021, S-gene dropout testing data suggest that nearly all cases are from the Omicron variant. During the period of change in the dominant variant, a change to the relationship between the WW Covid‑19 levels and case numbers was observed and postulated to be due to different levels of virus shed by the two variants. If this assumption is true, and there is no further change in shedding following the emergence of the Omicron variant BA.2, then from early January 2022, WW Covid-19 levels should have a consistent relationship with the underlying Covid-19 prevalence. In Figure 18, we also superimpose data from the ONS Coronavirus Infection Survey (CIS) to 20th March, with axis scaling chosen to match post-2021 levels of WW Covid-19 and CIS prevalence. Note that this scaling is not the same as that used in reports prior to 1st January 2022, where a scaling based on 2021 data was used.
This graph shows that while WW viral levels were stable from around 14th to 22nd March, they appear to be currently rising again this week. The number of samples analysed this week dropped to around 130 samples from over 200 in recent weeks, due to experimental work at SEPA, which could affect the uncertainty of estimates. Case data also do not show this most recent rise. Nevertheless, the pattern of increase appears to have been sustained for a number of days.
Long Covid
A report on the rate of long Covid has not been included this week. We will report the long Covid projections again once updated estimates of self-reported long Covid prevalence amongst those infected with the less severe Omicron variant become available.
What next?
We hope to include our analysis on long Covid in future weeks.
This publication will move to a two week frequency. The next Modelling the Epidemic reports will be published on 14th April, 28th April and 12th May.
Over the coming weeks, archiving of models will be undertaken via the publicly available Data Science Scotland GitHub organisation[14] and will include code and details of peer reviews. The full list of models is listed in Table 4 in the Technical Annex.