Coronavirus (COVID-19): modelling the epidemic (issue no.90)
Latest findings in modelling the COVID-19 epidemic in Scotland, both in terms of the spread of the disease through the population (epidemiological modelling) and of the demands it will place on the system, for example in terms of health care requirement.
Coronavirus (COVID-19): modelling the epidemic in Scotland (Issue No. 90)
Background
This is a report on the Scottish Government modelling of the spread and level of Covid-19 in Scotland. This updates the previous publication on modelling of Covid-19 in Scotland published on 10th February 2022. The estimates in this document help the Scottish Government, the health service and the wider public sector plan and put into place what is needed to keep us safe and treat people who have the virus.
This edition of the research findings focuses on the epidemic as a whole, looking at estimates of R, growth rate and incidence as well as local measures of change in the epidemic.
Key Points
- The reproduction rate R in Scotland is currently estimated as being between 0.8 and 1.0, as at 1st February 2022. This has not changed since last week.
- The daily growth rate for Scotland is currently estimated as between ‑3% and 1% as at 1st February. The lower and upper limits have increased since last week.
- The number of new daily infections for Scotland is estimated as being between 204 and 377 as at 1st February, per 100,000 people.
- Average contacts from the most recent Panel A cohort of the Scottish Contact Survey (week ending 9th February) indicate an average of 4.4 contacts. This has decreased by 7% compared to the previous Panel A of the survey.
- Mean contacts have decreased within the work setting by 37%, while contacts within the other setting (contacts outside home, school and work) have increased by 40%. Contacts within the home have remained at a similar level over the same period.
- Individuals under 50 years of age have reported a decrease in contacts in the last two weeks whereas those aged 50 years and over have reported an increase. Increases were largely driven by contacts within the work setting for those in the 50 - 59 age group, with individuals aged 60 and over reporting a rise in contacts within the other setting.
- The biggest decrease in interactions between age groups is between those aged 30-49 with individuals under 18.
- Visits to a pub or restaurant have shown the biggest increase, increasing from approximately 38% to 45% while visits to an essential shop have shown the biggest decrease, decreasing from 87% to 85% in the last two weeks.
- Approximately 76% of individuals had taken at least one lateral flow test within the last 7 days for the survey pertaining to the 3rd February - 9th February, decreasing from 78% two weeks prior.
- The future trajectory of infections, hospitalisations, hospital occupancy and deaths is still uncertain. We estimate that daily infections may be between 400 and 35,000 in mid-March. This includes the impact of the interventions announced on 14th and 21st December; those announced as being lifted from 17th, 24th and 31st January; and booster take up.
- Modelled rates of positive tests per 100K using data to 14th February indicate that, for the week commencing 27th February 2022, all 30 of the local authorities included are expected to exceed 50 cases per 100K with at least 75% probability.
- 28 local authorities are expected to exceed 100 cases per 100K and 15 are expected to exceed 300 cases per 100K, with at least 75% probability.
- Five local authorities are expected to exceed 500 cases per 100K, with at least 75% probability. These are Glasgow, North Lanarkshire, Renfrewshire, Stirling and West Dunbartonshire.
- Analysis by the Edinburgh University Roslin Institute indicates that there remains a substantial variation in risk of infection by age.
- The distribution of lateral flow/LFD tests being reported varies substantially by both age and deprivation status, with many fewer tests reported in younger adults across all deciles of deprivation, and for children in more deprived deciles. The high level of LFD positivity in the latter category is marked, and when compared to the high number of positives amongst the least deprived, suggests this may reflect under ascertainment.
- Nationwide, wastewater (WW) Covid-19 levels have shown an upturn, with the week ending on 14th February recording levels of 88 million gene copies per person per day (Mgc/p/d), up from 51 Mgc/p/d the previous week (ending 7th February). This moderate increase in wastewater viral levels is observed across many of the local authorities in Scotland.
- Modelling of long Covid estimates that on 6th March 2022 between 1.1% and 2.9% of the population are projected to self-classify with long Covid for 12 weeks or more after their first confirmed (or suspected) Covid infection in Scotland. The limits of the projection of the proportion of the population with long Covid are unchanged from last week.
Recent cases
Figure 1 shows the number of Covid-19 cases (from either PCR or LFD) in Scotland between January and February 2022. The vertical dashed lines indicate the cut off points for each of the modelling inputs; after these dates, the number of cases is not incorporated into the outputs.
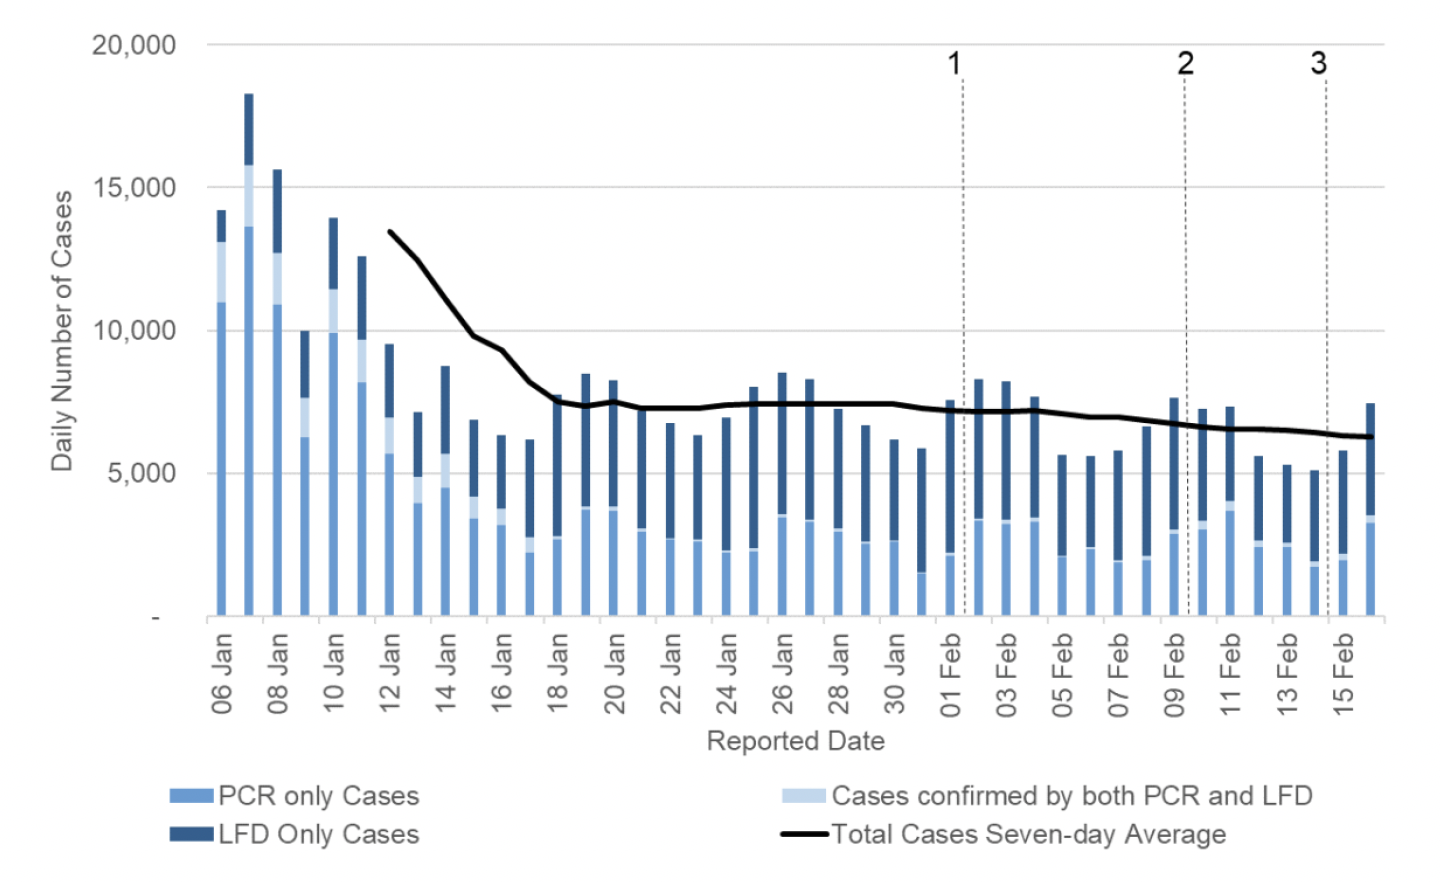
R, growth rate and incidence are as of 1st February 2022 (dashed line 1). The Scottish Contact Survey uses data to 9th February 2022 (dashed line 2). The Scottish Government modelling of infections, the long Covid analysis, the modelled rates of positive tests per 100K and the wastewater analysis use data to 14th February (dashed line 3).
Overview of Scottish Government Modelling
Modelling outputs are provided here on the current epidemic in Scotland as a whole, based on a range of methods. Because it takes a little over three weeks on average for a person who catches Covid-19 to show symptoms, become sick, and either die or recover, there is a time lag in what our model can tell us about any change in the epidemic.
This week the Scottish Government presented one output to EMRG.
This used the number of positive LFD or PCR tests. This output is included in Figures 2 and 3.
The R value and growth rates are estimated by several independent modelling groups based in universities and the UKHSA. Estimates are considered, discussed and combined at the Epidemiology Modelling Review Group (EMRG), which sits within the UKHSA. These are based on data to 14th February.
UKHSA's consensus view across these methods was that the value of R in Scotland[2] is between 0.8 and 1.0, as of 1st February 2022[3] (Figure 2). R is an indicator that lags by two to three weeks.
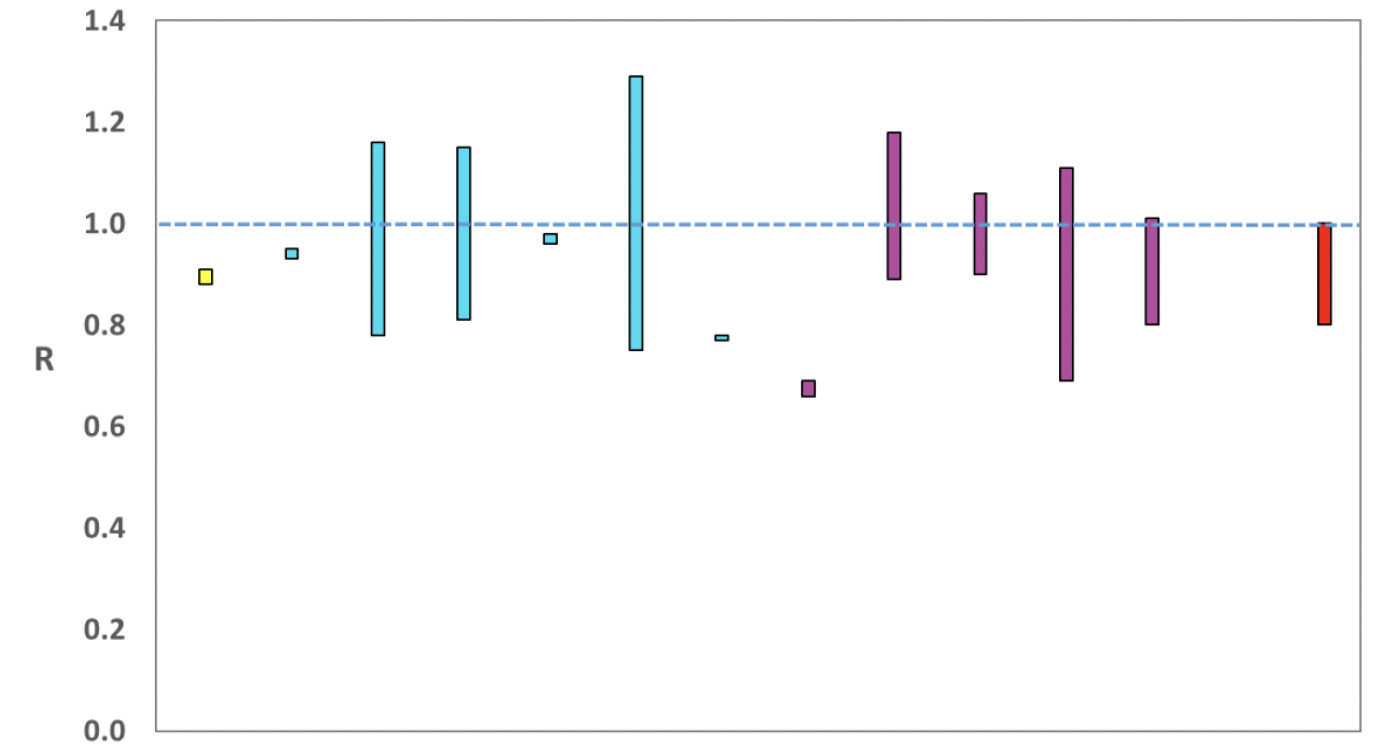
Source: EMRG
The various groups which report to the EMRG use different sources of data in their models to produce estimates of incidence (Figure 3). UKHSA's consensus view across these methods, as at 1st February, was that the incidence of new daily infections in Scotland was between 204 and 377 new infections per 100,000. This equates to between 11,200 and 20,600 people becoming infected each day in Scotland.
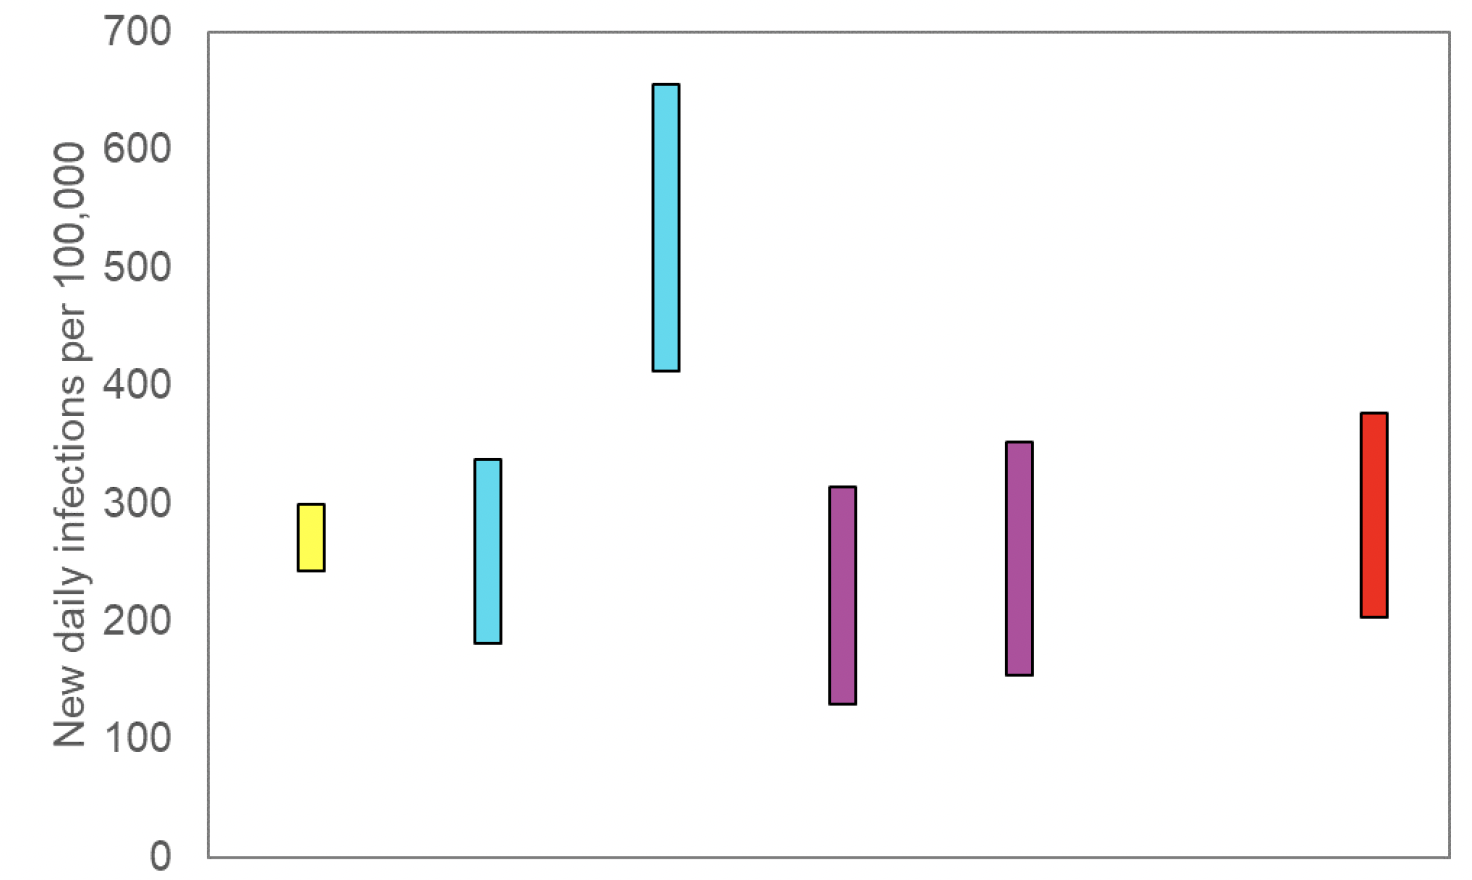
Source: EMRG
The consensus from UKHSA for this week is that the growth rate in Scotland is between -3% and 1% per day as at 1st February. The lower and upper limits have increased since last week.
What we know about how people's contact patterns have changed
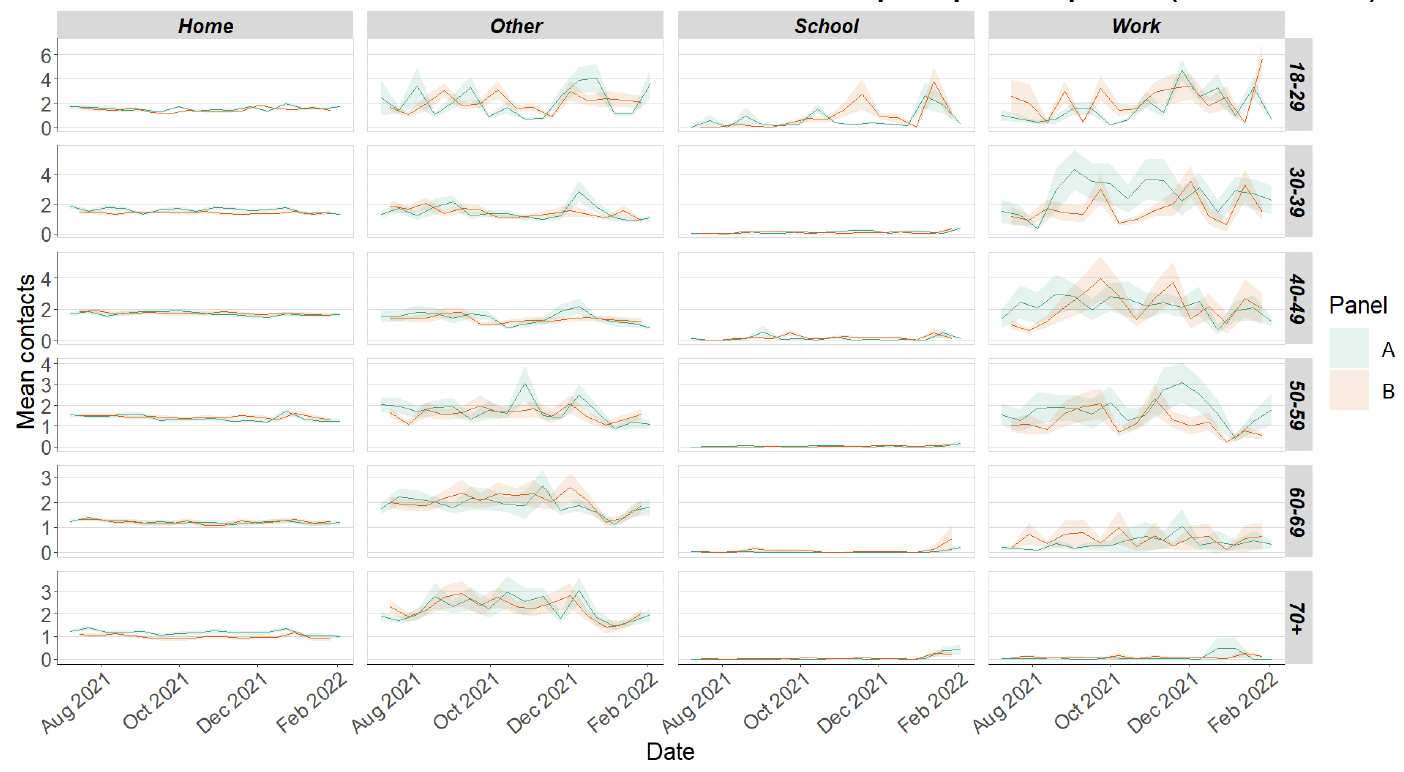
Average contacts from the most recent Panel A cohort of the Scottish Contact Survey (week ending 9th February) indicate an average of 4.4 contacts. This has decreased by 7% compared to the previous Panel A of the survey (week ending 26th January), as seen in Figure 4. Mean contacts have decreased within the work setting by 37%, while contacts within the other setting (contacts outside home, school and work) have increased by 40%. Contacts within the home have remained at a similar level over the same period.
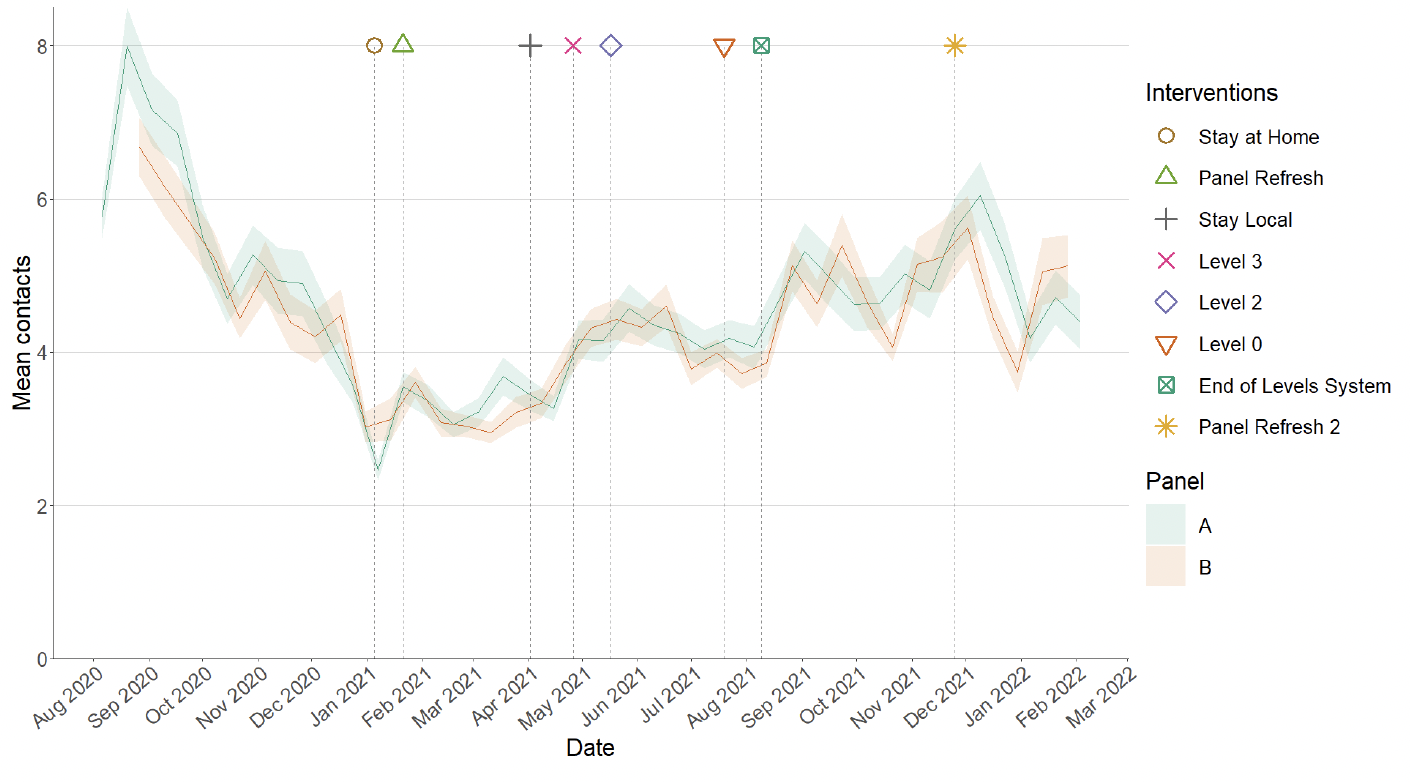
Figure 5 shows how contacts change across age group and setting. Individuals aged under 50 have reported a decrease in contacts in the last two weeks whereas those 50 and over have reported an increase. Increases were largely driven by contacts within the work setting for those in the 50 - 59 age group, with individuals aged 60 and over reporting a rise in contacts within the other setting.
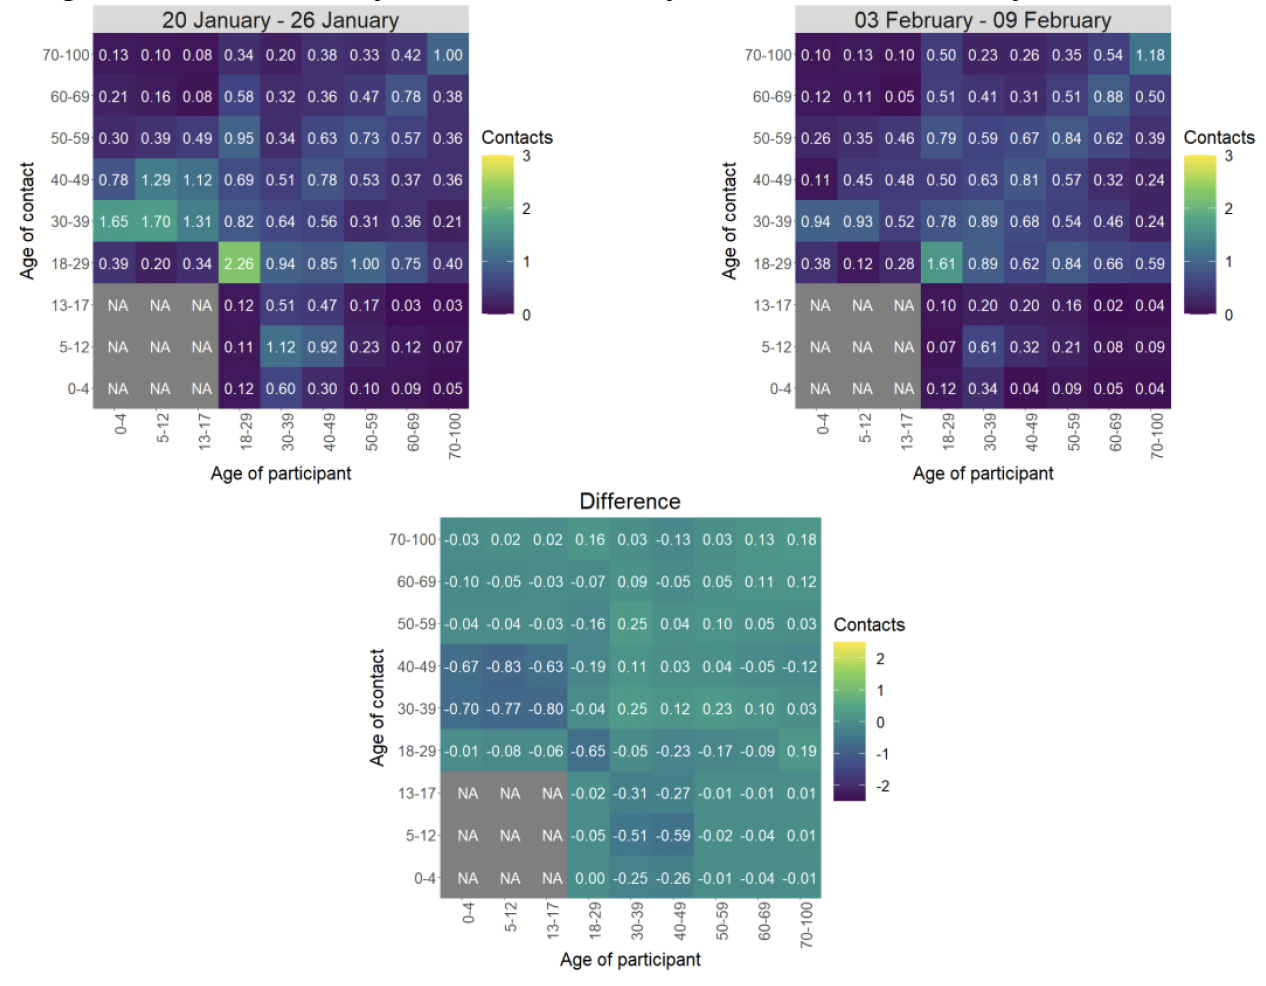
The heatmaps in Figure 6 show the mean overall contacts between age groups for the weeks relating to 20th January - 26th January and 3rd February - 9th February and the difference between these periods. The biggest decrease in interactions between age groups is between those aged 30-49 with individuals under 18.
The biggest changes in the proportion of participants visiting different locations is seen in those visiting a pub or restaurant and individuals visiting an essential shop. Visits to a pub or restaurant have shown the biggest increase, increasing from approximately 38% to 45% while visits to an essential shop have shown the biggest decrease, decreasing from 87% to 85% in the last two weeks as shown in Figure 7.
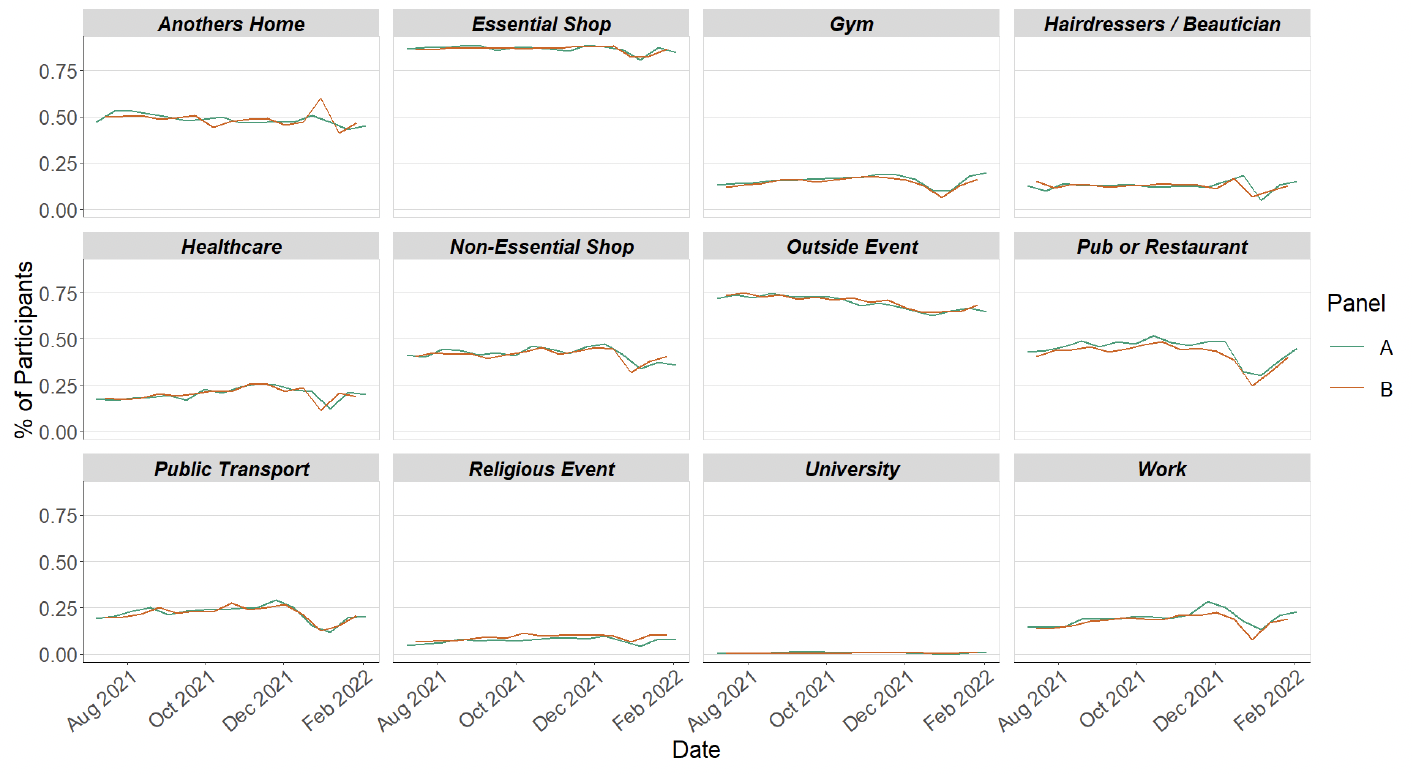
Figure 8 shows the number of people wearing a face covering where they have at least one contact outside of the home. This has increased in the last two weeks from 81% to 85%.
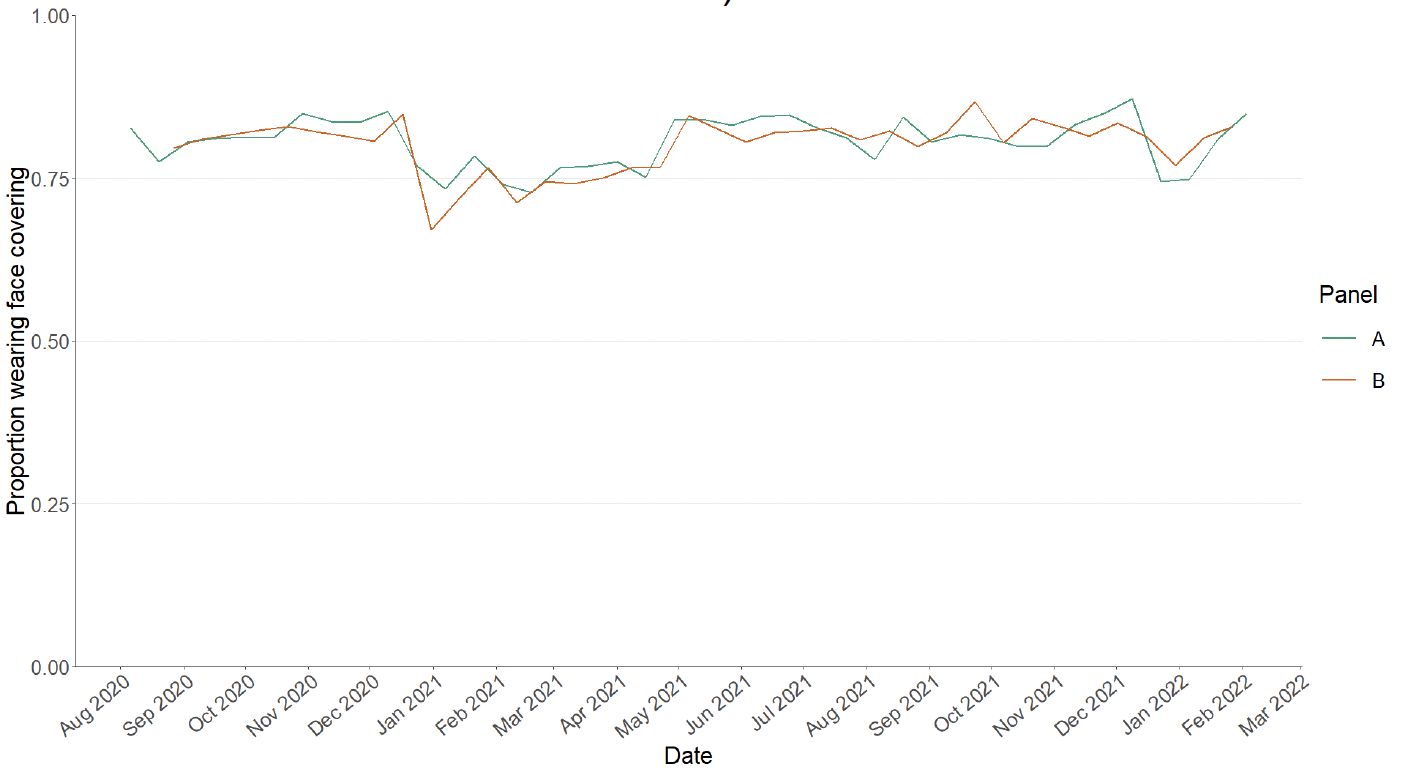
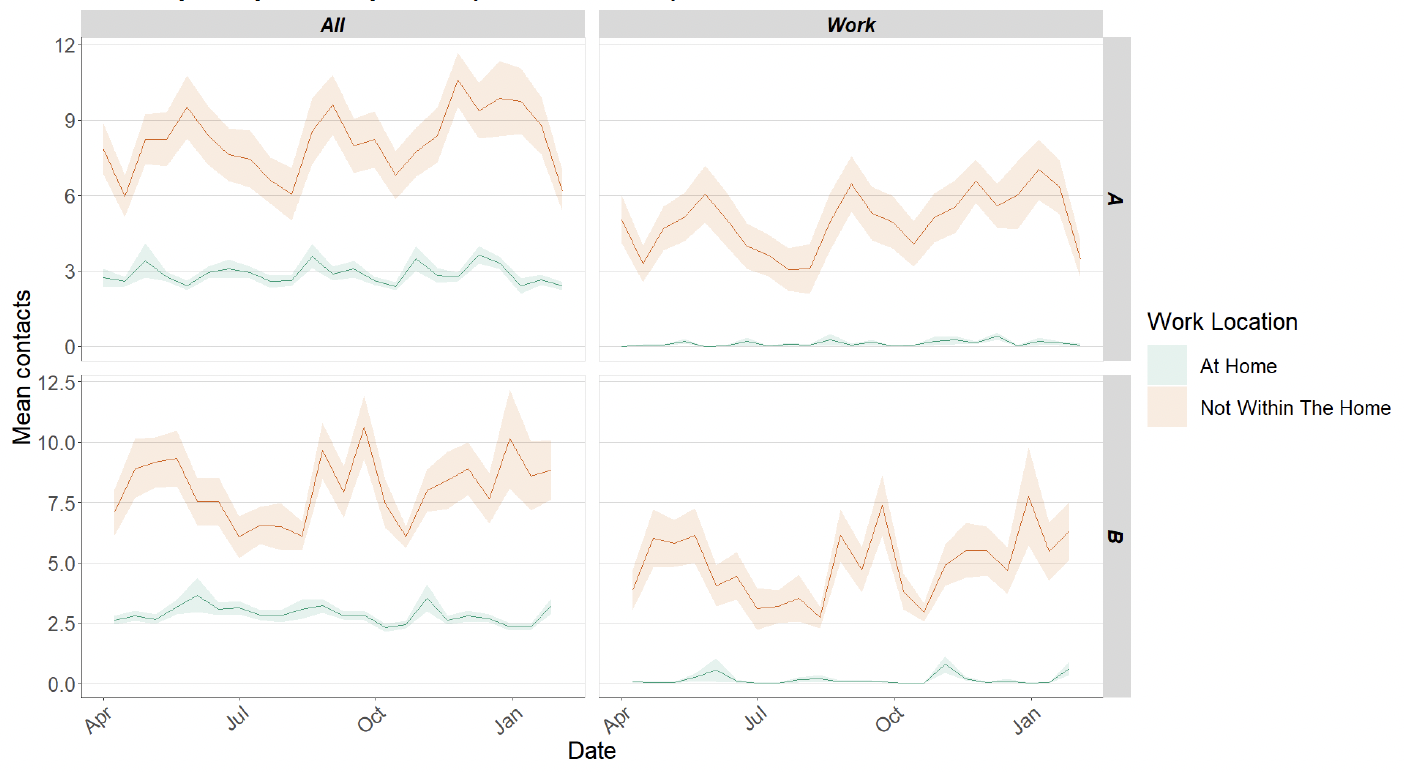
Figure 9 shows the difference in overall and work contacts between those who work from home compared to those who have a workplace outside of the home. This shows that those who do not work from home have higher and more variable contacts than those who work from home. This also shows that contacts within the work place make up the majority of overall contacts for those who do not work at home, therefore changes in work contacts has a proportionate impact on overall contacts.
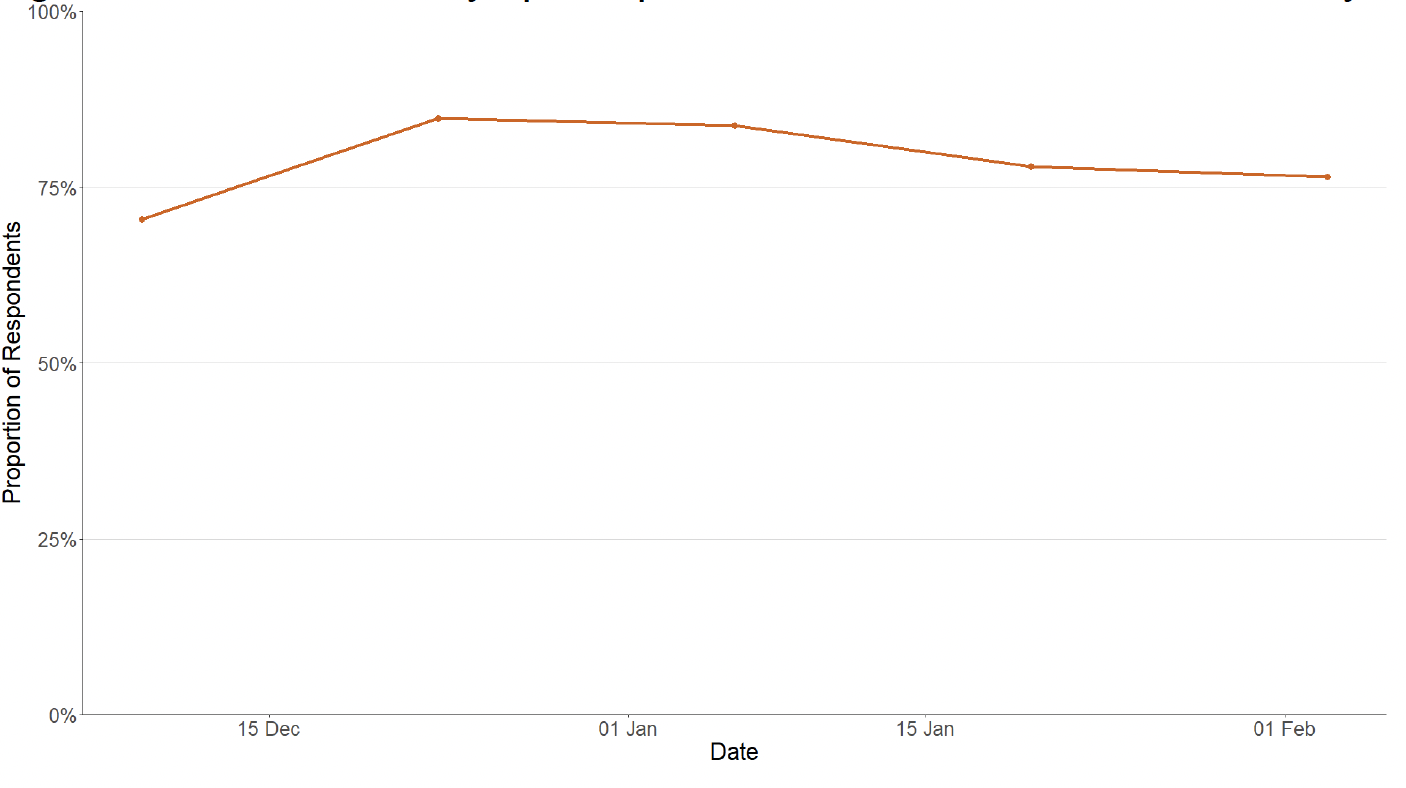
Approximately 76% of individuals had taken at least one lateral flow test within the last 7 days for the survey pertaining to the 3rd February - 9th February, decreasing from 78% two weeks prior as shown in Figure 10.
What the modelling tells us about estimated infections
The Scottish Government assesses the impact of Covid-19 on the NHS in the next few weeks. Figures 11 - 13 show projections over four weeks for combined Delta and Omicron infections.
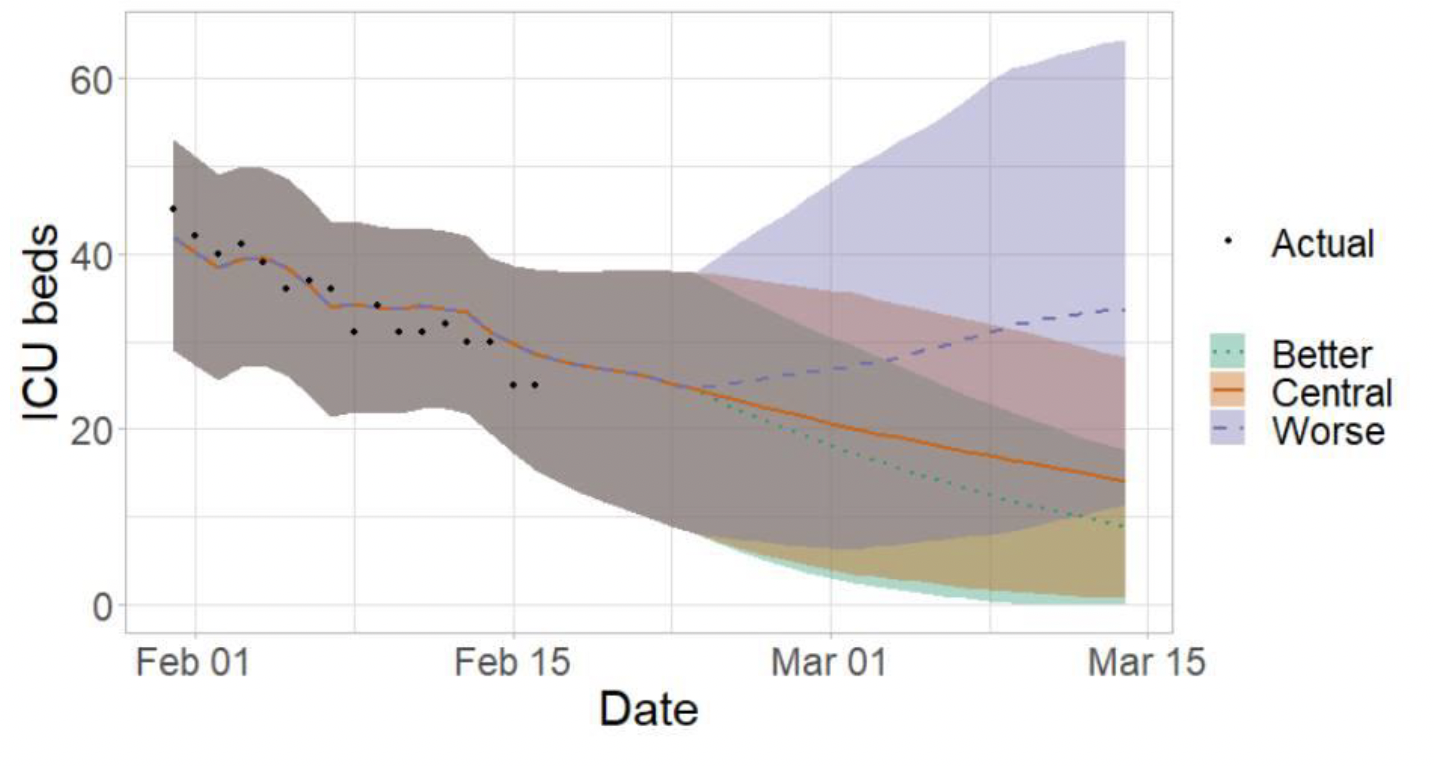
These projections include the effect of the interventions announced on 14th and 21st December 2021; those announced as being lifted from 17th, 24th and 31st January 2022; and booster take up. 'Central' assumes that transmissibility remains at current levels. 'Worse' assumes a higher transmissibility, whereas 'Better' assumes a lower transmissibility[5].
The future trajectory of infections is uncertain.
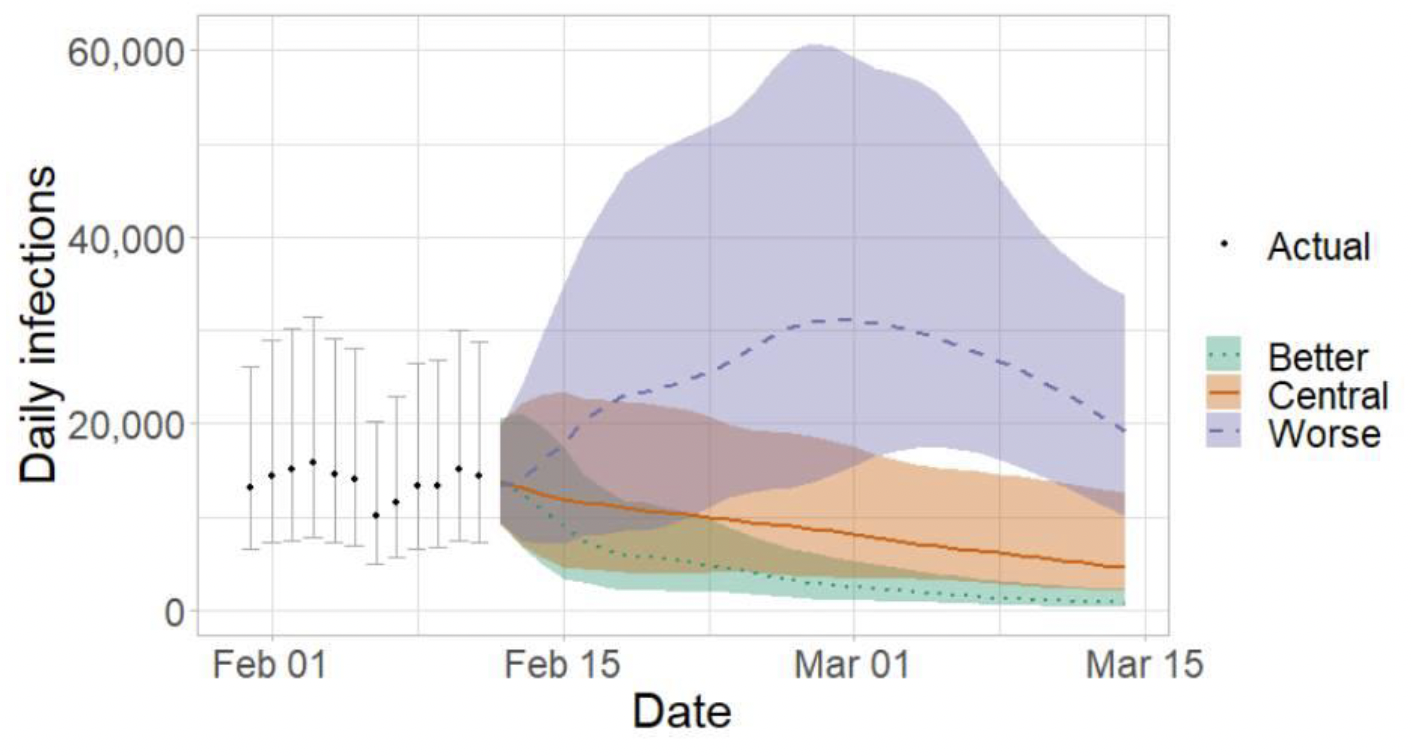
We estimate that daily infections may be between 400 and 35,000 in mid-March.
Figure 12 shows the impact of the projections on the number of people in hospital. The modelling includes all hospital stays, whereas the actuals only include stays up to 28 days duration that are linked to Covid-19.
There continues to be uncertainty over hospital occupancy and intensive care in the next four weeks.
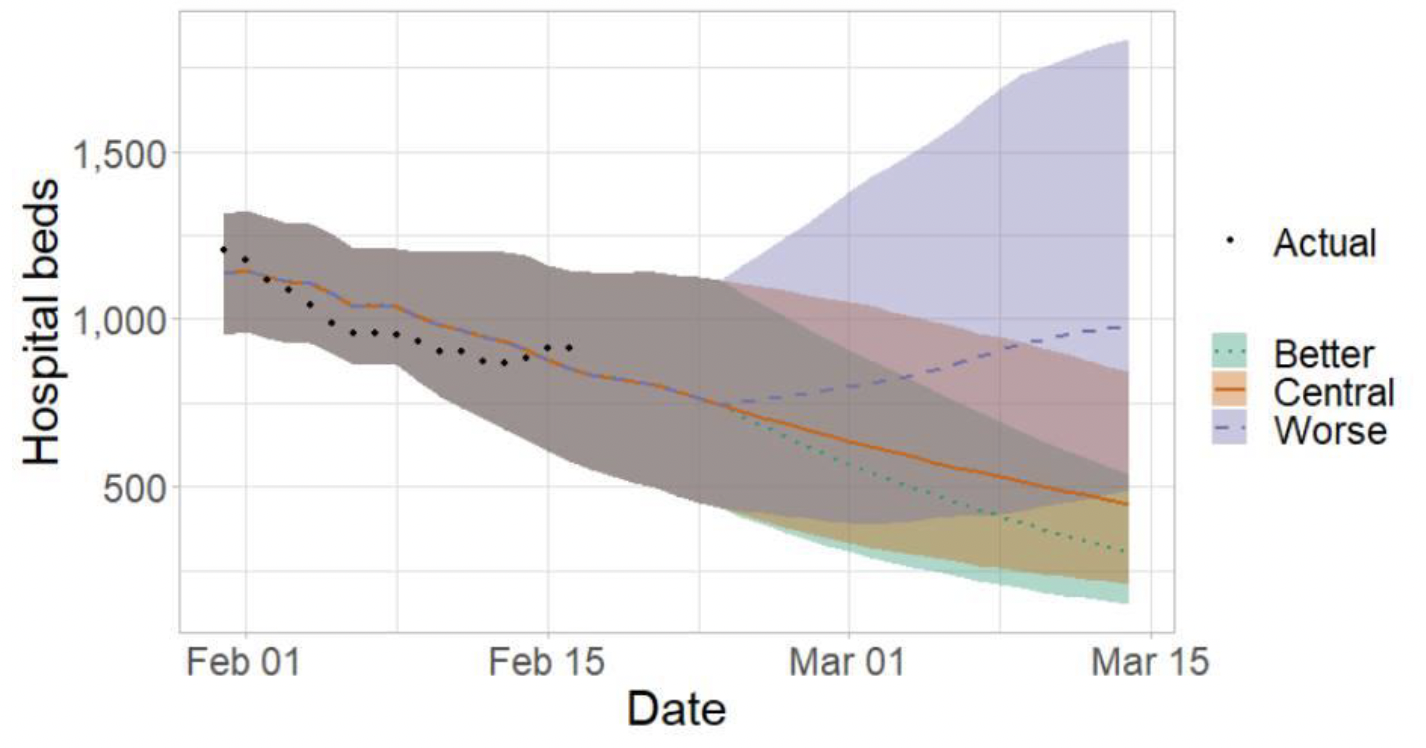
Figure 13 shows the impact of the projection on ICU bed demand.
What the modelling tells us about projections of hospitalisations, occupancy and deaths in the medium term
SPI-M-O produces projections of the epidemic (Figures 14 - 16), combining estimates from several independent models. These projections are not forecasts or predictions. They represent a scenario in which the trajectory of the epidemic continues to follow the trends that were seen in the data available to 14th February and do not include the effects of any future policy or behavioural changes.
The delay between infection, developing symptoms, the need for hospital care, and death means they cannot fully reflect the impact of behaviour changes in the two to three weeks prior to 14th February.
The projections include the potential impact of vaccinations over the next few weeks. Modelling groups have used their expert judgement and evidence from UKHSA, Scottish Universities & Public Health Scotland, and other published efficacy studies when making assumptions about vaccine effectiveness.
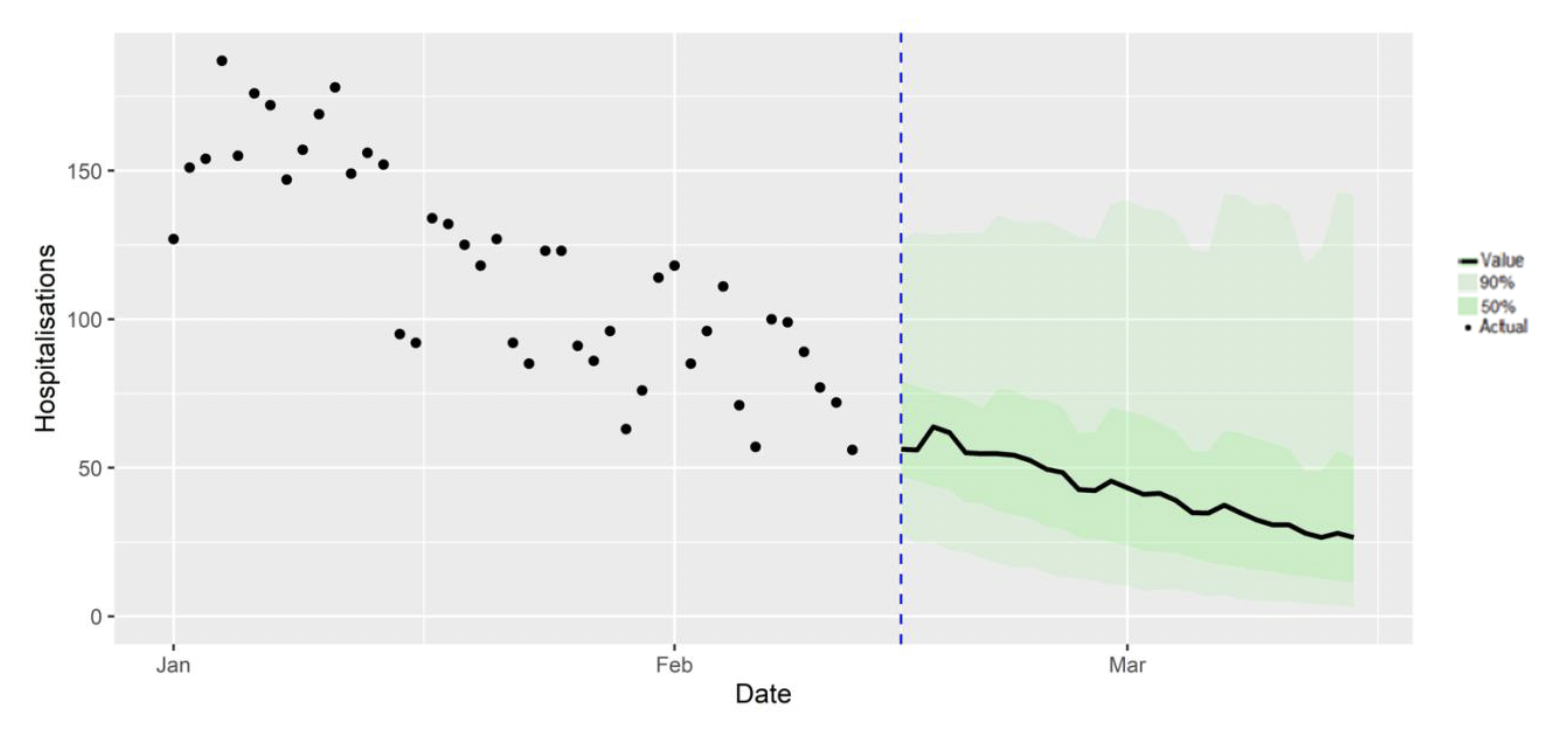
Figure 15 shows the SPI-M-O consensus on hospital occupancy. Hospital occupancy is determined by the combination of admissions and length of stay, the latter of which is difficult to model with confidence.
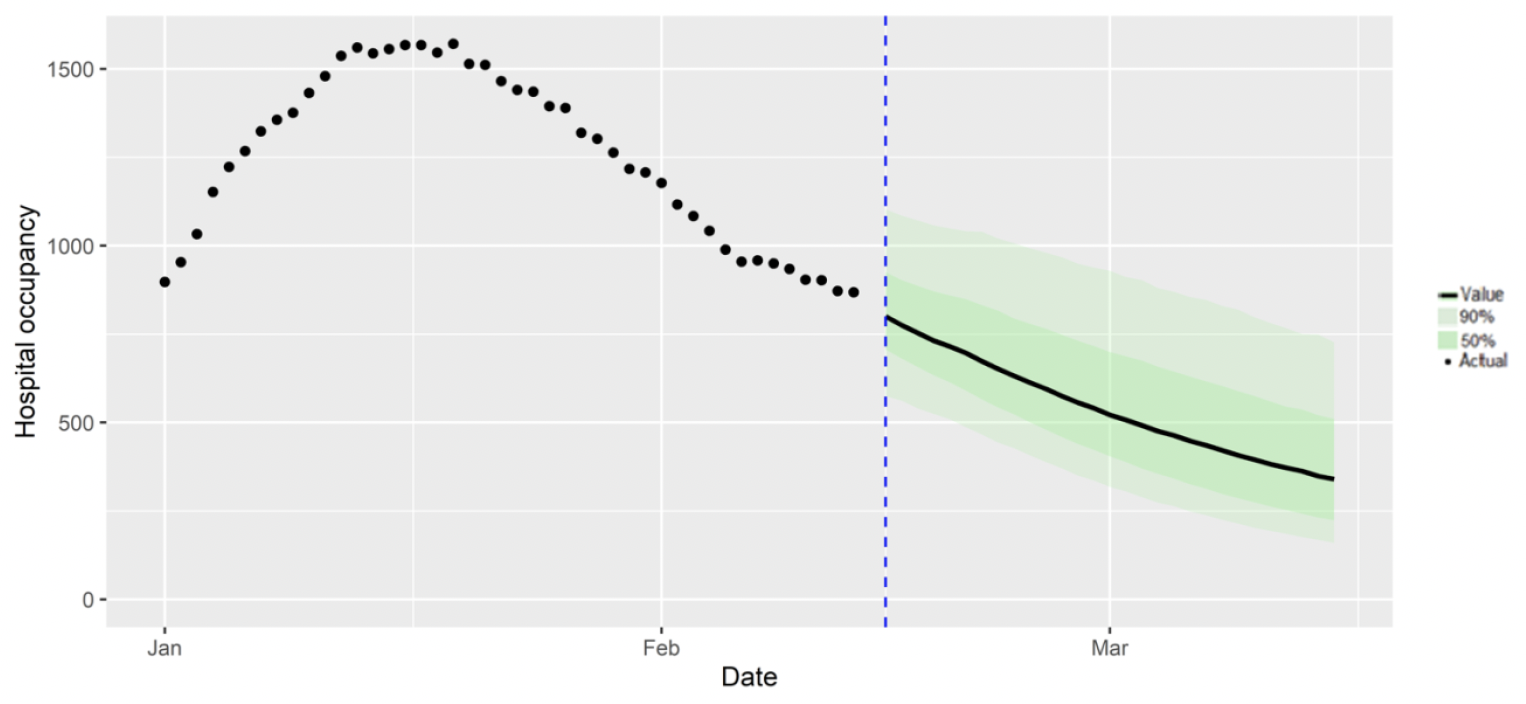
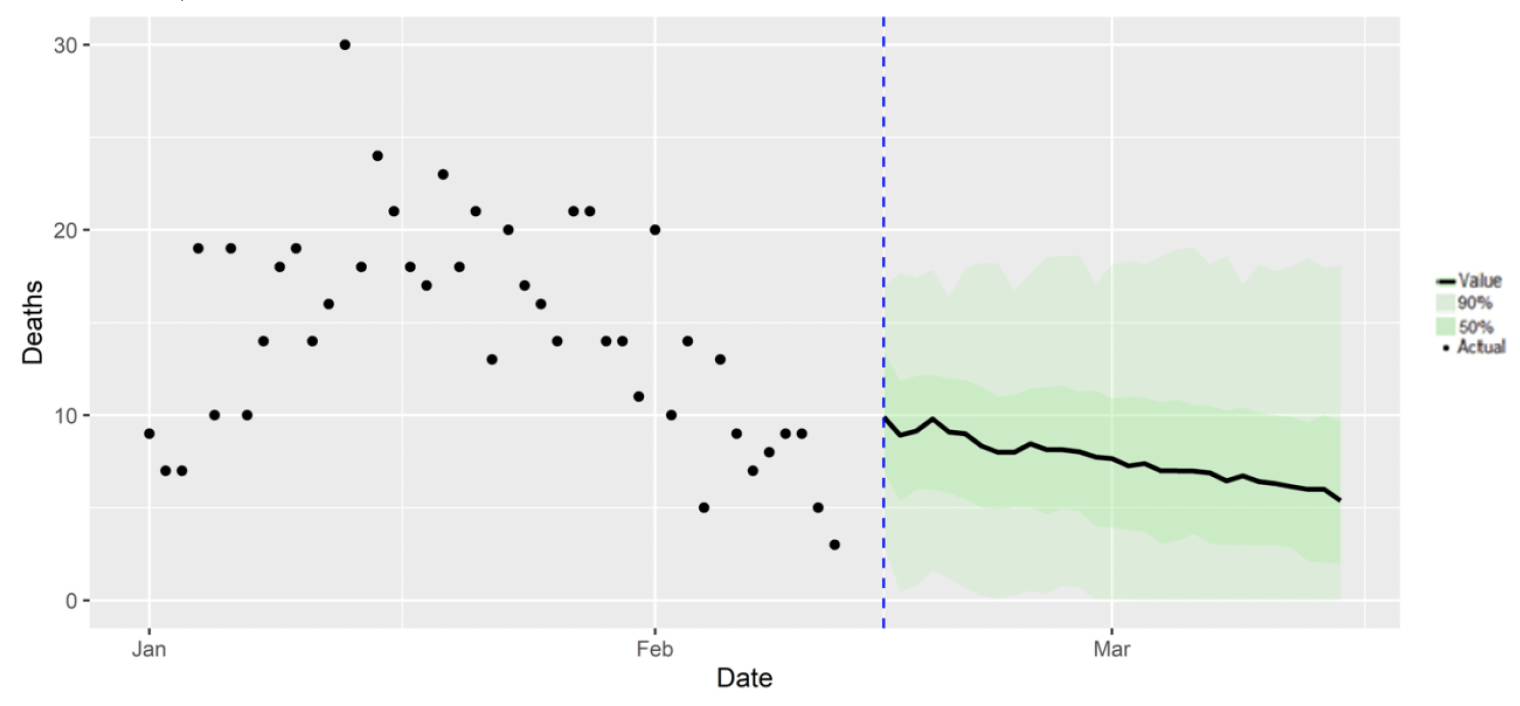
Figure 16 shows the SPI-M-O consensus on daily Covid-19 deaths.
What we know about which local authorities are likely to experience high levels of Covid-19 in two weeks' time
We continue to use modelling based on Covid-19 cases and deaths using data to 14th February 2022 from several academic groups to give us an indication of whether a local authority is likely to experience elevated levels of Covid-19 in the future. This has not been compiled via UKHSA into a consensus this week and is based on one modelling group due to issues with some of the models converging. In this an area is defined as a hotspot if the two-week prediction of cases (positive tests) per 100K population is predicted to exceed a threshold, e.g., 500 cases.
Some of the models contributing to this analysis are informed by both PCR and LFD positive tests whilst others are currently informed by PCR only. Due to inconsistent results from modelling, UKHSA has not been able to provide estimates for the Orkney or Shetland Islands this week.
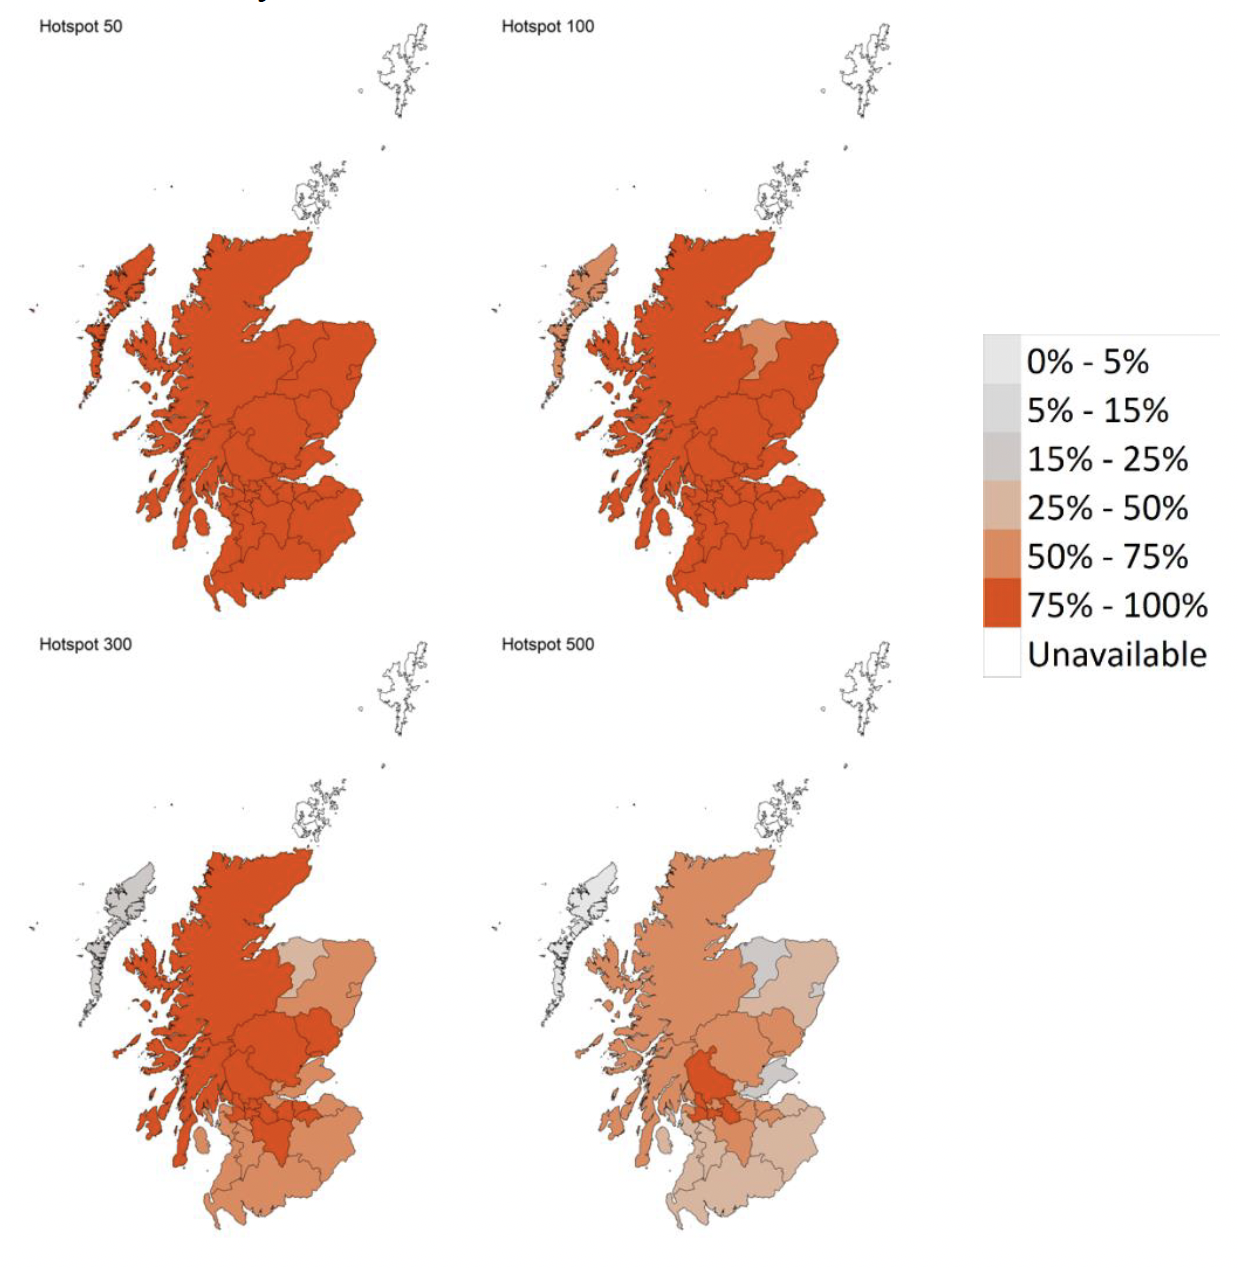
Modelled rates of positive tests per 100K using data to 14th February (Figure 17) indicate that, for the week commencing 27th February 2022, all 30 local authorities included are expected to exceed 50 cases per 100K with at least 75% probability.
28 of the 30 local authorities included are expected to exceed 100 cases per 100K, with at least 75% probability. The exceptions are Moray and Na h-Eileanan Siar.
15 local authorities are expected to exceed 300 cases per 100K, with at least 75% probability. These are Angus, Argyll & Bute, Edinburgh, Dundee, East Dunbartonshire, Glasgow, Highlands, Midlothian, North Lanarkshire, Perth & Kinross, Renfrewshire, South Lanarkshire, Stirling, West Dunbartonshire and West Lothian.
Five local authorities are expected to exceed 500 cases per 100K, with at least 75% probability. These are Glasgow, North Lanarkshire, Renfrewshire, Stirling and West Dunbartonshire.
Summary of spatial analysis of Covid-19 spread in Scotland
Researchers at the Edinburgh Roslin Institute have conducted spatial analysis of Covid-19 Spread in Scotland. A summary of findings from the week to 12th February 2022 is included here (the week to 10th February for the R-estimates, due to uncertainties in this estimate beyond this point).
In the week to 12th February, an S Gene Target Failure (SGTF) PCR result is assumed to be due to Omicron variant BA.1. In Scotland a test which is s-gene positive is taken to be a signature of Omicron variant BA.2, while acknowledging there may be some residual Delta variant cases contributing. To obtain estimates of the total spread of the two variants, the variant type is assigned in proportion to the observed SGTF results per day at the Local Authority level.
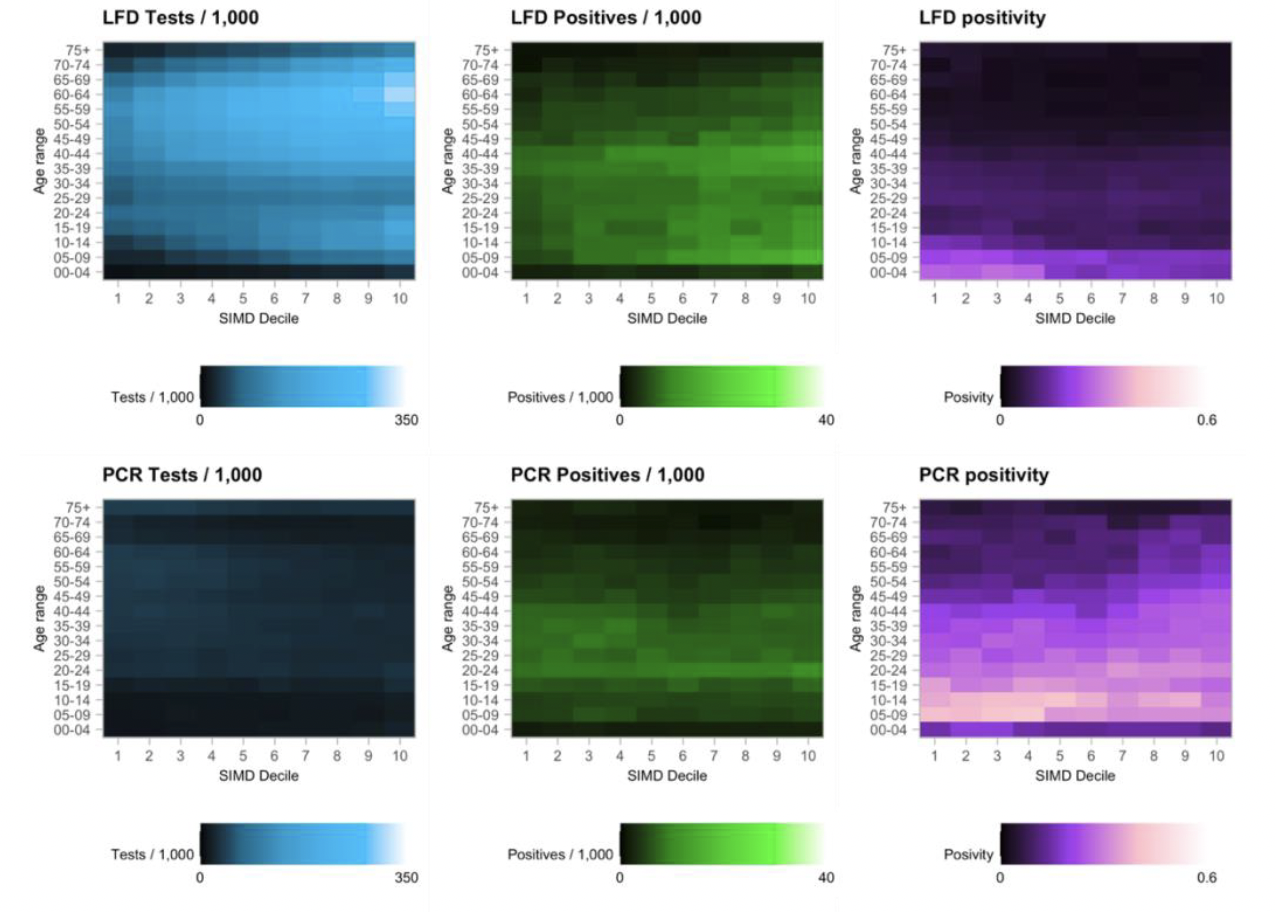
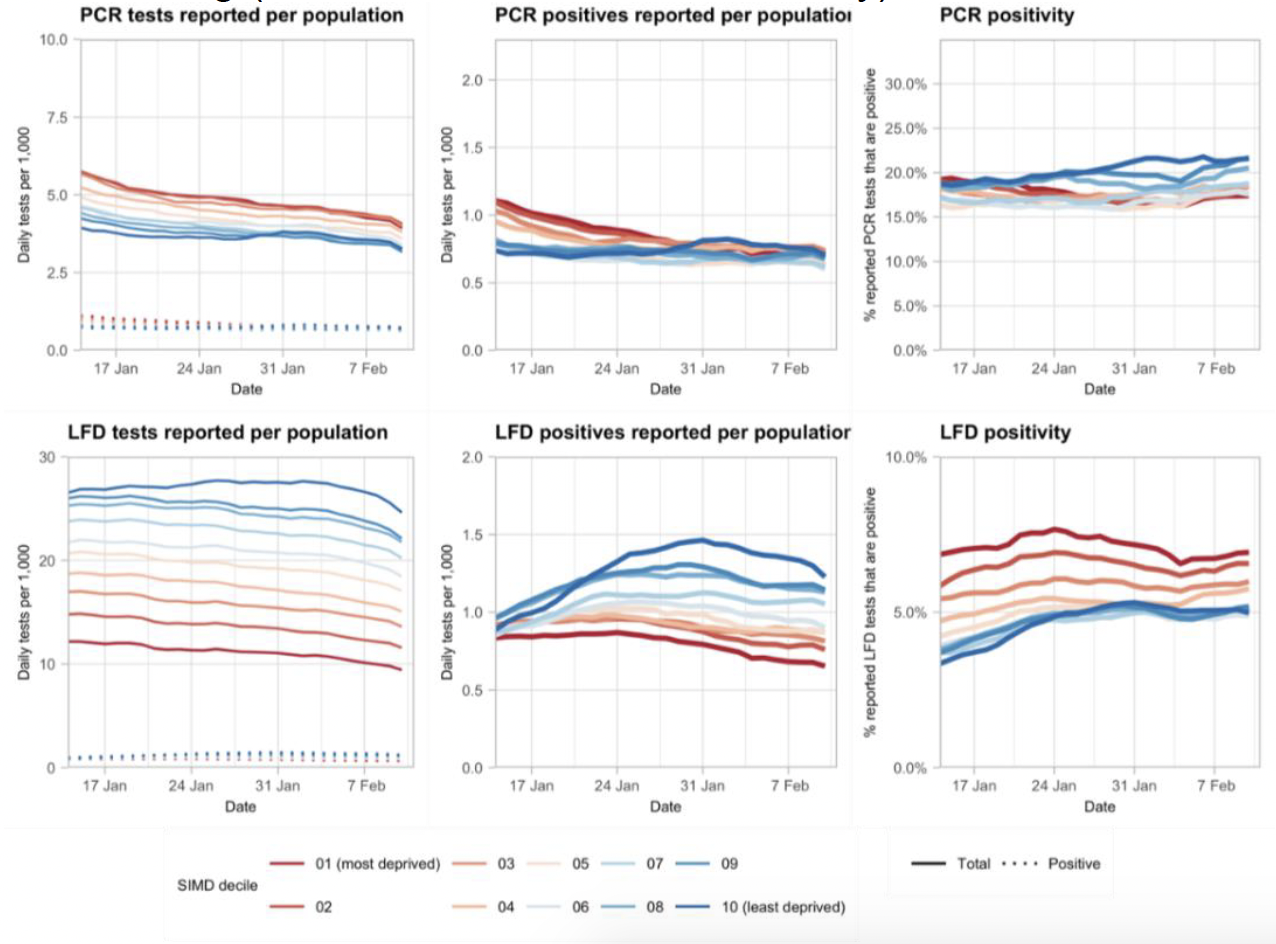
The modelling shows that the distribution of lateral flow/LFD tests being reported varies substantially by both age and deprivation status, with many fewer tests reported in younger adults across all deciles of deprivation, and for children in more deprived deciles. The high level of LFD positivity in the latter category is marked, and when compared to the high number of positives amongst the least deprived, suggests this may reflect under ascertainment.
The proportion of S-gene positive cases is now close to half of all recorded S-gene reports in some regions.
The R value remains stable across all local authorities when considering both S-gene positive and negative cases, but there has been a marked increase in R for S-gene positives in the past week, possibly reflecting increased spread of the BA.2 variant. The estimate of R for the last few days of the analysis should be viewed with caution, due to the effect of uncertain impact of partially observed infections caused for the most recent cases.
What can analysis of wastewater samples tell us about local outbreaks of Covid-19 infection?
Levels of Covid-19 RNA in wastewater (WW) collected at a number of sites around Scotland are adjusted for population and local changes in intake flow rate (or ammonia levels where flow is not available). See Technical Annex in Issue 34 of these Research Findings for the methodology.
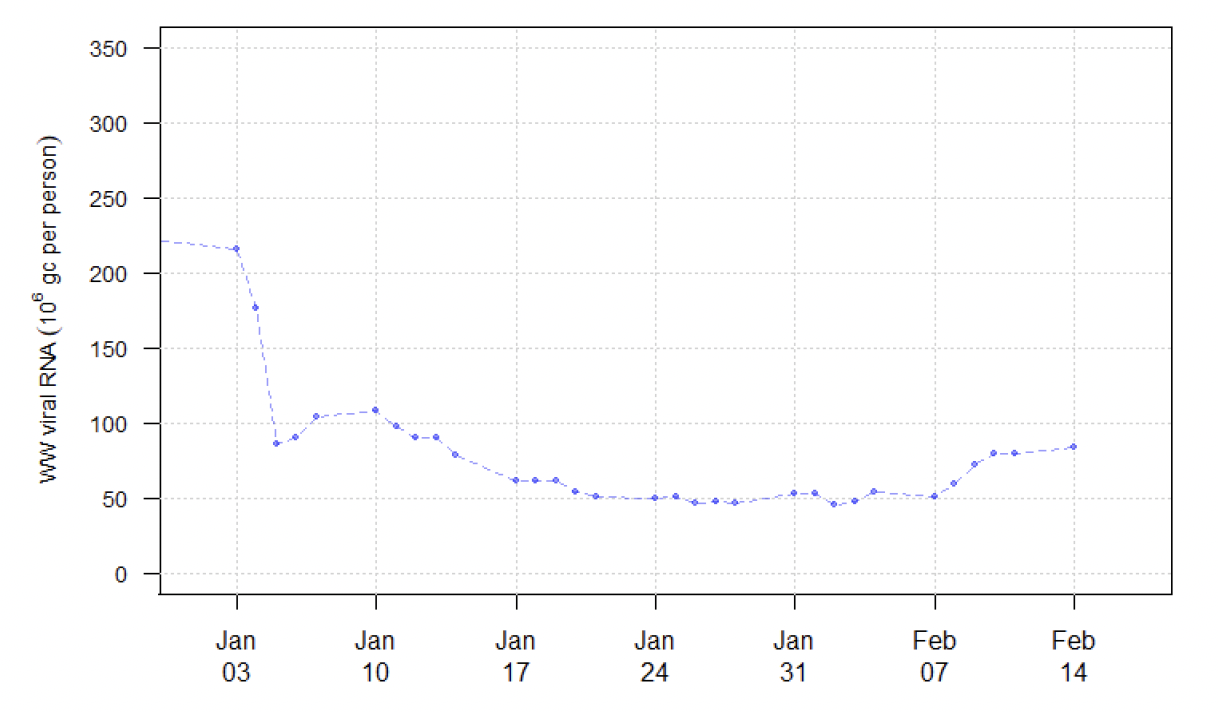
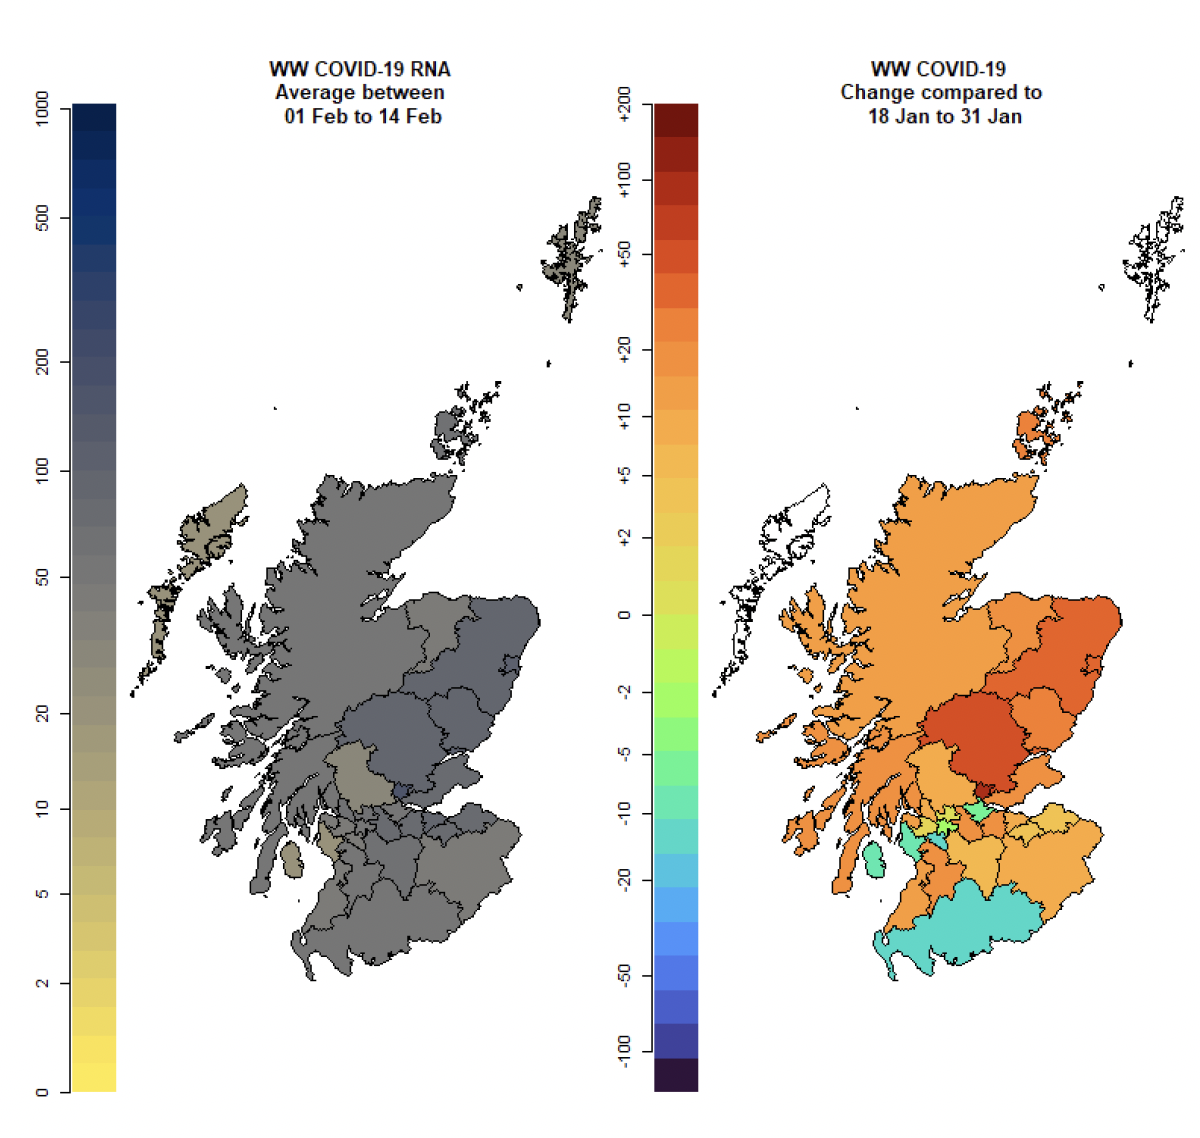
Nationwide, wastewater Covid-19 levels have shown an upturn, with the week ending on 14th February recording levels of 88 million gene copies per person per day (Mgc/p/d), up from 51 Mgc/p/d in the week ending 7th February. This moderate increase in wastewater viral levels is observed across many of the local authorities in Scotland.
In Figure 20, we restrict the plotting to the period after the end of 2021, at which point S-gene dropout testing data suggest that nearly all cases are from the Omicron variant. In this period WW testing should have a consistent relationship with Covid‑19 prevalence, assuming that the change in relationship is due to the new dominant variant and there is no shedding difference with the variant BA.2. In this more restricted graph, we see a flat trend in WW levels followed by a recent increase.
In Figure 21 we map levels of wastewater viral Covid-19 and its change over the last two weeks of data. This shows increases in wastewater viral levels across several regions in Scotland, compared to the second half of January.
What estimates do we have of the number of people experiencing long Covid symptoms?
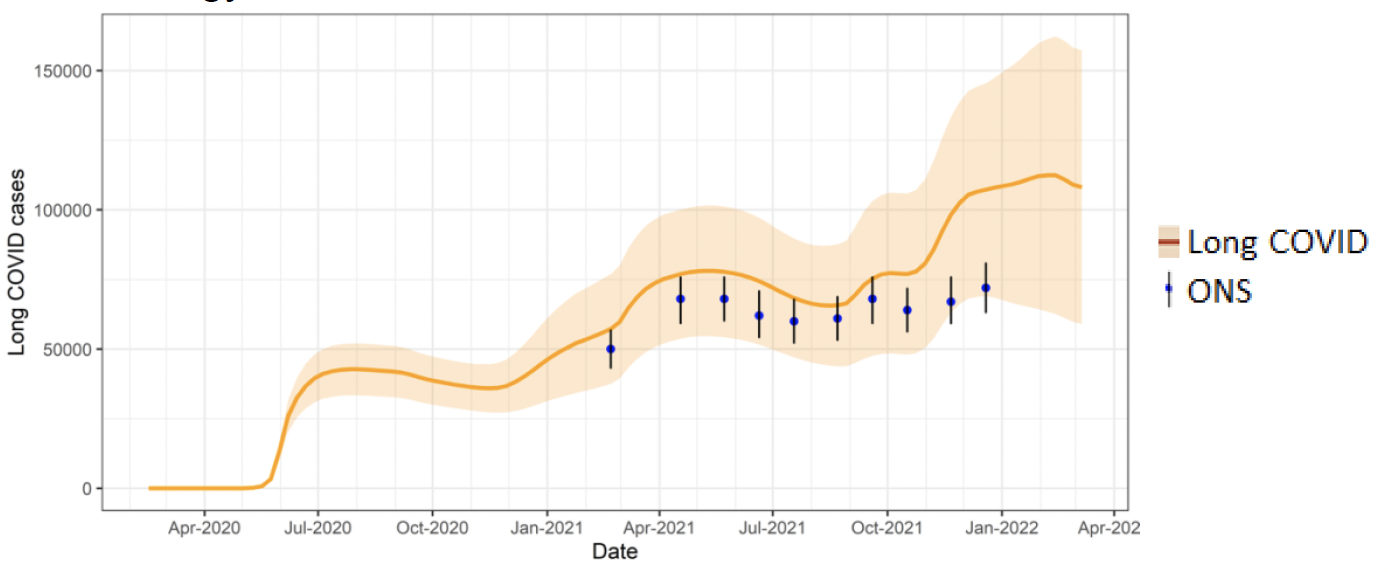
The Scottish Government is modelling the number of people likely to experience long Covid symptoms. This gives a projection of estimated self-reported long Covid rates in the future, based on Scottish Government medium term projection modelling, as set out in Figure 22.
This modelling estimates that at 6th March 2022 between 59,000 (1.1% of the population) and 157,000 (2.9%) people are projected to self-classify with long Covid for 12 weeks or more after their first suspected Covid infection in Scotland.
These are preliminary results, further data on rates of long Covid and associated syndromes as research emerges are required.
See the Technical Annex in issue 73 for information about the methodology.
See the Technical Annex in issue 73 for information about the methodology.
What next?
Modelling will continue to look at the impact of Omicron, particularly the variant BA.2. The UKHSA Risk Assessment for BA.2 (9 Feb 2022) stated that there is moderate confidence that BA.2 has a growth advantage compared to BA.1, from data reported by multiple countries. As the year progresses we will incorporate different models as and when it is appropriate to do so.