Coronavirus (COVID-19): modelling the epidemic (issue no.83)
Latest findings in modelling the COVID-19 epidemic in Scotland, both in terms of the spread of the disease through the population (epidemiological modelling) and of the demands it will place on the system, for example in terms of health care requirement.
Coronavirus (COVID-19): modelling the epidemic in Scotland (Issue No. 83)
Background
This is a report on the Scottish Government modelling of the spread and level of Covid-19 in Scotland. This updates the previous publication on modelling of Covid-19 in Scotland published on 17th December 2021. The estimates in this document help the Scottish Government, the health service and the wider public sector plan and put into place what is needed to keep us safe and treat people who have the virus.
This edition of the research findings focuses on the epidemic as a whole, looking at estimates of R, growth rate and incidence as well as local measures of change in the epidemic. It looks at both the impact of the Delta and Omicron variants. We will update on a weekly basis as we know more about the Omicron variant.
This will be the last publication of 2021. We will publish our next research findings at the end of the week ending 7th January 2022.
Key Points
Based on at point when the Delta variant made up the majority of cases
- The reproduction rate R in Scotland is currently estimated as being between 1.0 and 1.3, as of 7th December. The lower and upper estimates have increased since last week.
- The number of new daily infections for Scotland is estimated as being between 124 and 159 as at 7th December, per 100,000 people.
- The growth rate for Scotland is currently estimated as between 0% and 4% as at 7th December. The lower and upper limits have increased since last week.
- Due to uncertainty surrounding the characteristics of the Omicron variant and its increasing prevalence across the UK, SPI-M-O has been unable to produce consensus medium-term projections for hospital admissions and deaths this week.
- Modelled rates of positive tests per 100K using data to 20th December indicate that, for the week commencing 2nd January 2022, 29 of the 32 local authorities are expected to exceed 50 cases per 100K with at least 75% probability. These 29 areas are also expected to exceed 100 cases per 100K with at least 75% probability. 23 local authorities are expected to exceed 500 cases per 100K with at least 75% probability.
- Modelling of long Covid estimates that on 9th January 2022 between 1.5% and 3.3% of the population are projected to self-classify with long Covid for 12 weeks or more after their first confirmed (or suspected) Covid infection in Scotland. The upper limit of the estimate of the proportion of the population with long Covid is slightly higher than last week.
Based on the Omicron variant
- Infections are rising and the number of infections are expected to continue to rise in the coming weeks as Omicron becomes more dominant. In three weeks' time we estimate that daily infections may be between 18,000 and 110,000 based on the effect of the new interventions announced on 14th and 21st December, and booster take up.
- Using data to 18th December, we estimate a doubling time for Scotland of between 2.60 – 2.71 days using S-gene target failure as a proxy for Omicron cases.
Other modelling
- Average contacts from the most recent Panel A cohort of the Scottish Contact Survey (week ending 15th December) indicate an average of 5.8 contacts.
- Mean contacts have increased within the work and other setting (contacts outside home, school and work) rising by 15% and 57% respectively. Contacts within the home have remained at a similar level over the same period.
- All age groups, with the exception of those aged 60-69, have increased their overall mean contacts. The biggest increase is within the 30-39 age group, more than doubling compared to two weeks prior. This is largely driven by contacts in the workplace.
- The highest interactions are reported between those under 18 with individuals within the 30-39 age group in the last two weeks.
- Visits to a hairdressers/beautician increased from approximately 12% to 15% and those using public transport decreased from 28% to 23% in the last two weeks.
- The youngest and oldest age groups (18-29 and 70+) have reported the lowest proportions of individuals who have taken one or more lateral flows, 64% and 56% respectively. In contrast, those aged between 30-69 report the highest proportion of individuals taking at least one lateral flow test within the last 7 days, with at least 73% taken at least one.
- Nationwide, wastewater Covid-19 RNA levels have shown an accelerated increase in the past week, increasing by 135%. The week ending 20th December saw levels of around 129 million gene copies per person per day (Mgc/p/d), up from around 55 Mgc/p/d in the previous week. This matches the recent rise in cases caused by the rapid spread of the Omicron variant.
Recent cases
Figure 1 shows the number of Covid-19 cases reported in Scotland between November and December 2021. The vertical dashed lines indicate the cut off points for each of the modelling inputs; after these dates, the number of cases is not incorporated into the outputs.
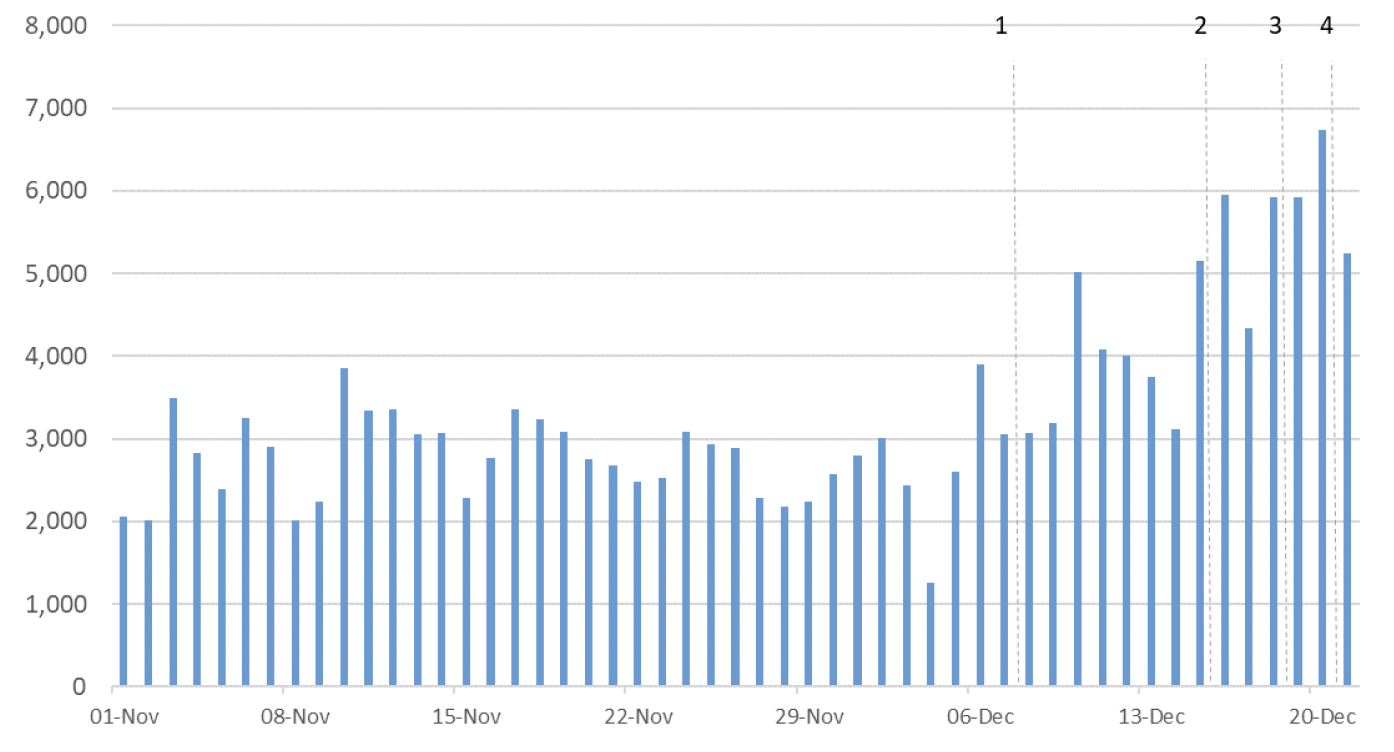
R, growth rate and incidence are as of 7th December (dashed line 1). The Scottish Contact Survey uses data to 15th December (dashed line 2). The Scottish Government modelling of infections, hospitalisations and ICU beds and the long Covid analysis use data to 18th December (dashed line 3). Wastewater analysis and the modelled rates of positive tests per 100K use data to 20th December (dashed line 4).
Figure 2 shows the number of confirmed Omicron cases and those cases that are under investigation. Note that data for 16th -18th December is lagged due to specimen processing times and these will be undercounted.
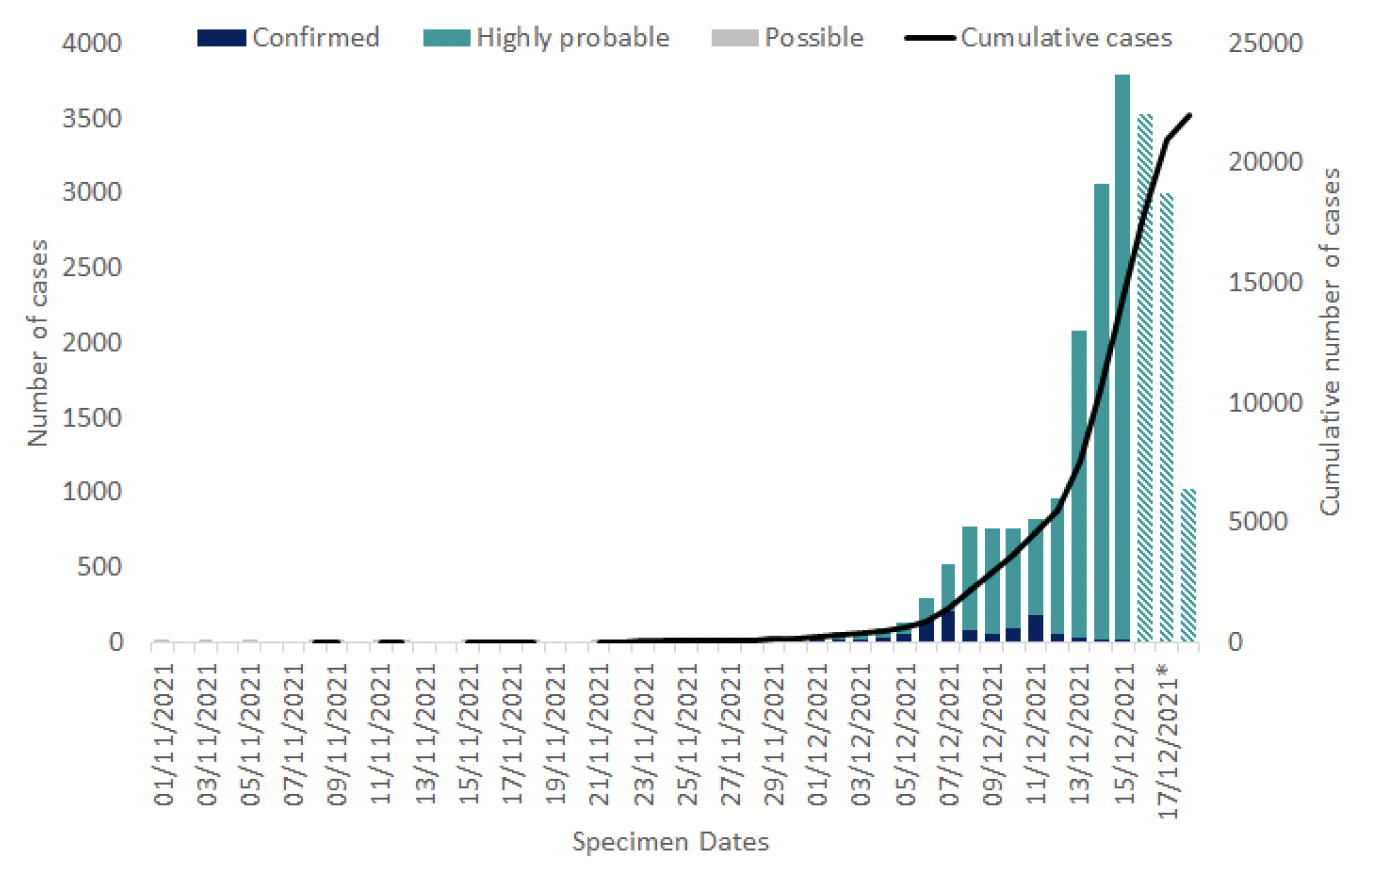
Source: Public Health Scotland COVID-19 & Winter Statistical Report
Overview of Scottish Government Modelling
Modelling outputs are provided here on the current epidemic in Scotland as a whole, based on a range of methods. Because it takes a little over three weeks on average for a person who catches Covid-19 to show symptoms, become sick, and either die or recover, there is a time lag in what our model can tell us about any change in the epidemic, e.g. any impact of the Omicron variant. Therefore a new section has been included covering what we know of this variant.
The first section of this report covers a range of modelling from a point when the Delta variant made up the majority of cases:
- The UK Health Security Agency (UKHSA) consensus is shown, which uses a range of data in its estimates of R and the growth rate.
The second section of this report covers Omicron:
- Looking at estimates of the doubling time of this variant, using the data available for Scotland.
- It also projects this forward into the future to estimate the proportion of Omicron cases in the coming weeks.
- The logistical model has been updated to incorporate both Delta and Omicron. The results are split down by age group, and the model is used to give a projection of the number of people that will be infected.
We also include in this report other modelling:
- The Scottish Contact Survey (SCS) is used to inform a modelling technique based on the number of contacts between people. Over time, a greater proportion of the population will be vaccinated. This is likely to impact contact patterns and will become a greater part of the analysis going forwards.
- We also report on levels of Covid-19 RNA in wastewater around Scotland and compare it to the 7-day average daily new cases.
What the modelling tells us about the epidemic at a point in time when Delta made up the majority of cases
The R value and growth rates are estimated by several independent modelling groups based in universities and the UKHSA. Estimates are considered, discussed and combined at the Epidemiology Modelling Review Group (EMRG), which sits within the UKHSA. These are based on data to 13th December.
UKHSA's consensus view across these methods, was that the value of R as at 7th December[2] in Scotland was between 1.0 and 1.3 (see Figure 3)[3].
R is an indicator that lags by two to three weeks and therefore should not be expected to fully reflect the increased prevalence of Omicron in the last week.
This week the Scottish Government presented two outputs to EMRG. The first uses confirmed cases, as published by Public Health Scotland (PHS), and deaths from National Records Scotland (NRS). The second uses instead wastewater data to estimate the number of cases, and deaths from NRS. Both outputs are shown in Figures 3 and 4.
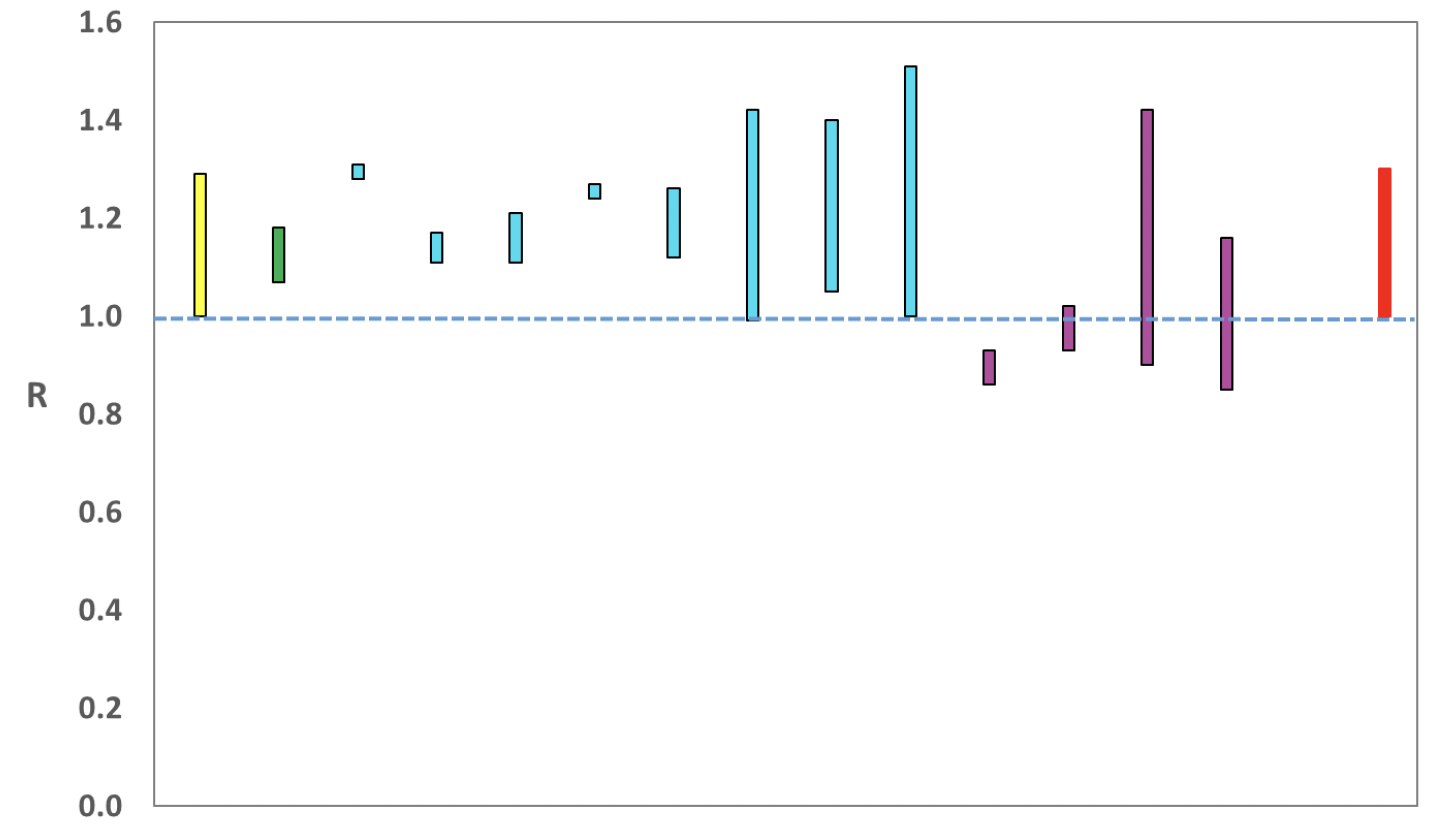
Source: EMRG
The various groups which report to the EMRG use different sources of data in their models to produce estimates of incidence (Figure 4). UKHSA's consensus view across these methods, as at 7th December, was that the incidence of new daily infections in Scotland was between 124 and 159 new infections per 100,000. This equates to between 6,800 and 8,700 people becoming infected each day in Scotland.
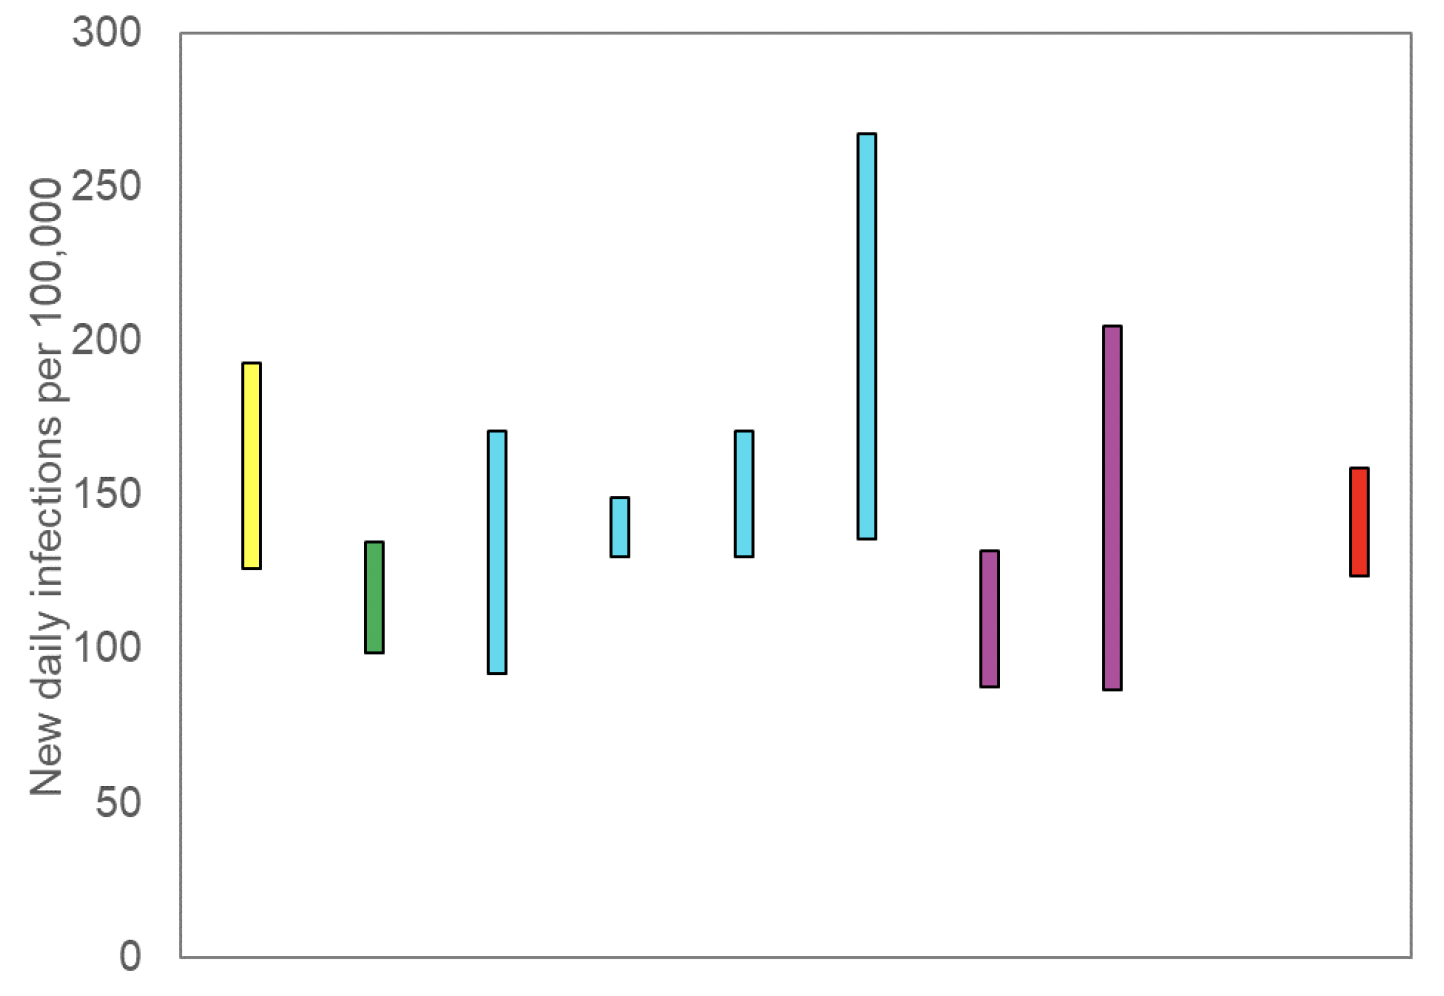
Source: EMRG
The consensus from UKHSA for this week is that the growth rate in Scotland is between 0% and 4% per day as at 7th December. The lower and upper limits have increased since last week.
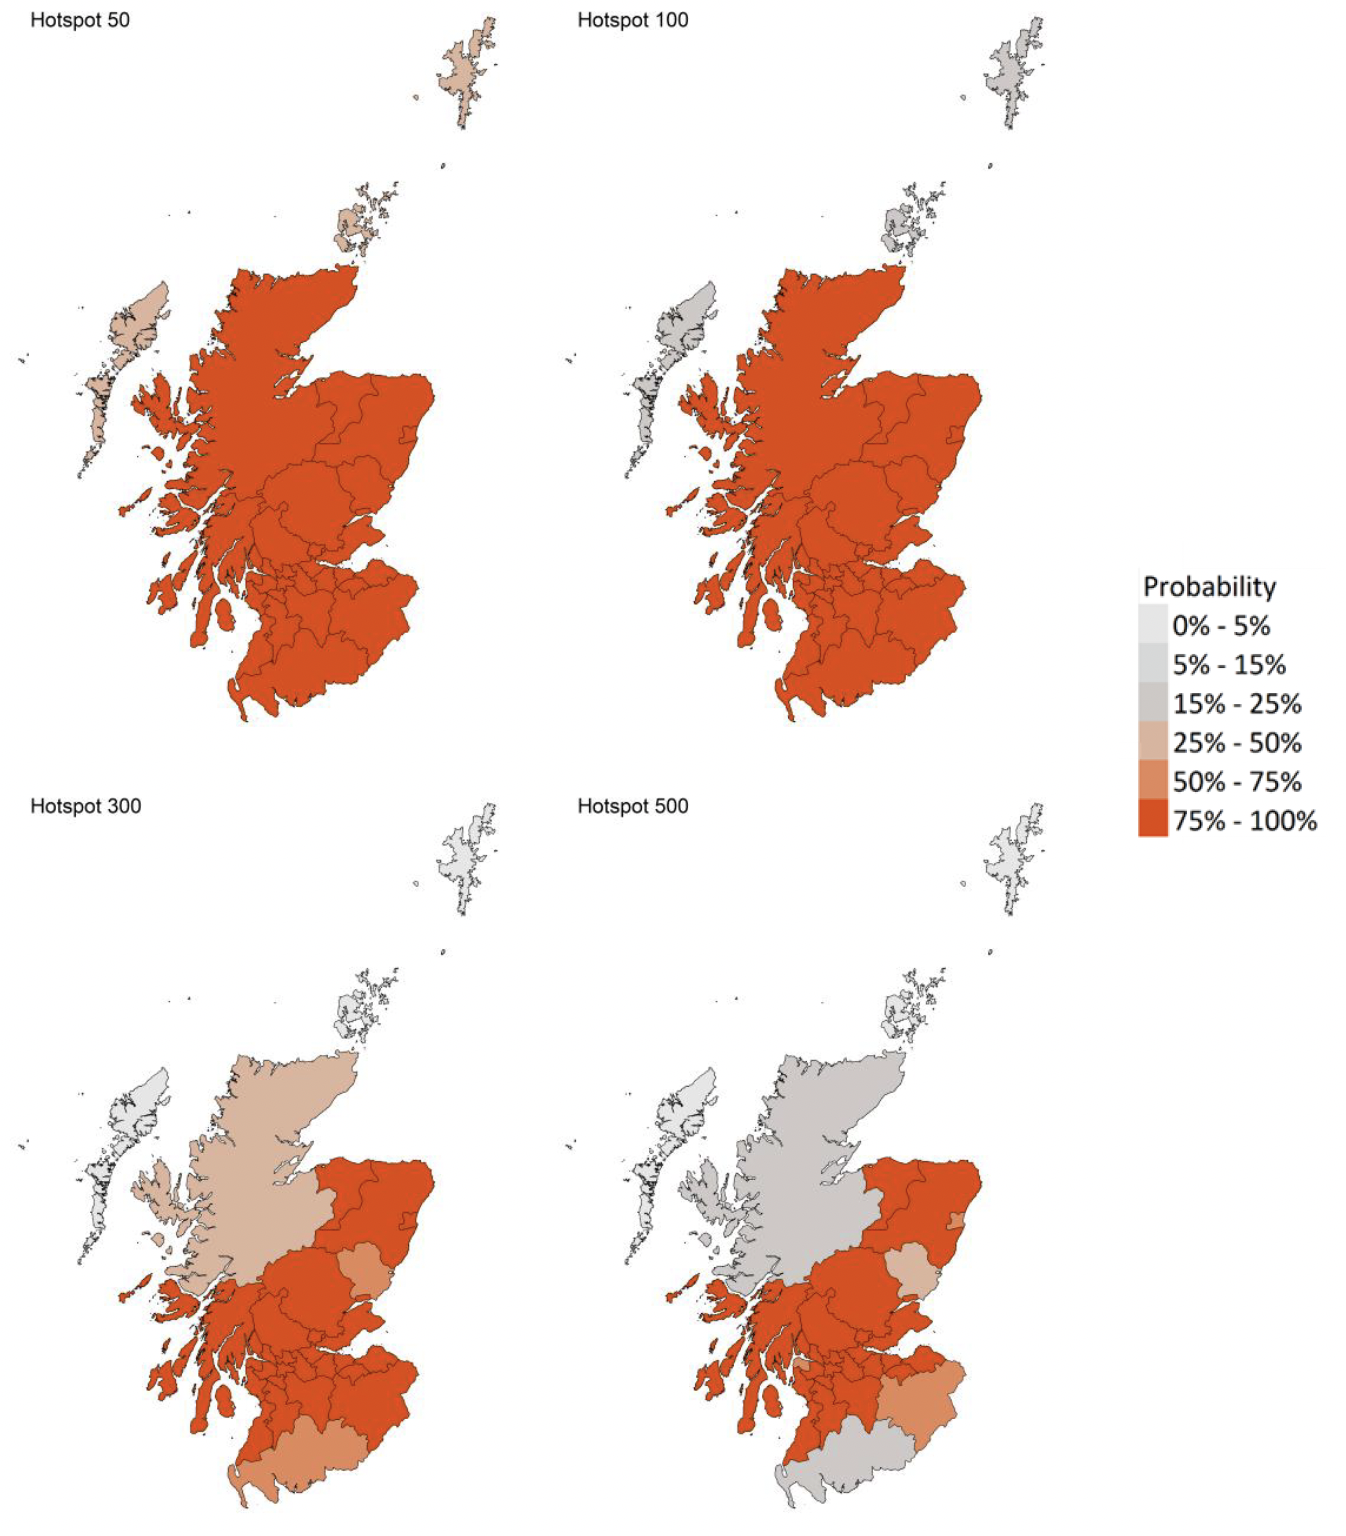
What we know about which local authorities are likely to experience high levels of Covid-19 in two weeks' time
We continue to use modelling based on Covid-19 cases and deaths using data to 20th December from several academic groups to give us an indication of whether a local authority is likely to experience high levels of Covid-19 in the future. This has not been compiled via UKHSA into a consensus and is based on one modelling group due to uncertainty around the Omicron variant. In this, an area is defined as a hotspot if the two week prediction of cases (positive tests) per 100K population is predicted to exceed a threshold, e.g. 500 cases.
Modelled rates of positive tests per 100K using data to 20th December (Figure 5) indicate that, for the week commencing 2nd January 2022, 29 of the 32 local authorities are expected to exceed 50 cases per 100K with at least 75% probability. The exceptions are Na h‑Eileanan Siar, Orkney Islands and Shetland. These 29 areas are also expected to exceed 100 cases per 100K with at least 75% probability.
23 local authorities are expected to exceed 500 cases per 100K with at least 75% probability. These are Aberdeenshire, Argyll & Bute, Edinburgh, Clackmannanshire, Dundee, East Ayrshire, East Dunbartonshire, East Lothian, East Renfrewshire, Falkirk, Fife, Glasgow, Midlothian, Moray, North Ayrshire, North Lanarkshire, Perth & Kinross, Renfrewshire, South Ayrshire, South Lanarkshire, Stirling, West Dunbartonshire and West Lothian.[5]
We are not able to provide data at higher threshold levels but it is likely that some local authorities may exceed 750 or 1000 cases per 100K.
What the modelling tells us about projections of hospitalisations and deaths in the medium term
Due to uncertainty surrounding the characteristics of the Omicron variant and its increasing prevalence across the UK, SPI-M-O has been unable to produce consensus medium-term projections for hospital admissions and deaths this week.
What estimates do we have of the number of people experiencing long Covid symptoms?
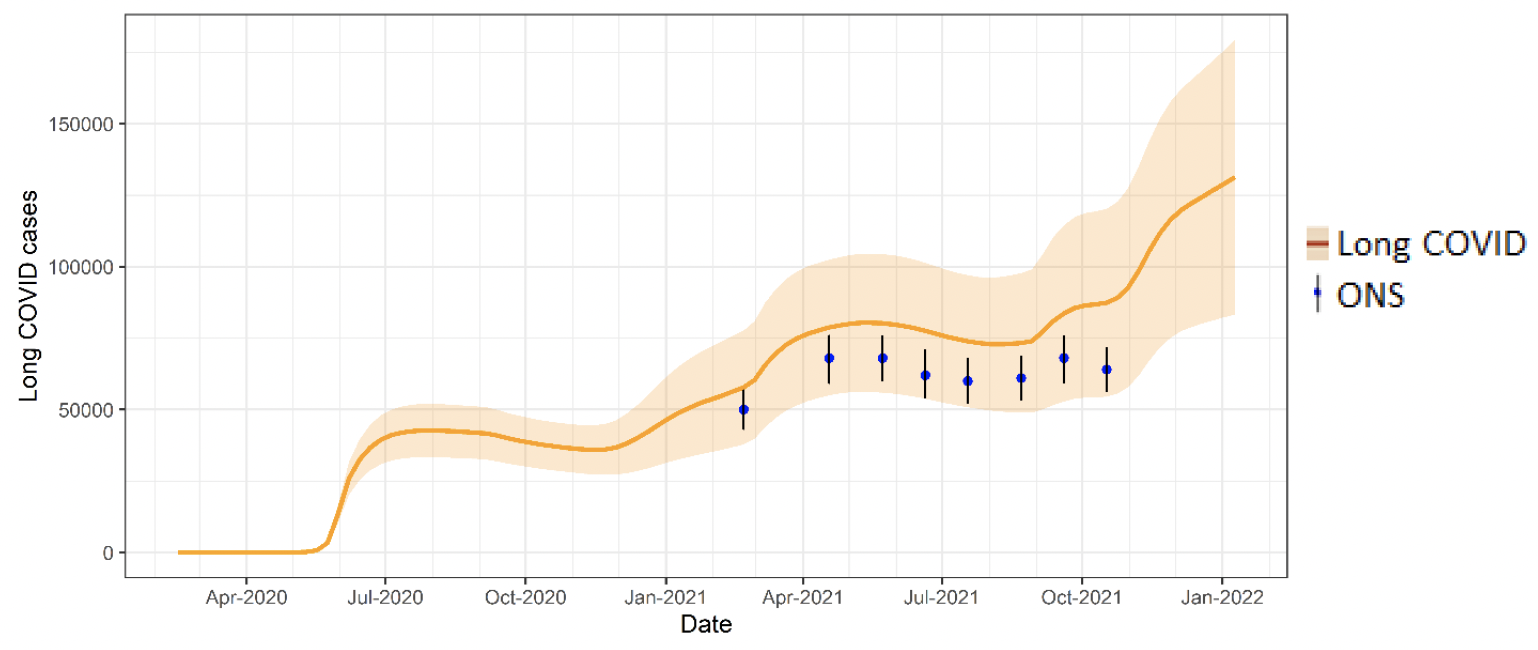
The Scottish Government is modelling the number of people likely to experience long Covid symptoms. This gives a projection of estimated self-reported long Covid rates in the future, based on Scottish Government medium term projection modelling, as set out in Figure 6.
This modelling estimates that at 9th January 2022 between 83,000 (1.5% of the population) and 179,000 (3.3%) people are projected to self-classify with long Covid for 12 weeks or more after their first suspected Covid infection in Scotland.
These are preliminary results, further data on rates of long Covid and associated syndromes as research emerges are required.
See the Technical Annex in issue 73 for information about the methodology.
What we know about the Omicron variant
As of 19th December 2021, a total of 21,975 cases had been reported, of which 1,111 (5.1%) were confirmed, 20,777 (94.5%) were probable and 87 (0.4%) were possible. Total cases are more than four-fold higher than on 12th December 2021, when they were 5,486[6].
We can estimate a doubling time for Scotland of between 2.60 – 2.71 days using S-gene target failure as a proxy for Omicron cases[7]. We will continue to monitor the doubling times which may fluctuate or change over future days.
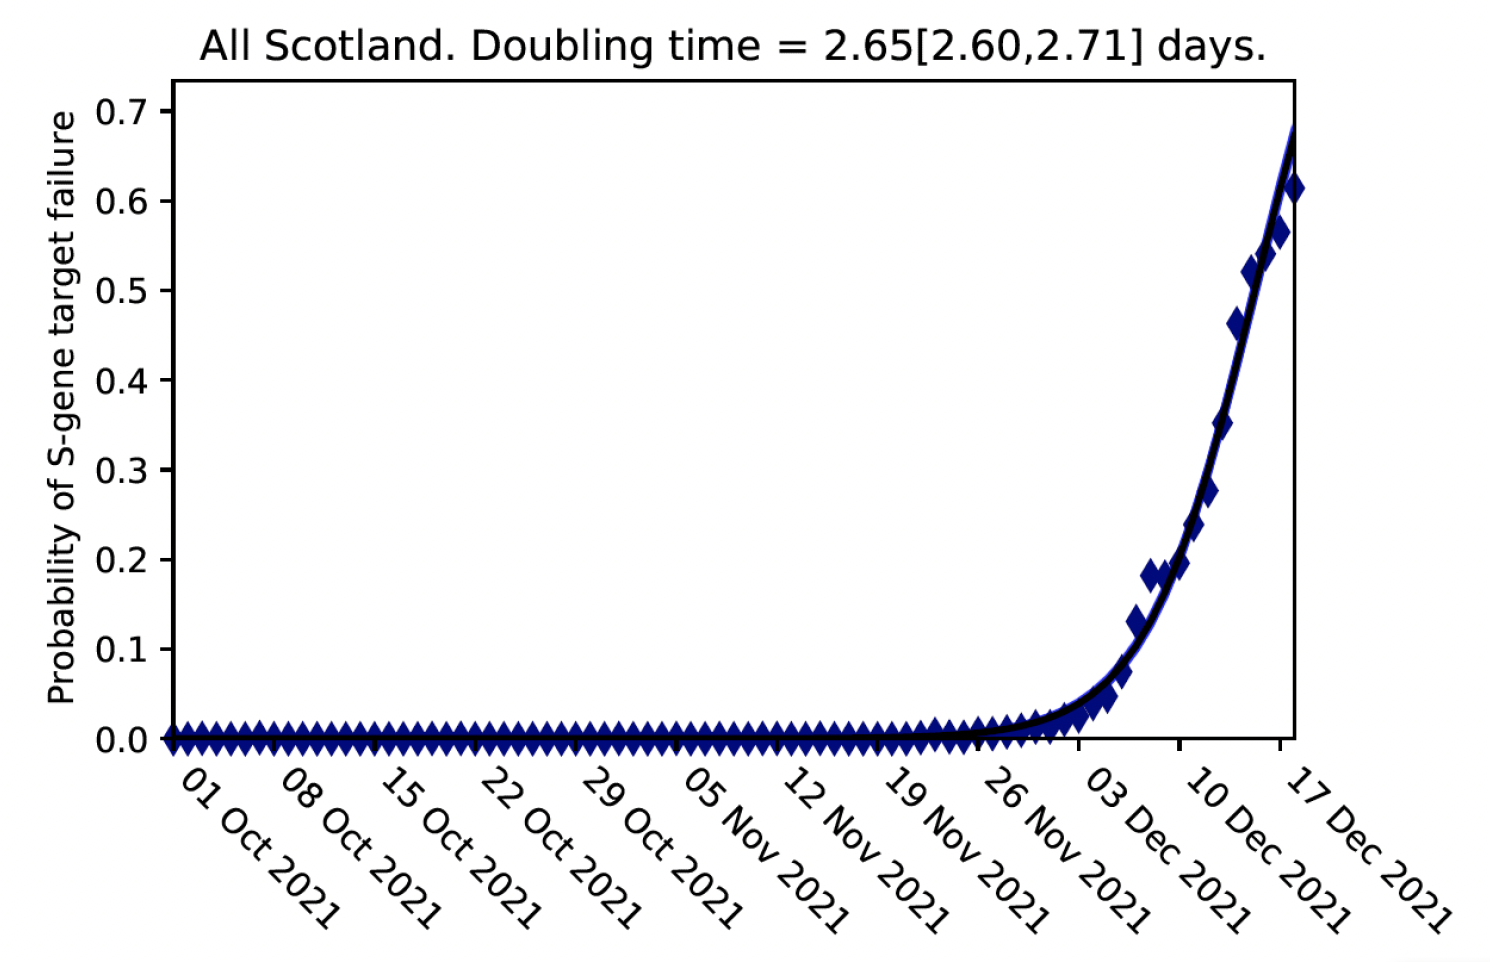
This curve is projected to estimate the proportion of Omicron cases in future weeks in Scotland.
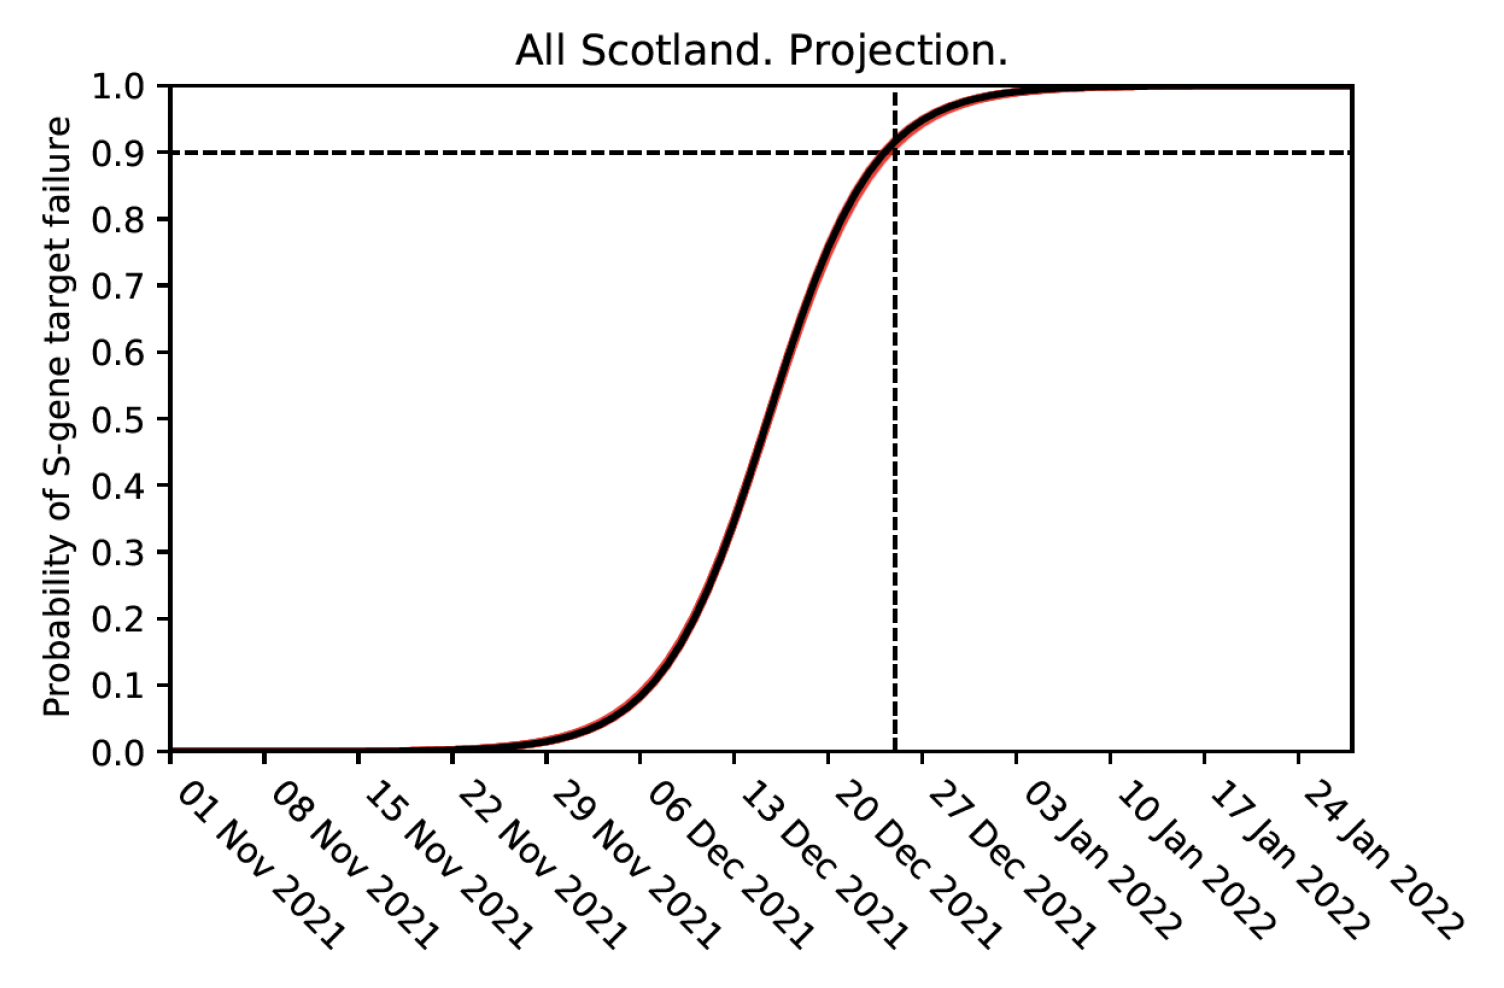
See the Technical Annex in Issue 82 for information about the methodology.
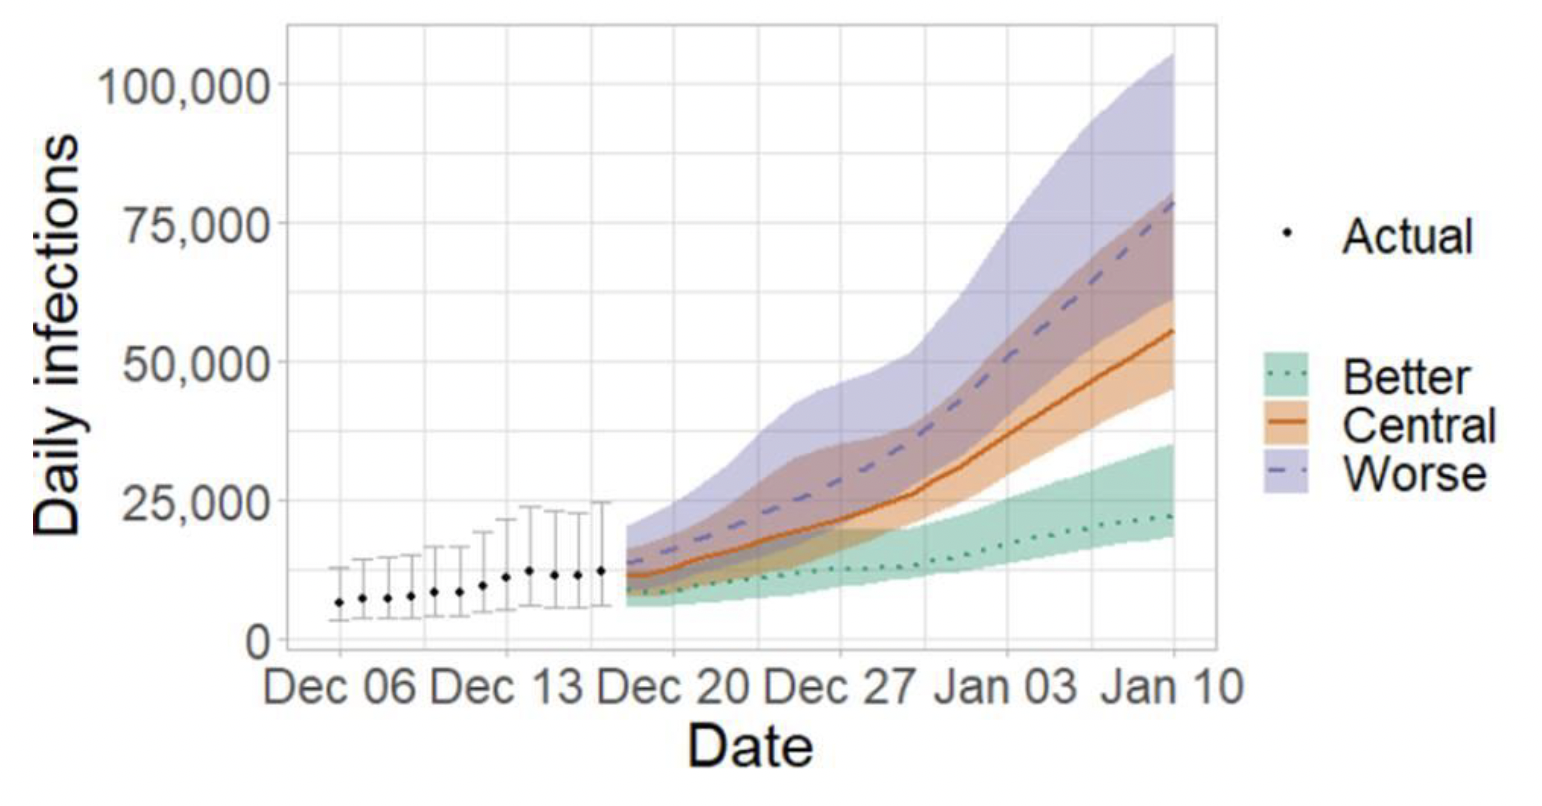
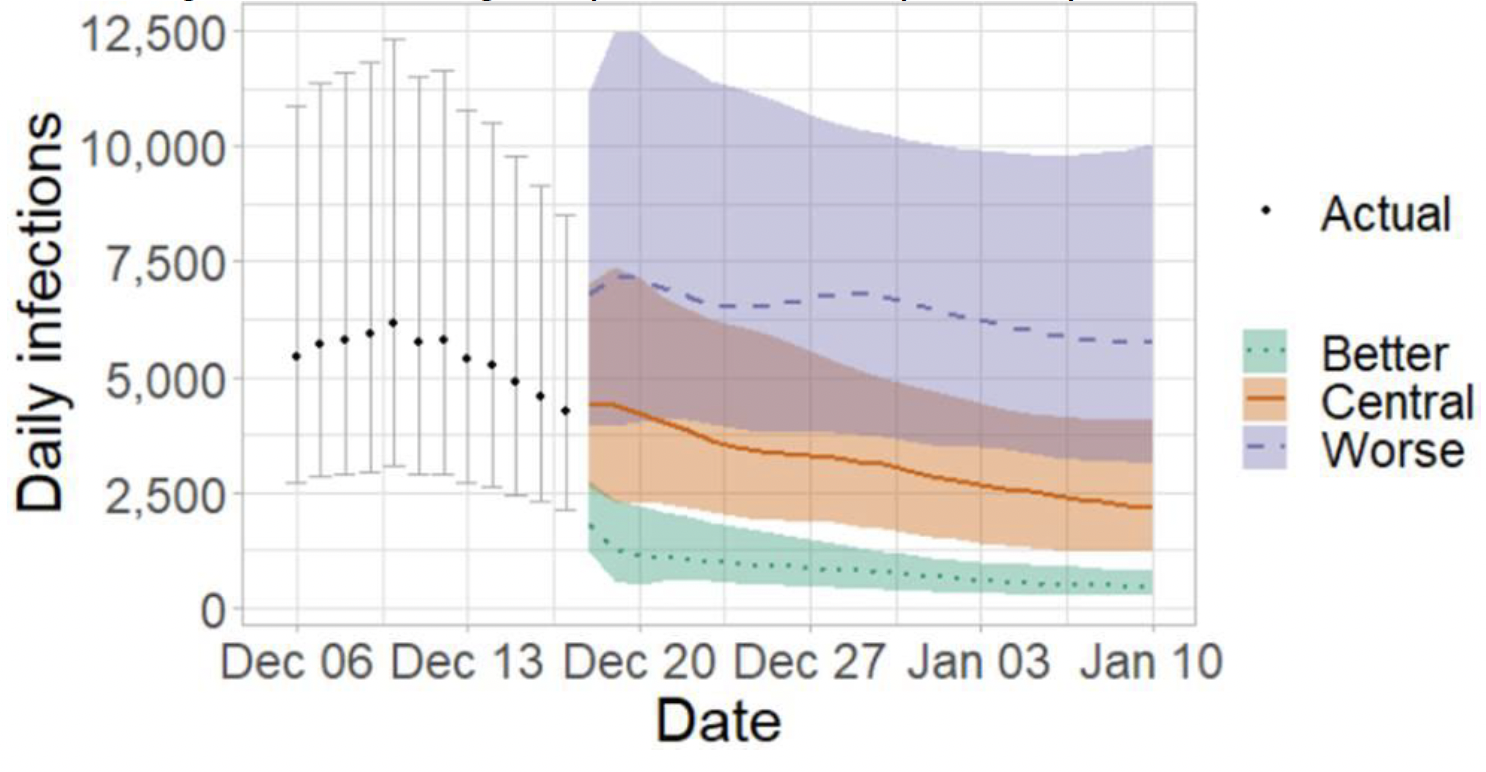
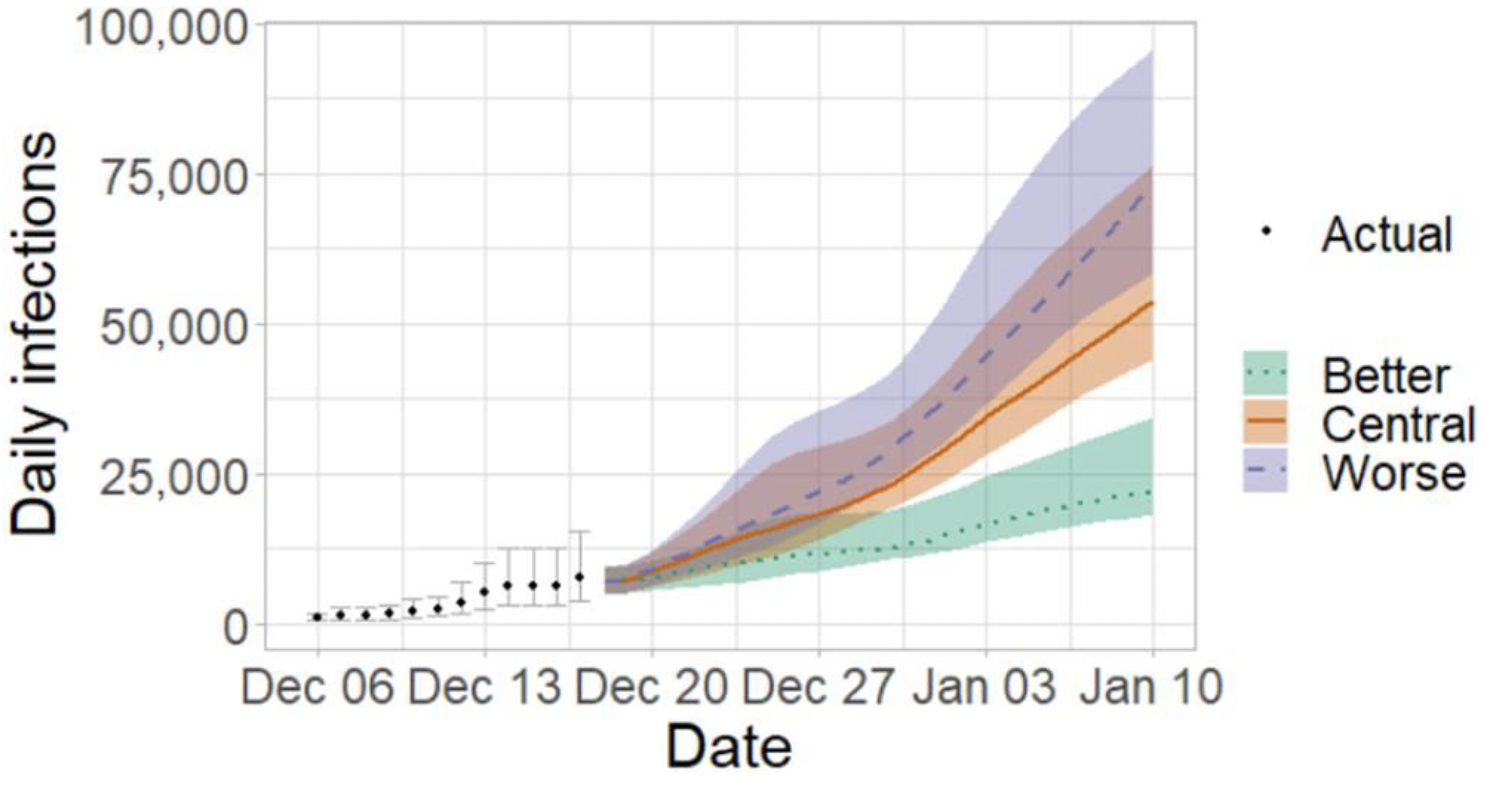
What the modelling tells us about estimated infections
The Scottish Government assesses the impact of Covid-19 on the NHS in the next few weeks, in this research findings we focus on estimating the number of infections. Figures 9-11 show three projections over the three weeks to 9th January, broken down by possible Omicron infections, Delta infections, and combined infections. We hope to be able to provide hospitalisation and ICU in future weeks which account for the Omicron variant as well as Delta.
These projections include the effect of the new interventions announced on 14th and 21st December, and booster take up. 'Central' assumes a continuation of the current trend for Delta, and that Omicron is between two to three times more transmissible. 'Worse' assumes a higher transmissibility for both Delta and Omicron. 'Better' assumes a lower transmissibility for both variants. All projections also assume a lower vaccine effectiveness[8] for Omicron than for Delta[9].
Delta infections are likely to fall over time, but those still being infected and already infected will still contribute to the numbers of people in hospital and ICU. Meanwhile the increase which we see in Omicron infections will continue. At the present time, due to the lag between infections and hospitalisations, only infections figures are provided in Figures 9-11. We hope to be able to provide hospital occupancy and ICU in future weeks.
Other modelling
This section covers some modelling outputs for which the methodology is not affected by which variant is dominant.
What we know about how people's contact patterns have changed
Average contacts from the most recent Panel A cohort of the Scottish Contact Survey (week ending 15th December) indicate an average of 5.8 contacts. This has increased by 21% compared to the previous Panel A of the survey (week ending 1st December), as seen in Figure 12. Mean contacts have increased within the work and other setting (contacts outside home, school and work) rising by 15% and 57% respectively. Contacts within the home have remained at a similar level over the same period.
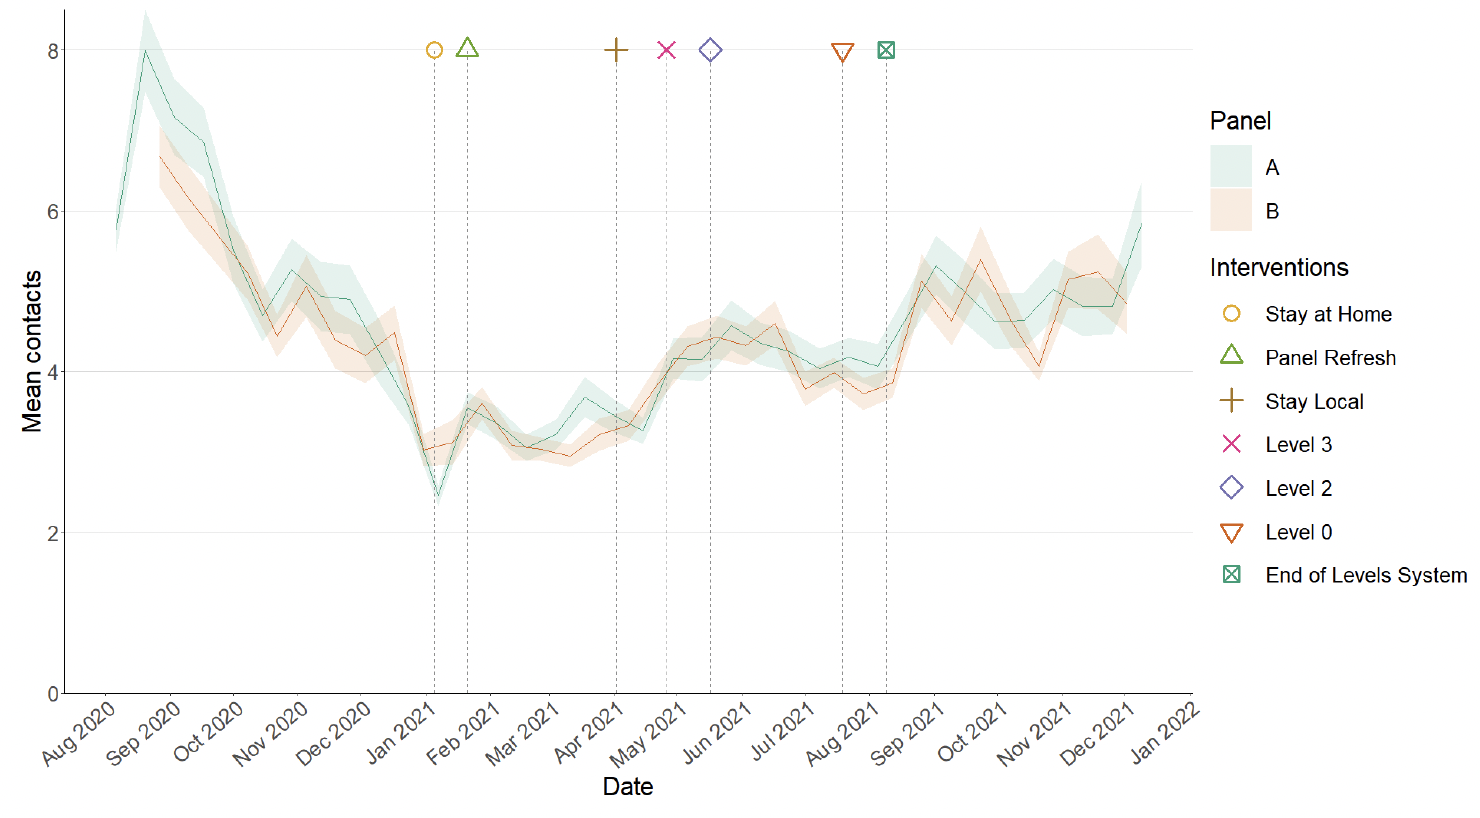
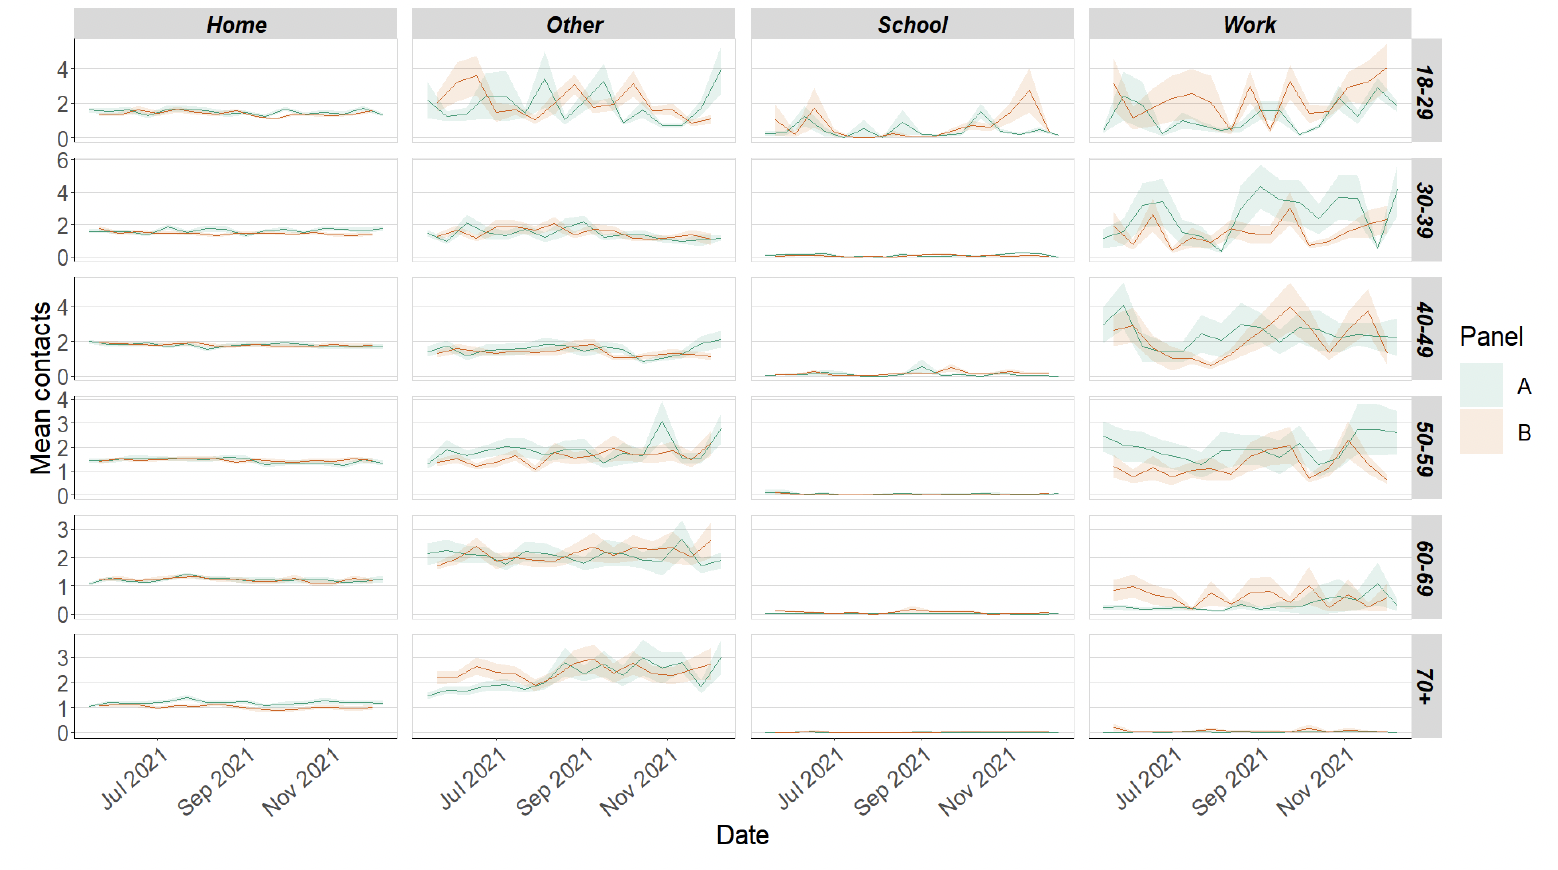
Figure 13 shows how contacts change across age group and setting. All age groups, with the exception of those aged 60-69, have increased their overall mean contacts. The biggest increase is within the 30-39 age group, more than doubling compared to two weeks prior. This is largely driven by contacts in the workplace.
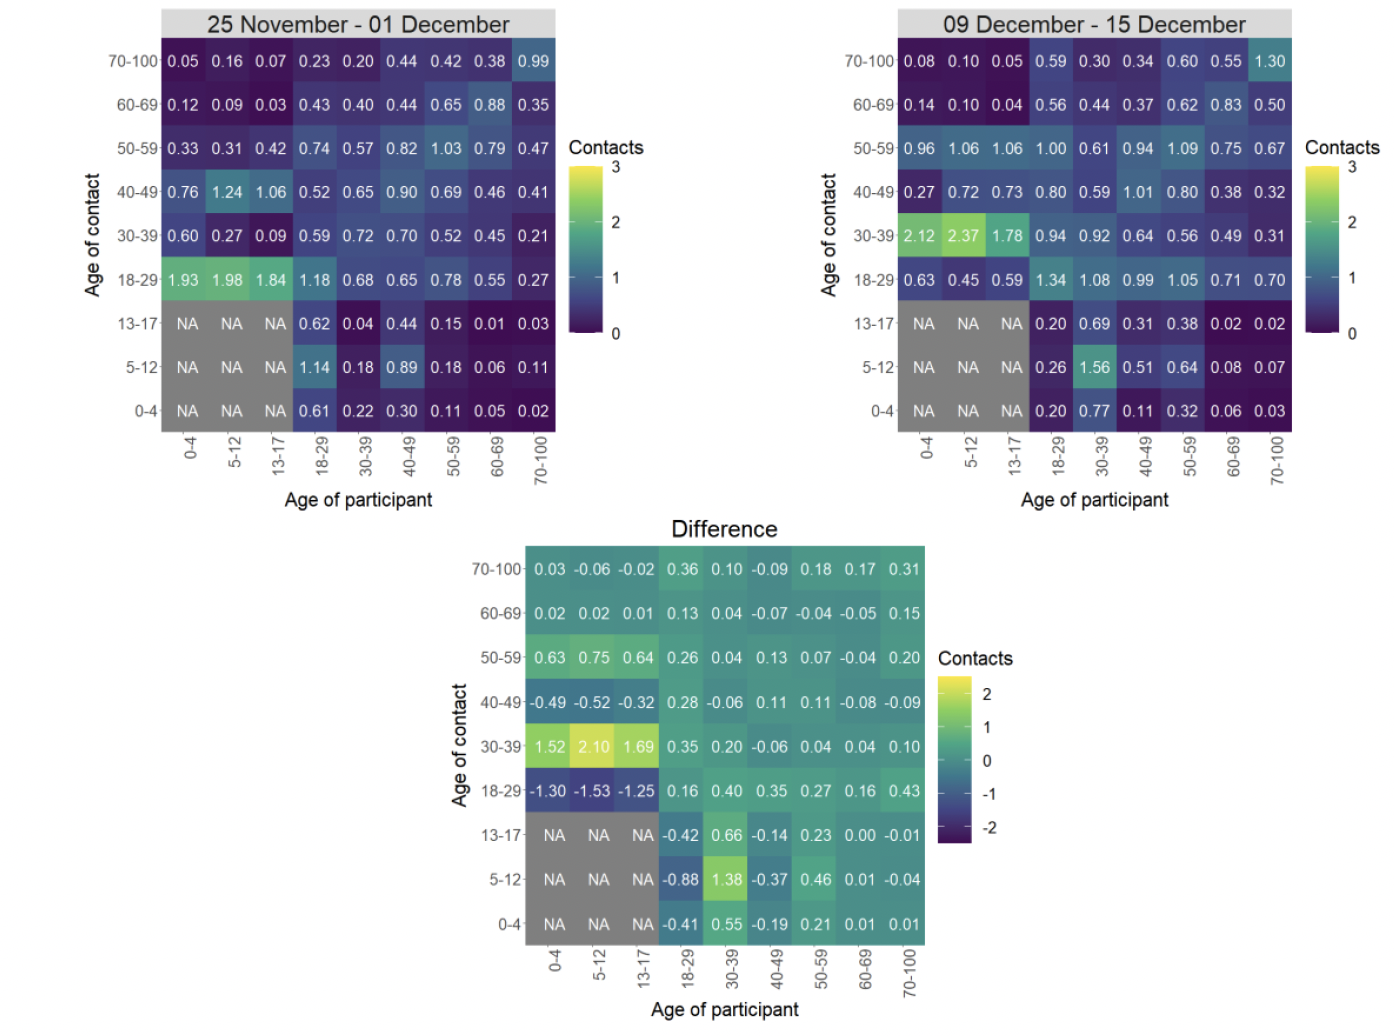
The heatmaps in Figure 14 show the mean overall contacts between age groups for the weeks relating to 25th November - 1st December and 9th December - 15th December and the difference between these periods. The highest interactions are reported between those under 18 with individuals within the 30-39 age group in the last two weeks.
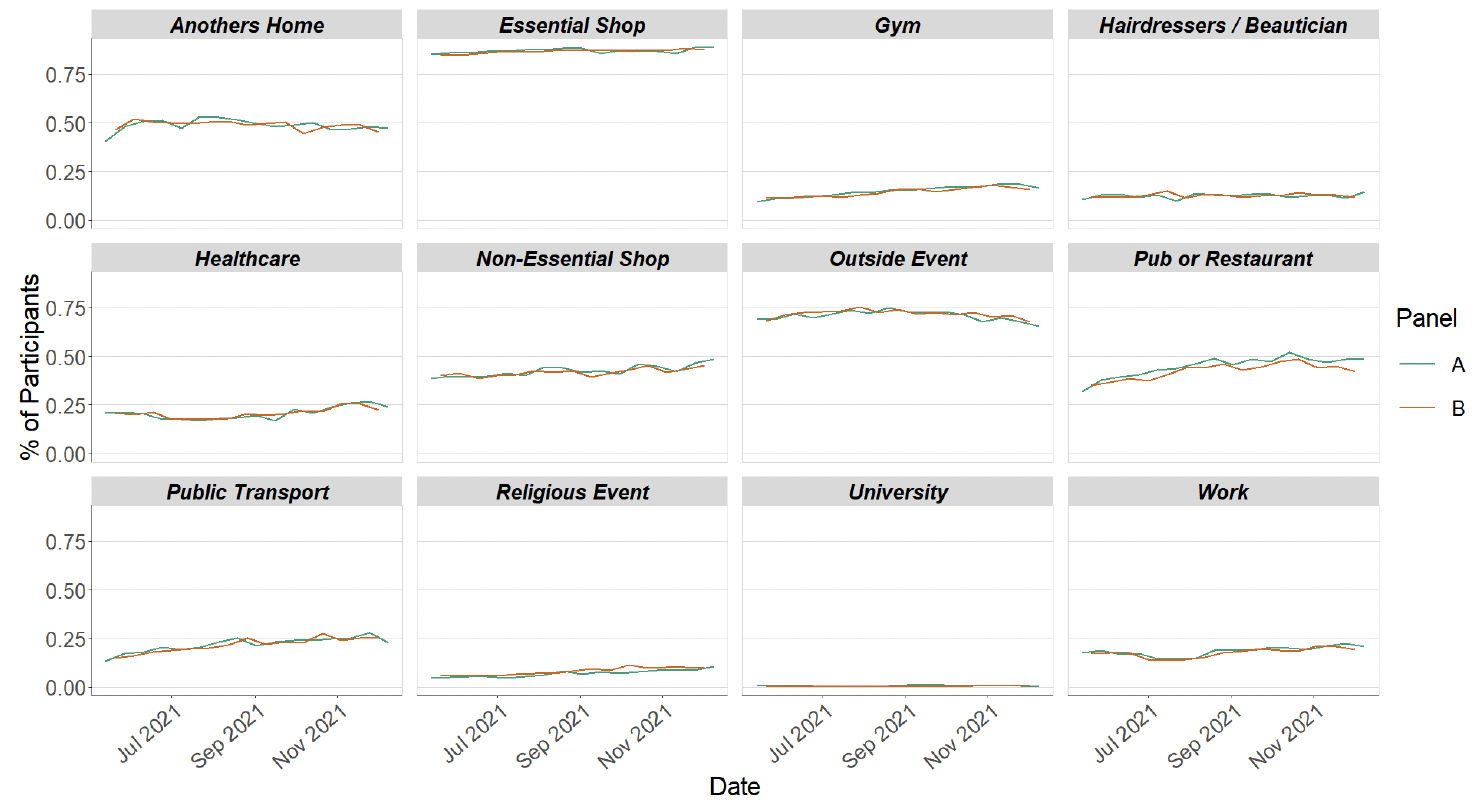
As shown in Figure 15, the biggest changes in the proportion of participants visiting different locations, is seen in those visiting a hairdressers/beautician and those using public transport. Visits to a hairdressers/beautician increased from approximately 12% to 15% and those using public transport decreased from 28% to 23% in the last two weeks.
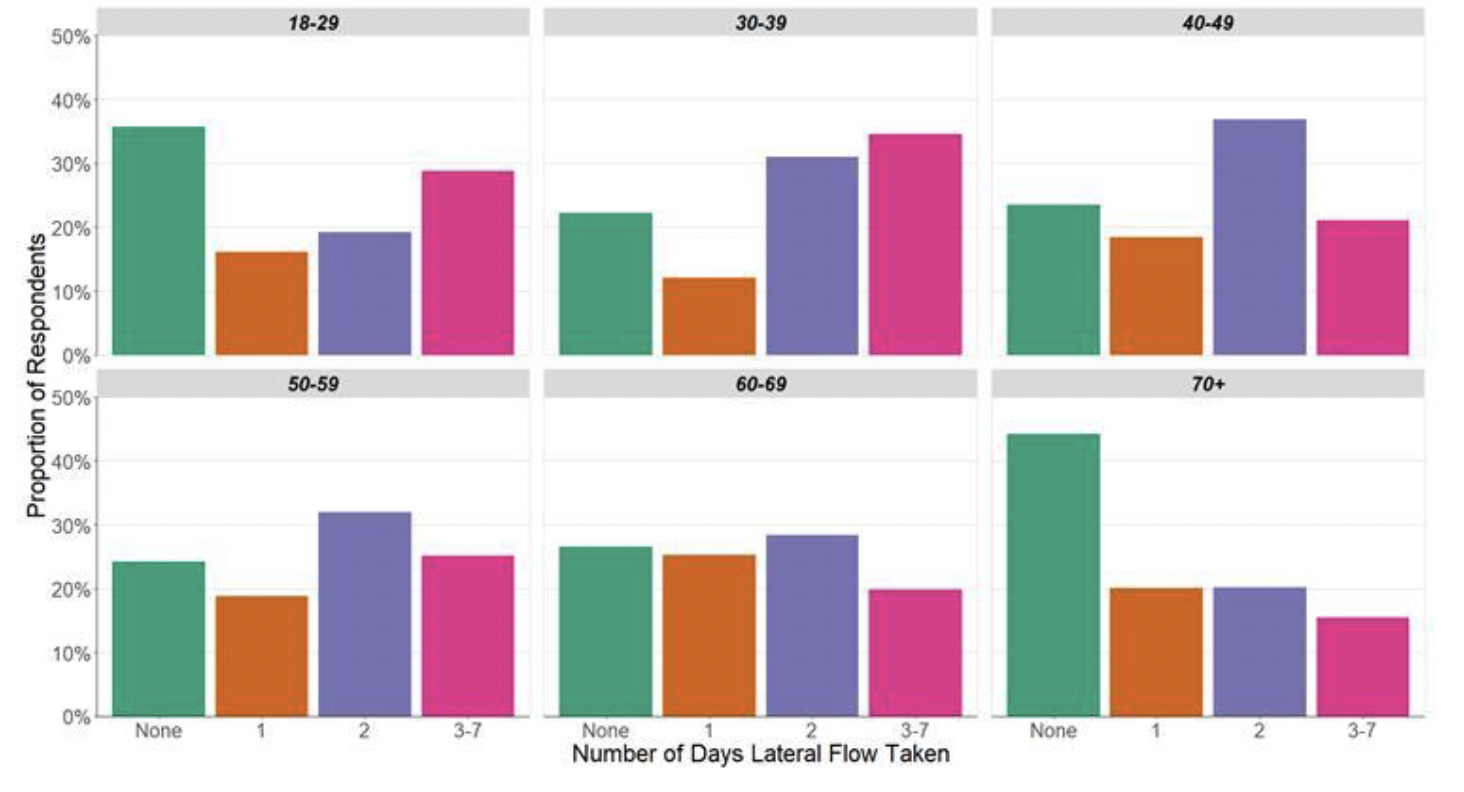
Approximately 70% of individuals have taken at least one lateral flow test within the last 7 days for the survey pertaining to the 9th - 15th December as shown in Figure 16.
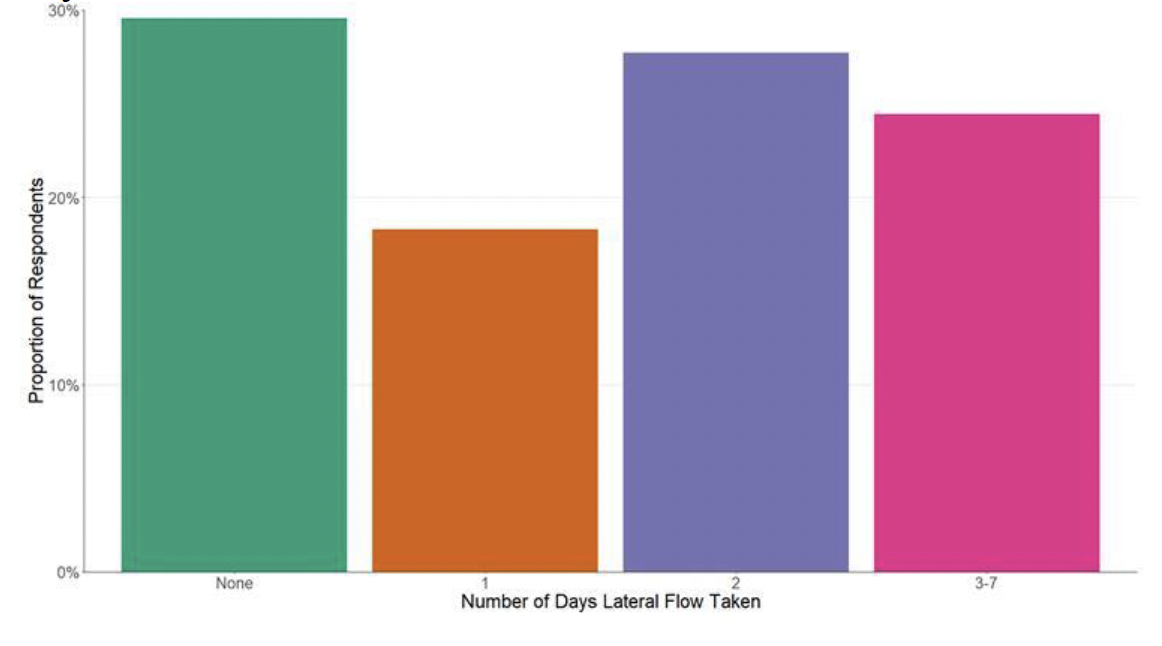
The youngest and oldest age groups (18-29 and 70+) have reported the lowest proportions of individuals who have taken one or more lateral flows, 64% and 56% respectively. In contrast, those aged between 30‑69 report the highest proportion of individuals taking at least one lateral flow test within the last 7 days, with at least 73% taken at least one.
What can analysis of wastewater samples tell us about local outbreaks of Covid-19 infection?
Levels of Covid-19 RNA in wastewater (WW) collected at a number of sites around Scotland are adjusted for population and local changes in intake flow rate (or ammonia levels where flow is not available) and compared to 7-day average daily new case rates derived from Local Authority and Neighbourhood (Intermediate Zone) level aggregate data. See Technical Annex in Issue 34 of these Research Findings for the methodology.
Nationwide, wastewater Covid-19 levels have shown an accelerated increase in the past week, increasing by 135%. The week ending on 20th December saw levels of around 129 million gene copies per person per day (Mgc/p/d), up from around 55 Mgc/p/d in the previous week (week ending 13th December). This matches the recent rise in cases caused by the rapid spread of the Omicron variant. The Office of National Statistics' Coronavirus Infection Survey (CIS) has shown a similar increase compared to last week, with data available up until 11th December.
Figure 18 shows the national running average trend (over a 7-day period) for the full set of sampled sites, with a small number of unrealistically large outliers excluded.
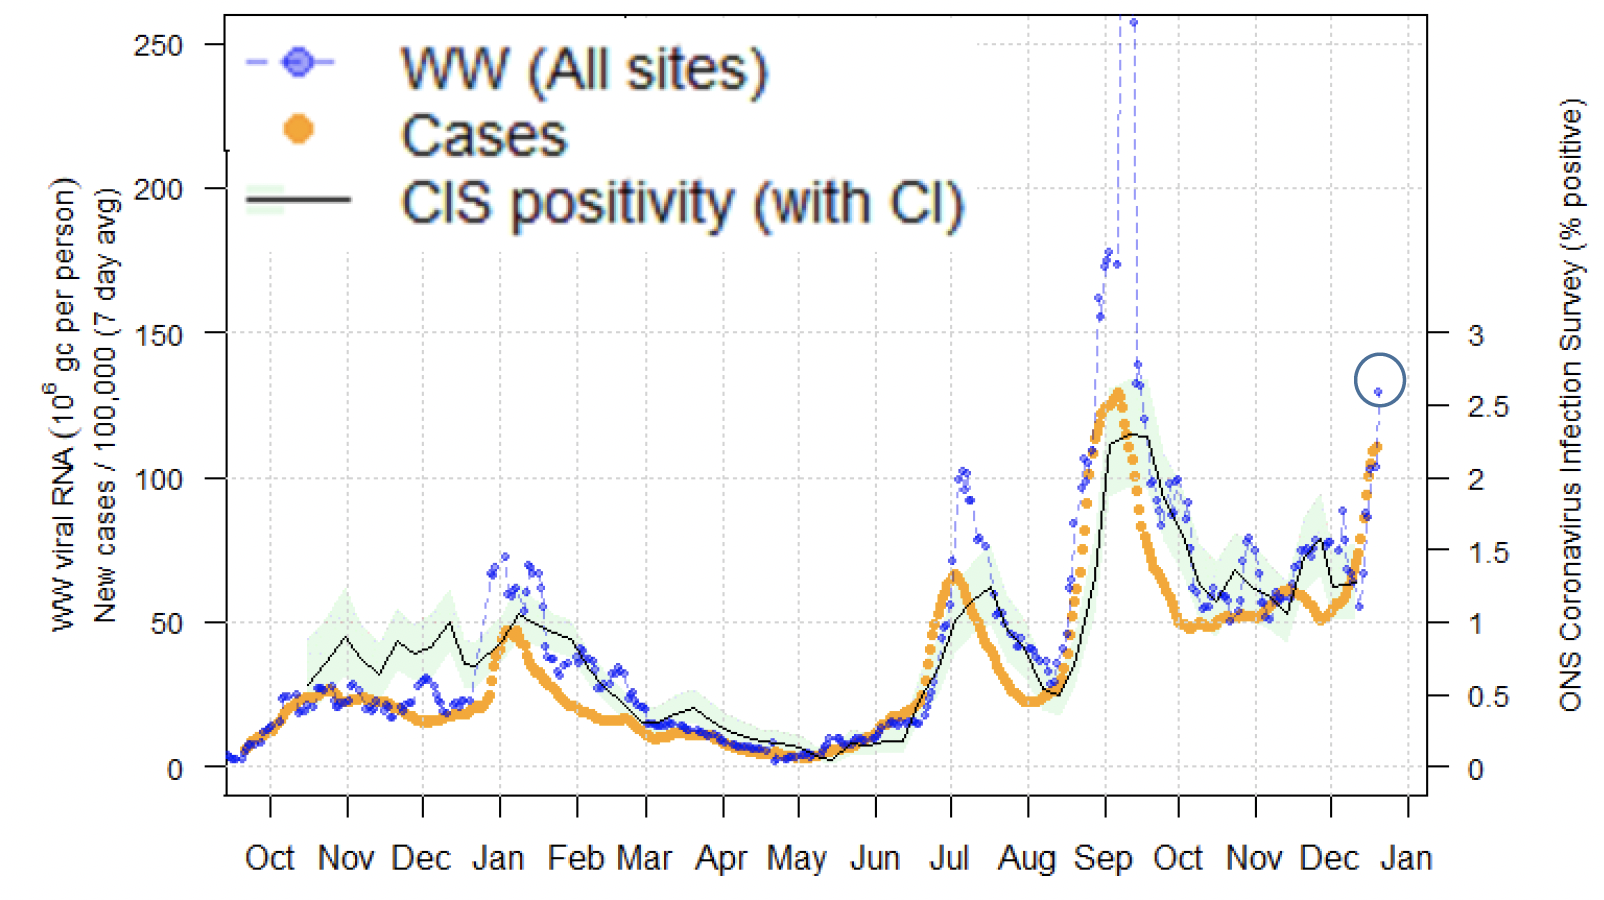
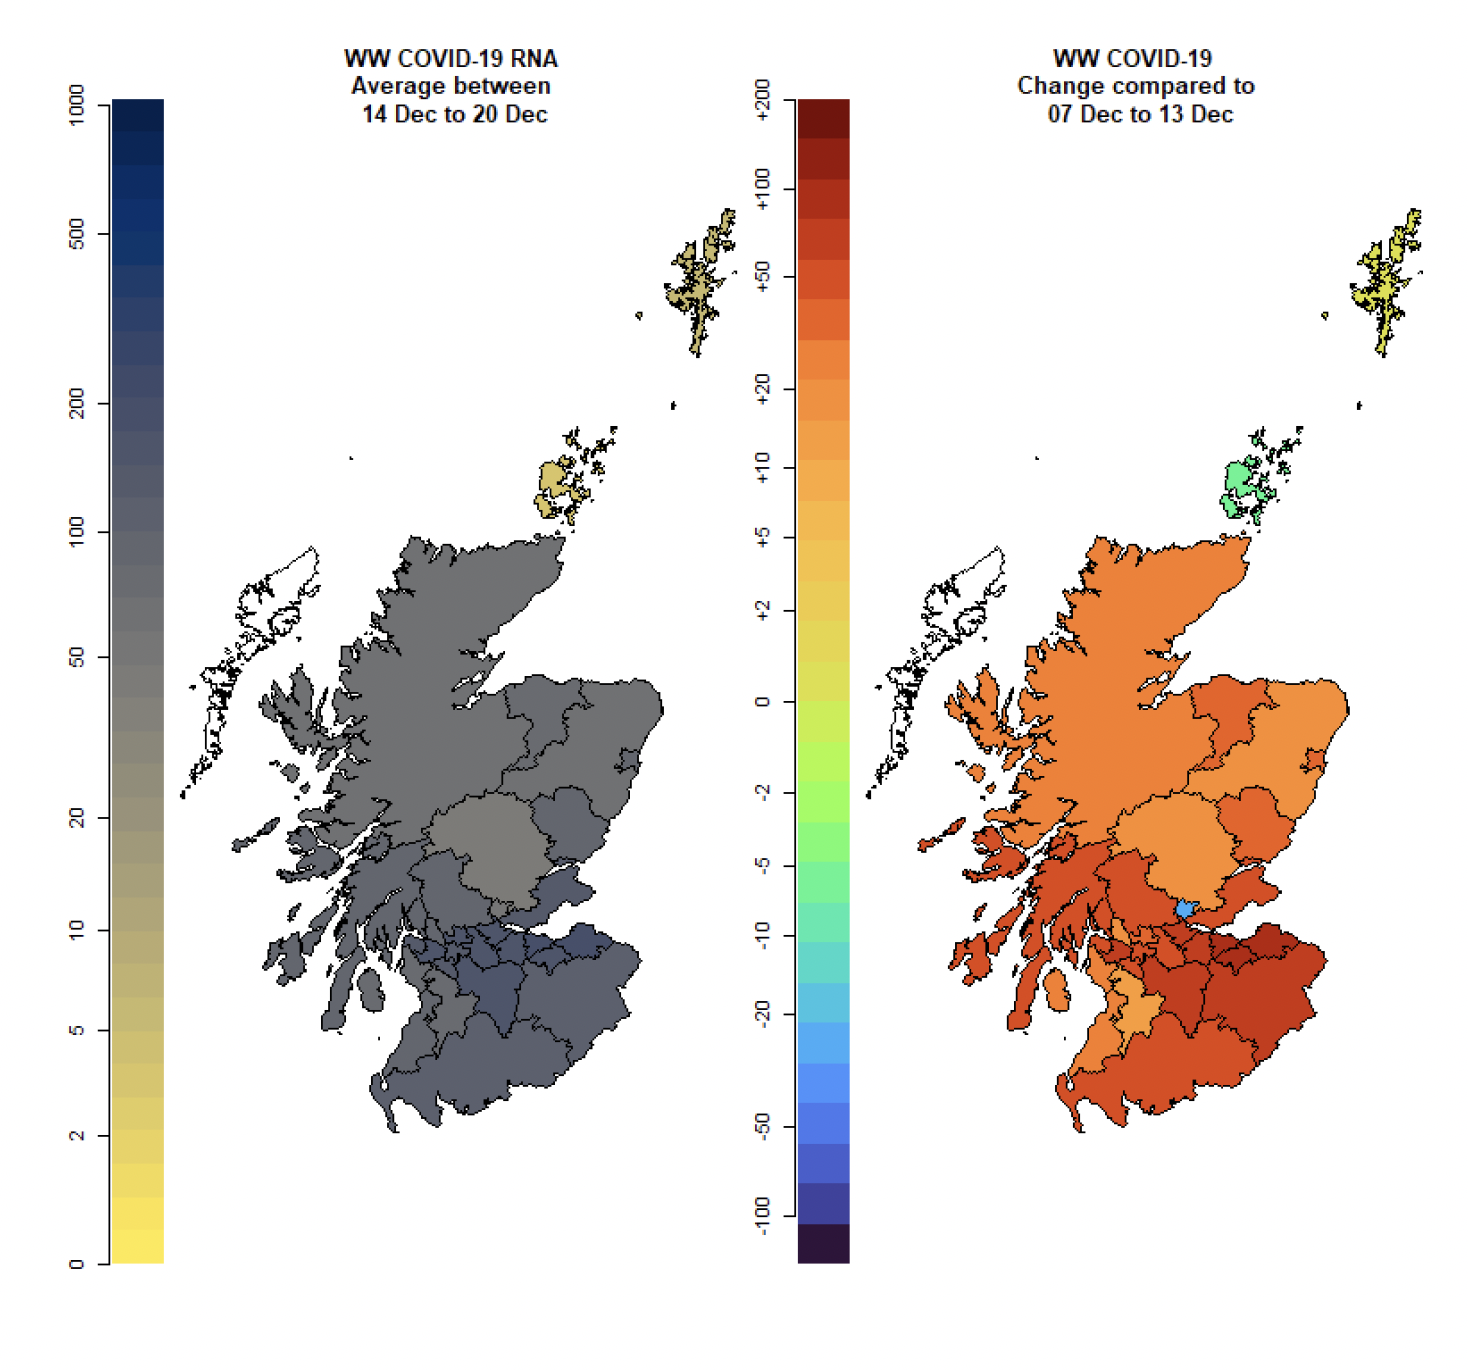
Figure 19 shows wastewater Covid-19 levels for each local authority for week ending 20th December and changes relative to week ending 13th December. Influence of the novel Omicron variant is now becoming evident at the national level.
What next?
Modelling will be provided for both the Delta and Omicron variants where possible. As more information on Omicron becomes available this will be incorporated in the different models as and when it is appropriate to do so.