Coronavirus (COVID-19): modelling the epidemic (issue no. 73)
Latest findings in modelling the COVID-19 epidemic in Scotland, both in terms of the spread of the disease through the population (epidemiological modelling) and of the demands it will place on the system, for example in terms of health care requirement.
Technical Annex
Epidemiology is the study of how diseases spread within populations. One way we do this is using our best understanding of the way the infection is passed on and how it affects people who catch it to create mathematical simulations. Because people who catch Covid-19 have a relatively long period in which they can pass it on to others before they begin to have symptoms, and the majority of people infected with the virus will experience mild symptoms, this "epidemiological modelling" provides insights into the epidemic that cannot easily be measured through testing e.g. of those with symptoms, as it estimates the total number of new daily infections and infectious people, including those who are asymptomatic or have mild symptoms.
Modelling also allows us to make short-term forecasts of what may happen with a degree of uncertainty. These can be used in health care and other planning. The modelling in this research findings is undertaken using different types of data which going forward aims to both model the progress of the epidemic in Scotland and provide early indications of where any changes are taking place.
The delivery of the vaccination programme will offer protection against severe disease and death. The modelling includes assumptions about compliance with restrictions and vaccine take-up. Work is still ongoing to understand how many vaccinated people might still spread the virus if infected. As Covid-19 is a new disease there remain uncertainties associated with vaccine effectiveness. Furthermore, there is a risk that new variants emerge for which immunisation is less effective.
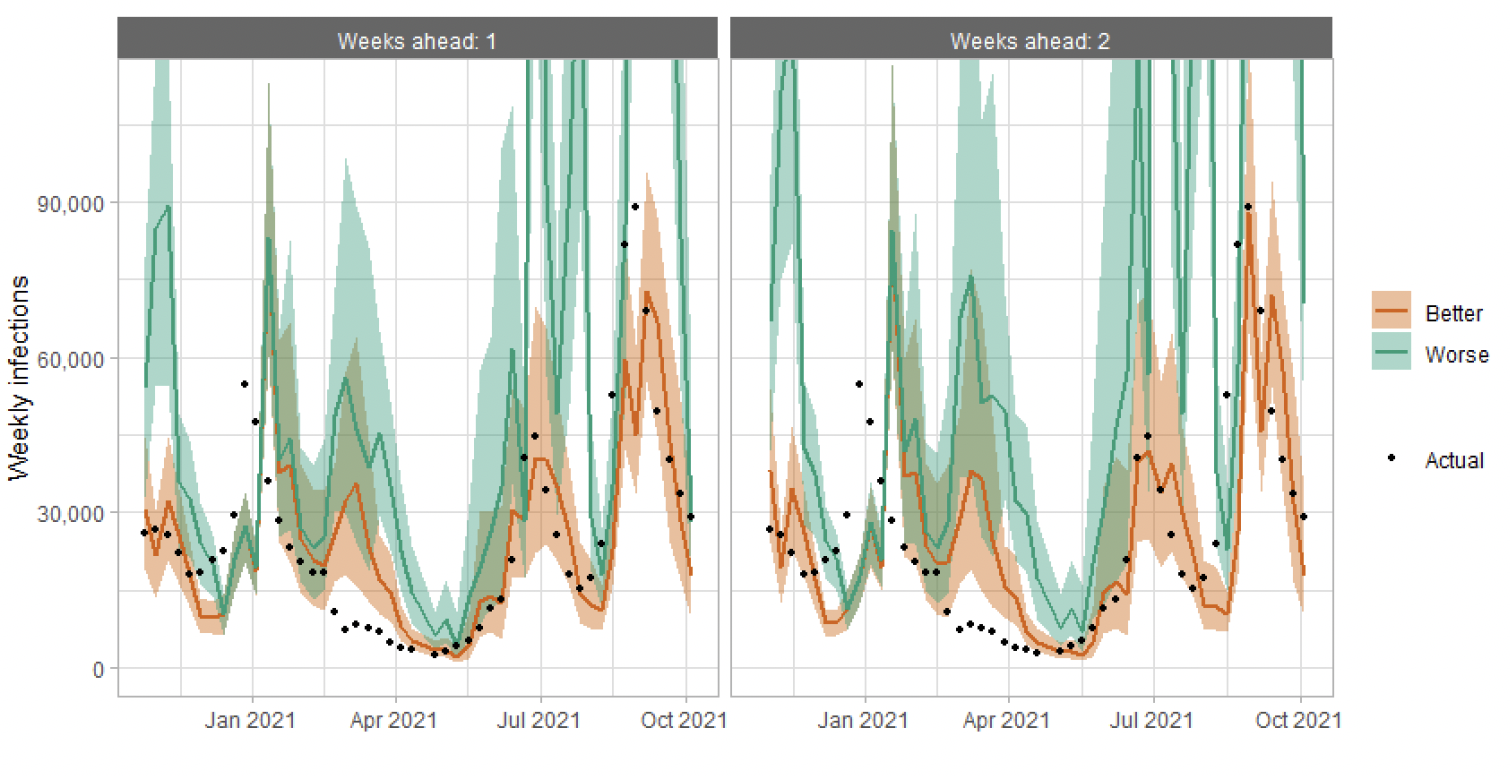
How the modelling compares to the real data as it emerges
The following charts show the history of our modelling projections in comparison to estimates of the actual data. The infections projections were largely accurate during October to mid-December 2020 and from mid‑January 2021 onwards. During mid-December 2020 to mid‑January 2021, the projections underestimated the number of infections, due to the unforeseen effects of the new variant.
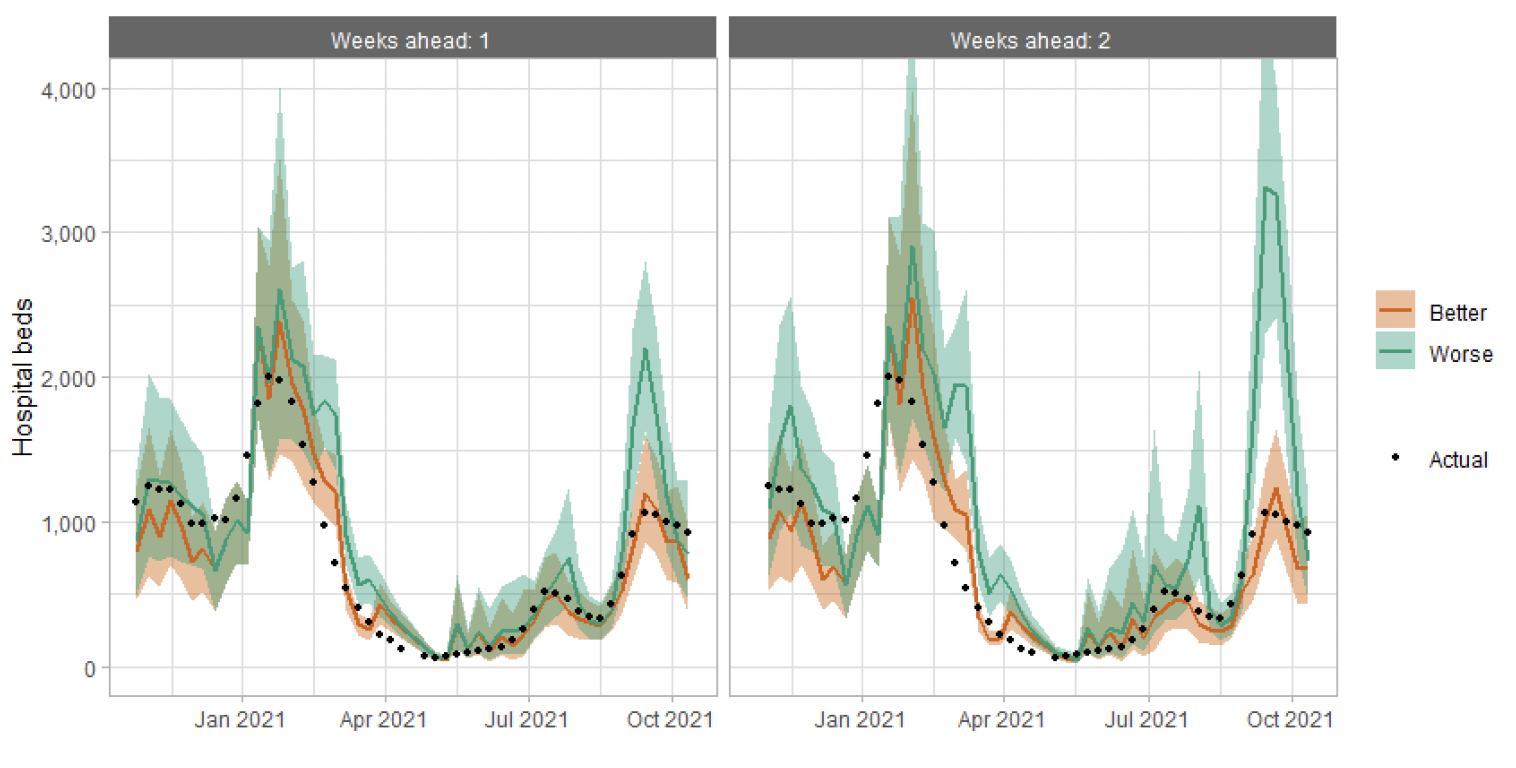
Hospital bed projections have generally been more precise than infections estimates due to being partially based on already known information about numbers of current infections, and number of people already in hospital. The projections are for number of people in hospital due to Covid-19, which is slightly different to the actuals, which are number of people in hospital within 28 days of a positive Covid-19 test.
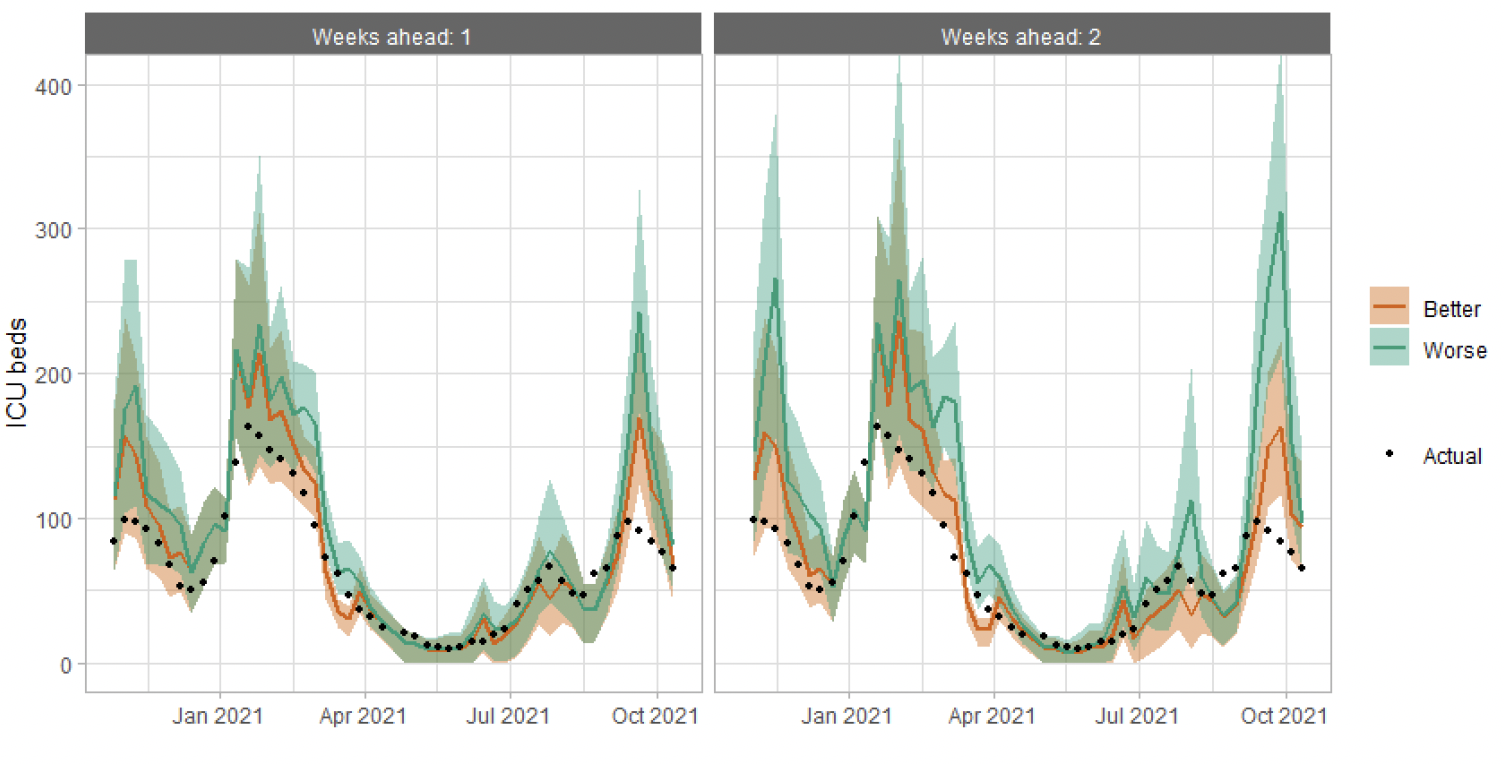
As with hospital beds, ICU bed projections have generally been more precise than infections. The projections are for number of people in ICU due to Covid-19. The actuals are number of people in ICU within 28 days of a positive Covid-19 test up to 20 January 2021, after which they include people in ICU over the 28 day limit.
Long Covid
Long Covid is a complex condition, with an emerging, but limited, evidence base. It is characterised by ongoing symptoms for several weeks or months after acute Covid-19. As the available evidence accrues, techniques need to be developed to assess the prevalence of long Covid at national level in Scotland to inform health board planning.
Emerging evidence shows that many people infected with Covid-19 go on to have long-term needs. This is not limited just to intensive care and those who received acute hospital care, for whom needs can be complex and varied. Some people that were asymptomatic or experienced mild illness following infection may also experience a range of longer lasting symptoms.
The condition can present with clusters of symptoms, often overlapping, which may change over time and affect several systems within the body. Common symptoms include (but are not limited to): fatigue, persistent high temperature, breathlessness, cognitive impairment, generalised pain, and mental health problems[13].
The term long Covid is commonly used to describe signs and symptoms that continue or develop after acute Covid-19 and are not explained by an alternative diagnosis. It includes both ongoing symptomatic Covid-19 (from 4 to 12 weeks) and post-Covid-19 syndrome (12 weeks or more)[14] . The ONS has published estimates of the number of people in the community population in Scotland with self-reported long Covid[15]. The ONS has also reported estimates of the prevalence of post-acute symptoms among people with coronavirus (Covid-19)[16].
The estimates of long Covid from Scottish Government modelling are based on estimated infections (derived from SG infection modelling) and the estimated self-reported rates of long Covid symptoms, based on ONS surveys. ONS findings showed that up to around 12% of people infected with Covid-19 self-classify as having long Covid-19 12 weeks after the initial infection. These results are based on self-reported data provided by a sample of Coronavirus Infection Survey (CIS)[17] participants.
The ONS estimates of self-reported long Covid, also using responses to the CIS, are included alongside the SG estimates to aid interpretation. Assessing how common long Covid is depends on how it is measured. The ONS self-reported long COVID estimates SG includes for comparison are based on surveys of individuals in private households only, rather than the whole population.
| Probability of exceeding (cases per 100k) | ||||||
|---|---|---|---|---|---|---|
| Local Authority (LA) | 50 | 100 | 300 | 500 | 750 | 1000 |
| Aberdeen City | 75-100% | 75-100% | 25-50% | 5-15% | 0-5% | 0-5% |
| Aberdeenshire | 75-100% | 75-100% | 50-75% | 25-50% | 15-25% | 5-15% |
| Angus | 75-100% | 75-100% | 25-50% | 15-25% | 5-15% | 5-15% |
| Argyll and Bute | 75-100% | 75-100% | 15-25% | 0-5% | 0-5% | 0-5% |
| City of Edinburgh | 75-100% | 75-100% | 15-25% | 5-15% | 0-5% | 0-5% |
| Clackmannanshire | 75-100% | 75-100% | 25-50% | 0-5% | 0-5% | 0-5% |
| Dumfries & Galloway | 75-100% | 75-100% | 25-50% | 5-15% | 0-5% | 0-5% |
| Dundee City | 75-100% | 75-100% | 75-100% | 25-50% | 15-25% | 5-15% |
| East Ayrshire | 75-100% | 75-100% | 50-75% | 25-50% | 0-5% | 0-5% |
| East Dunbartonshire | 75-100% | 75-100% | 50-75% | 5-15% | 0-5% | 0-5% |
| East Lothian | 75-100% | 75-100% | 15-25% | 0-5% | 0-5% | 0-5% |
| East Renfrewshire | 75-100% | 75-100% | 50-75% | 15-25% | 5-15% | 0-5% |
| Falkirk | 75-100% | 75-100% | 50-75% | 15-25% | 5-15% | 0-5% |
| Fife | 75-100% | 75-100% | 50-75% | 25-50% | 5-15% | 0-5% |
| Glasgow City | 75-100% | 75-100% | 25-50% | 5-15% | 0-5% | 0-5% |
| Highland | 75-100% | 50-75% | 15-25% | 5-15% | 0-5% | 0-5% |
| Inverclyde | 75-100% | 75-100% | 15-25% | 0-5% | 0-5% | 0-5% |
| Midlothian | 75-100% | 75-100% | 15-25% | 0-5% | 0-5% | 0-5% |
| Moray | 75-100% | 75-100% | 50-75% | 25-50% | 15-25% | 15-25% |
| Na h-Eileanan Siar | 50-75% | 25-50% | 5-15% | 0-5% | 0-5% | 0-5% |
| North Ayrshire | 75-100% | 75-100% | 25-50% | 5-15% | 0-5% | 0-5% |
| North Lanarkshire | 75-100% | 75-100% | 50-75% | 5-15% | 0-5% | 0-5% |
| Orkney Islands | 25-50% | 5-15% | 0-5% | 0-5% | 0-5% | 0-5% |
| Perth and Kinross | 75-100% | 75-100% | 25-50% | 5-15% | 0-5% | 0-5% |
| Renfrewshire | 75-100% | 75-100% | 25-50% | 5-15% | 0-5% | 0-5% |
| Scottish Borders | 75-100% | 75-100% | 50-75% | 15-25% | 15-25% | 5-15% |
| Shetland Islands | 25-50% | 25-50% | 0-5% | 0-5% | 0-5% | 0-5% |
| South Ayrshire | 75-100% | 75-100% | 25-50% | 5-15% | 0-5% | 0-5% |
| South Lanarkshire | 75-100% | 75-100% | 50-75% | 5-15% | 0-5% | 0-5% |
| Stirling | 75-100% | 75-100% | 50-75% | 25-50% | 15-25% | 15-25% |
| West Dunbartonshire | 75-100% | 75-100% | 25-50% | 0-5% | 0-5% | 0-5% |
| West Lothian | 75-100% | 75-100% | 50-75% | 25-50% | 5-15% | 0-5% |
What levels of Covid-19 are indicated by wastewater data?
Table 2 provides population weighted daily averages for normalised WW Covid-19 levels in the weeks beginning 29th September and 6th October, with no estimate for error. This is given in Million gene copies per person, which approximately corresponds to new cases per 100,000 per day. Coverage is given as percentage of LA inhabitants covered by a wastewater Covid‑19 sampling site delivering data during this period[18].
| Local authority (LA) | w/b 29th September | w/b 6th October | Coverage |
|---|---|---|---|
| Aberdeen City | 100 | 38 | 80% |
| Aberdeenshire | 91 | 55 | 26% |
| Angus | 83 | 64 | 43% |
| Argyll and Bute | – | – | 0% |
| City of Edinburgh | 67 | 35 | 96% |
| Clackmannanshire | 125 | 35 | 70% |
| Dumfries & Galloway | – | 64 | 37% |
| Dundee City | 100 | 64 | 100% |
| East Ayrshire | 99 | 45 | 57% |
| East Dunbartonshire | 154 | 95 | 99% |
| East Lothian | 67 | 33 | 65% |
| East Renfrewshire | 74 | 36 | 95% |
| Falkirk | 84 | 72 | 59% |
| Fife | 87 | 70 | 74% |
| Glasgow City | 115 | 72 | 98% |
| Highland | 41 | 33 | 32% |
| Inverclyde | 24 | 37 | 92% |
| Midlothian | 67 | 47 | 88% |
| Moray | 44 | 66 | 70% |
| Na h-Eileanan Siar | – | – | 0% |
| North Ayrshire | 38 | 32 | 93% |
| North Lanarkshire | 155 | 62 | 80% |
| Orkney Islands | 12 | 16 | 34% |
| Perth and Kinross | – | 48 | 38% |
| Renfrewshire | 64 | 45 | 57% |
| Scottish Borders | 23 | 34 | 50% |
| Shetland Islands | 1 | 2 | 29% |
| South Ayrshire | 101 | 45 | 77% |
| South Lanarkshire | 81 | 47 | 52% |
| Stirling | 32 | – | 0% |
| West Dunbartonshire | 106 | 95 | 48% |
| West Lothian | 155 | 114 | 58% |