Coronavirus (COVID-19): modelling the epidemic (issue no. 29)
Latest findings in modelling the COVID-19 epidemic in Scotland, both in terms of the spread of the disease through the population (epidemiological modelling) and of the demands it will place on the system, for example in terms of health care requirement.
What the modelling tells us about the epidemic as a whole
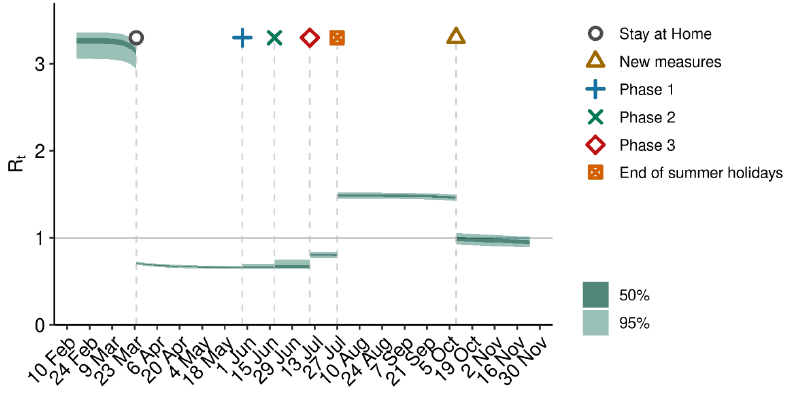
Figure 1 shows how Rt has changed since February (including 50% and 95% confidence intervals). Before the “stay at home” restrictions were put in place Rt was above 1, and most likely to have been between 3 and 4 before any interventions were put in place.
Source: Scottish Government modelled estimates using Imperial College model code; actual data from https://www.nrscotland.gov.uk/statistics-and-data/statistics/statistics-by-theme/vital-events/general-publications/weekly-and-monthly-data-on-births-and-deaths/deaths-involving-coronavirus-covid-19-in-scotland
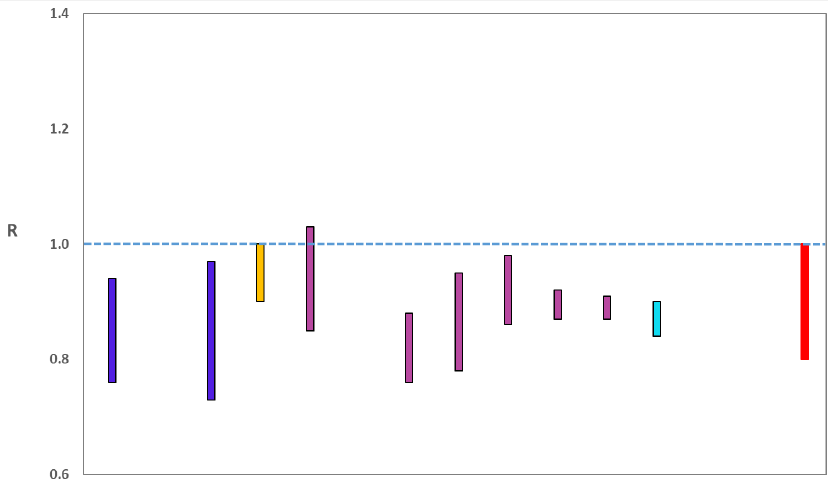
The various groups which report to the Scientific Pandemic Influenza Group on Modelling (SPI-M) use different sources of data in their models (i.e. deaths, hospital admissions, cases) so their estimates of R are also based on these different methods. SAGE’s consensus view across these methods, as of 02 December, was that the value of Rt in Scotland was between 0.8 and 1.0. The R value estimated by the Scottish Government is within the consensus range (Figure 2).
Source: Scientific Advisory Group for Emergencies (SAGE).
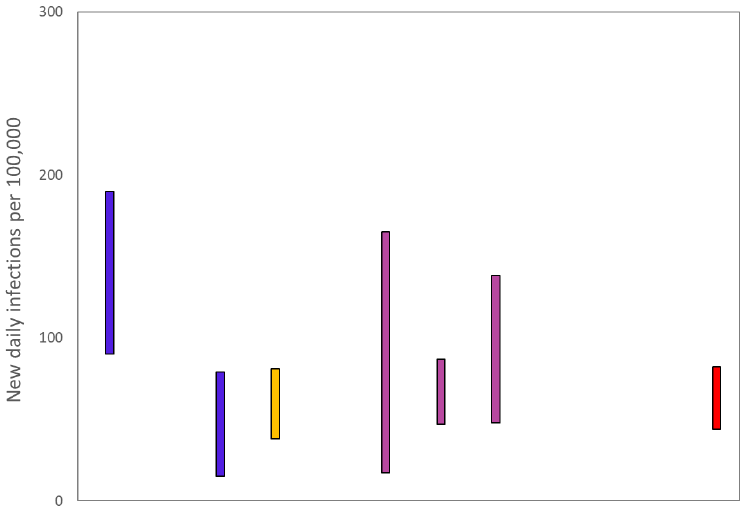
The various groups which report to the Scientific Pandemic Influenza Group on Modelling (SPI-M) use different sources of data in their models to produce estimates of incidence (Figure 3). SPI-M’s consensus view across these methods, as of 02 December, was that the incidence of new daily infections in Scotland was between 44 and 82 new infections per 100,000. This equates to between 2,400 and 4,500 people becoming infected each day in Scotland.
Source: Scientific Pandemic Influenza Group on Modelling (SPI-M).
The consensus from SAGE for this week is that the growth rate in Scotland is between -3% and -1% per day. Last week the growth rate was in the range -3% and 0%.
Figure 4 shows the epidemiological model forecasts of daily deaths produced by the Scottish Government, given the present set of interventions.
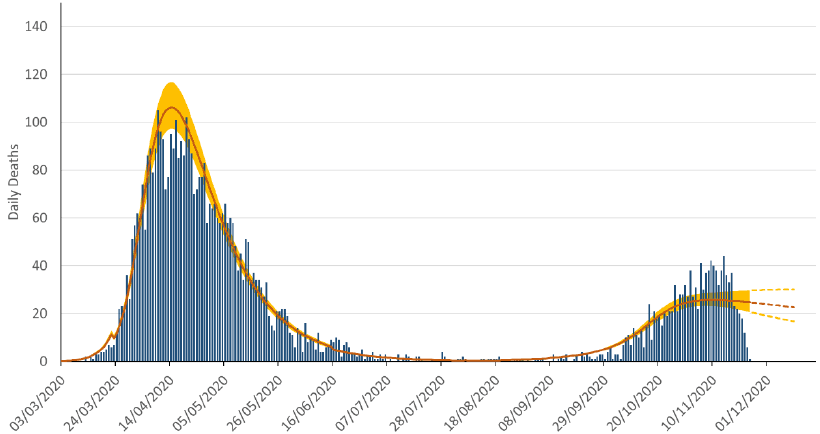
Source: Scottish Government modelled estimates using Imperial College model code; actual data from https://www.nrscotland.gov.uk/statistics-and-data/statistics/statistics-by-theme/vital-events/general-publications/weekly-and-monthly-data-on-births-and-deaths/deaths-involving-coronavirus-covid-19-in-scotland
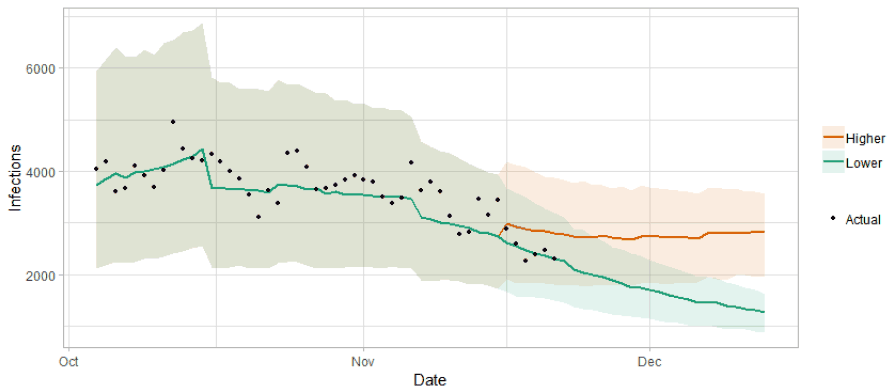
The logistical model developed by Scottish Government to assess implications for health care demand (see previous Research Findings) has been adapted to produce a short/medium-term predictions of infections.
Figure 5 shows a “Lower” projection, which assumes the Rt value is currently slightly below 1 and there will be limited increase in transmission from winter conditions, and a “Higher” projection, which assumes that Rt is currently slightly higher (but still below 1), and it will increase as winter sets in.