Coronavirus (COVID-19): modelling the epidemic (issue no.104)
Latest findings in modelling the COVID-19 epidemic in Scotland, both in terms of the spread of the disease through the population (epidemiological modelling) and of the demands it will place on the system, for example in terms of health care requirement.
Coronavirus (Covid-19): modelling the epidemic in Scotland (Issue No. 104)
Background
This is a report on the Scottish Government modelling of the spread and level of Covid-19 in Scotland. This updates the previous publication on modelling of Covid-19 in Scotland published on 7th July 2022. The estimates in this document provide an overview of the situation regarding the virus and help the Scottish Government, the health service and the wider public sector plan ahead.
Key Points
- The reproduction rate R in Scotland is currently estimated as being between 0.9 and 1.1, as at 5th July. Both the lower and upper limits have decreased since the last publication.
- The daily growth rate for Scotland is currently estimated as between ‑2% and 2% as at 5th July. The lower and upper limits have decreased since last publication.
- The number of new daily infections for Scotland is estimated as being between 513 and 1,044 per 100,000 people as at 5th July.
- Average contacts from the most recent wave of the Scottish Contact Survey (7th July - 13th July) indicate an average of 4.0 contacts. This has decreased by 33% compared to the previous wave of the survey (23rd June - 29th June) where average contacts were 6.0.
- Mean contacts within the work and other setting (contacts outside home, school and work) have decreased by 54% and 30% respectively over the last two weeks. Contacts within the home have increased by 7% over the same period.
- Average contacts have decreased in all age groups with the exception of those over 70 who have reported an increase by 8%. Those within the 18-29 age group have reported the biggest decrease over the last two weeks which has been largely driven by a reduction in contacts within the workplace.
- The biggest reduction in interactions is observed between the those within the 18-29 age group with each other.
- The biggest decreases in the proportion of participants visiting different locations are seen in those using public transport, decreasing from 32% to 29% and individuals attending the workplace, decreasing from 33% to 30%.
- The percentage of people wearing a face covering where they have at least one contact outside of the home has decreased from 33% to 30%.
- Approximately 46% of people had taken at least one lateral flow test in the previous 7 days.
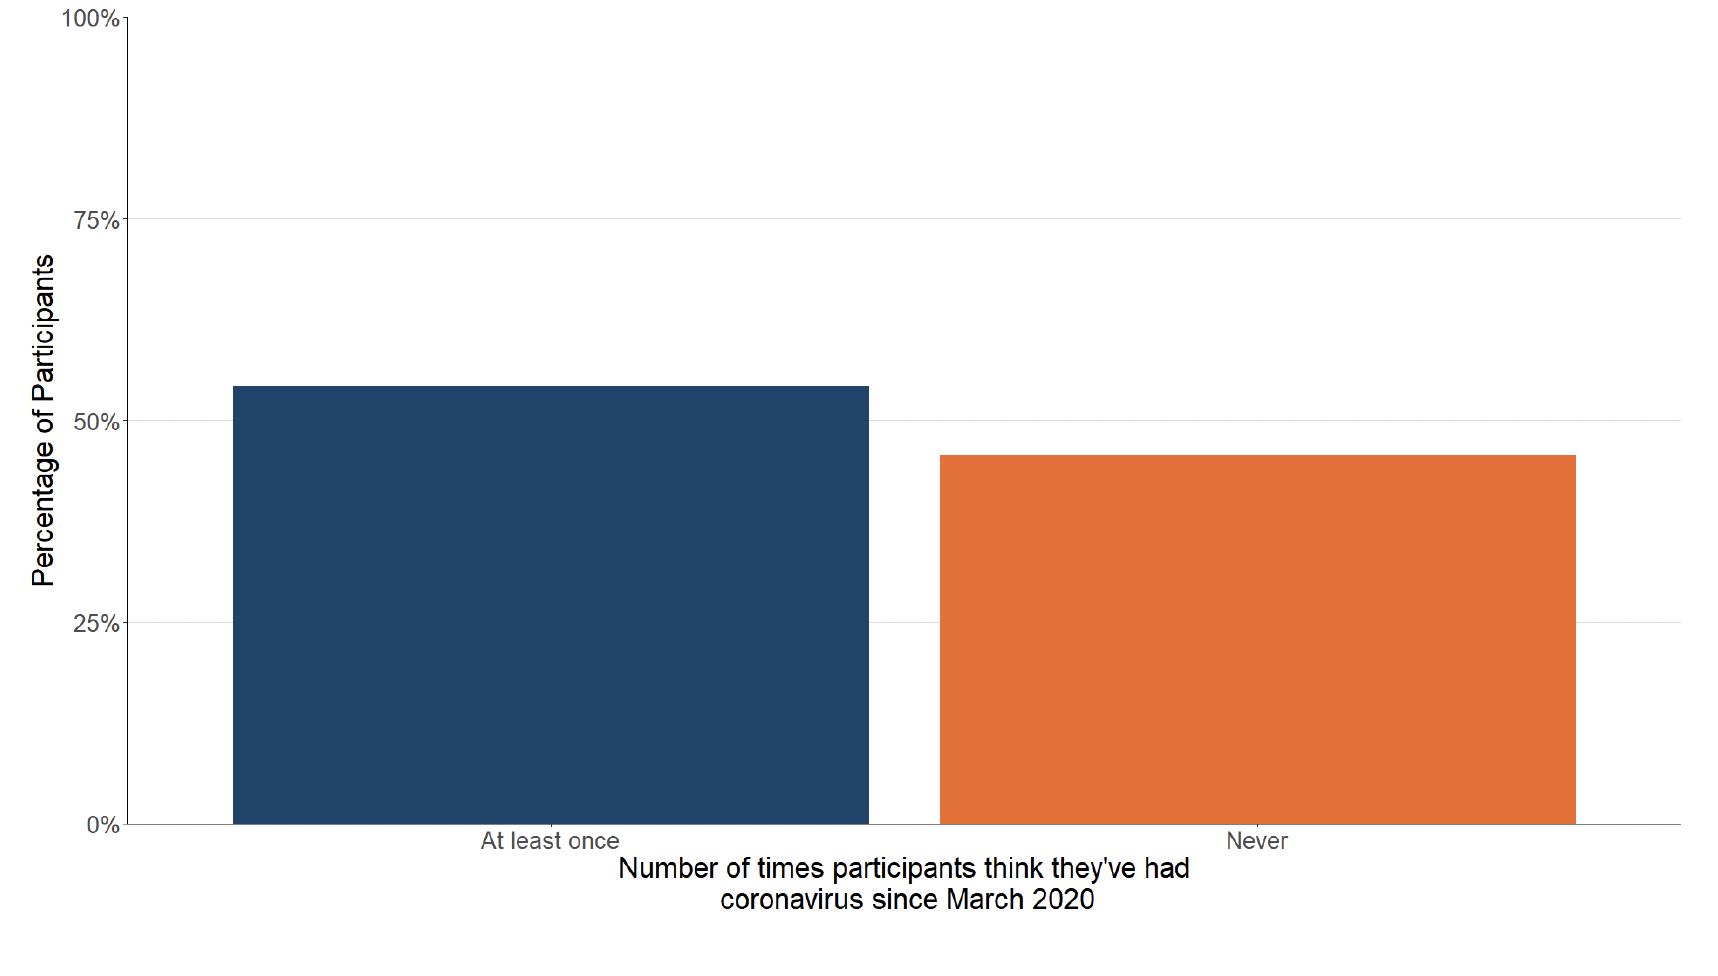
- 54% of participants believe they have had Covid-19 at least once since March 2020.
- The SPI-M-O consensus view is that by 9th August, daily hospitalisations from Covid-19 in Scotland are estimated to be between 37 and 451, and hospital occupancy is estimated to be between 777 and 3,597.
- Analysis by the Edinburgh University Roslin Institute indicates that there remains a substantial variation in geographical risk of infection when considering the average recorded census age and booster vaccination uptake.
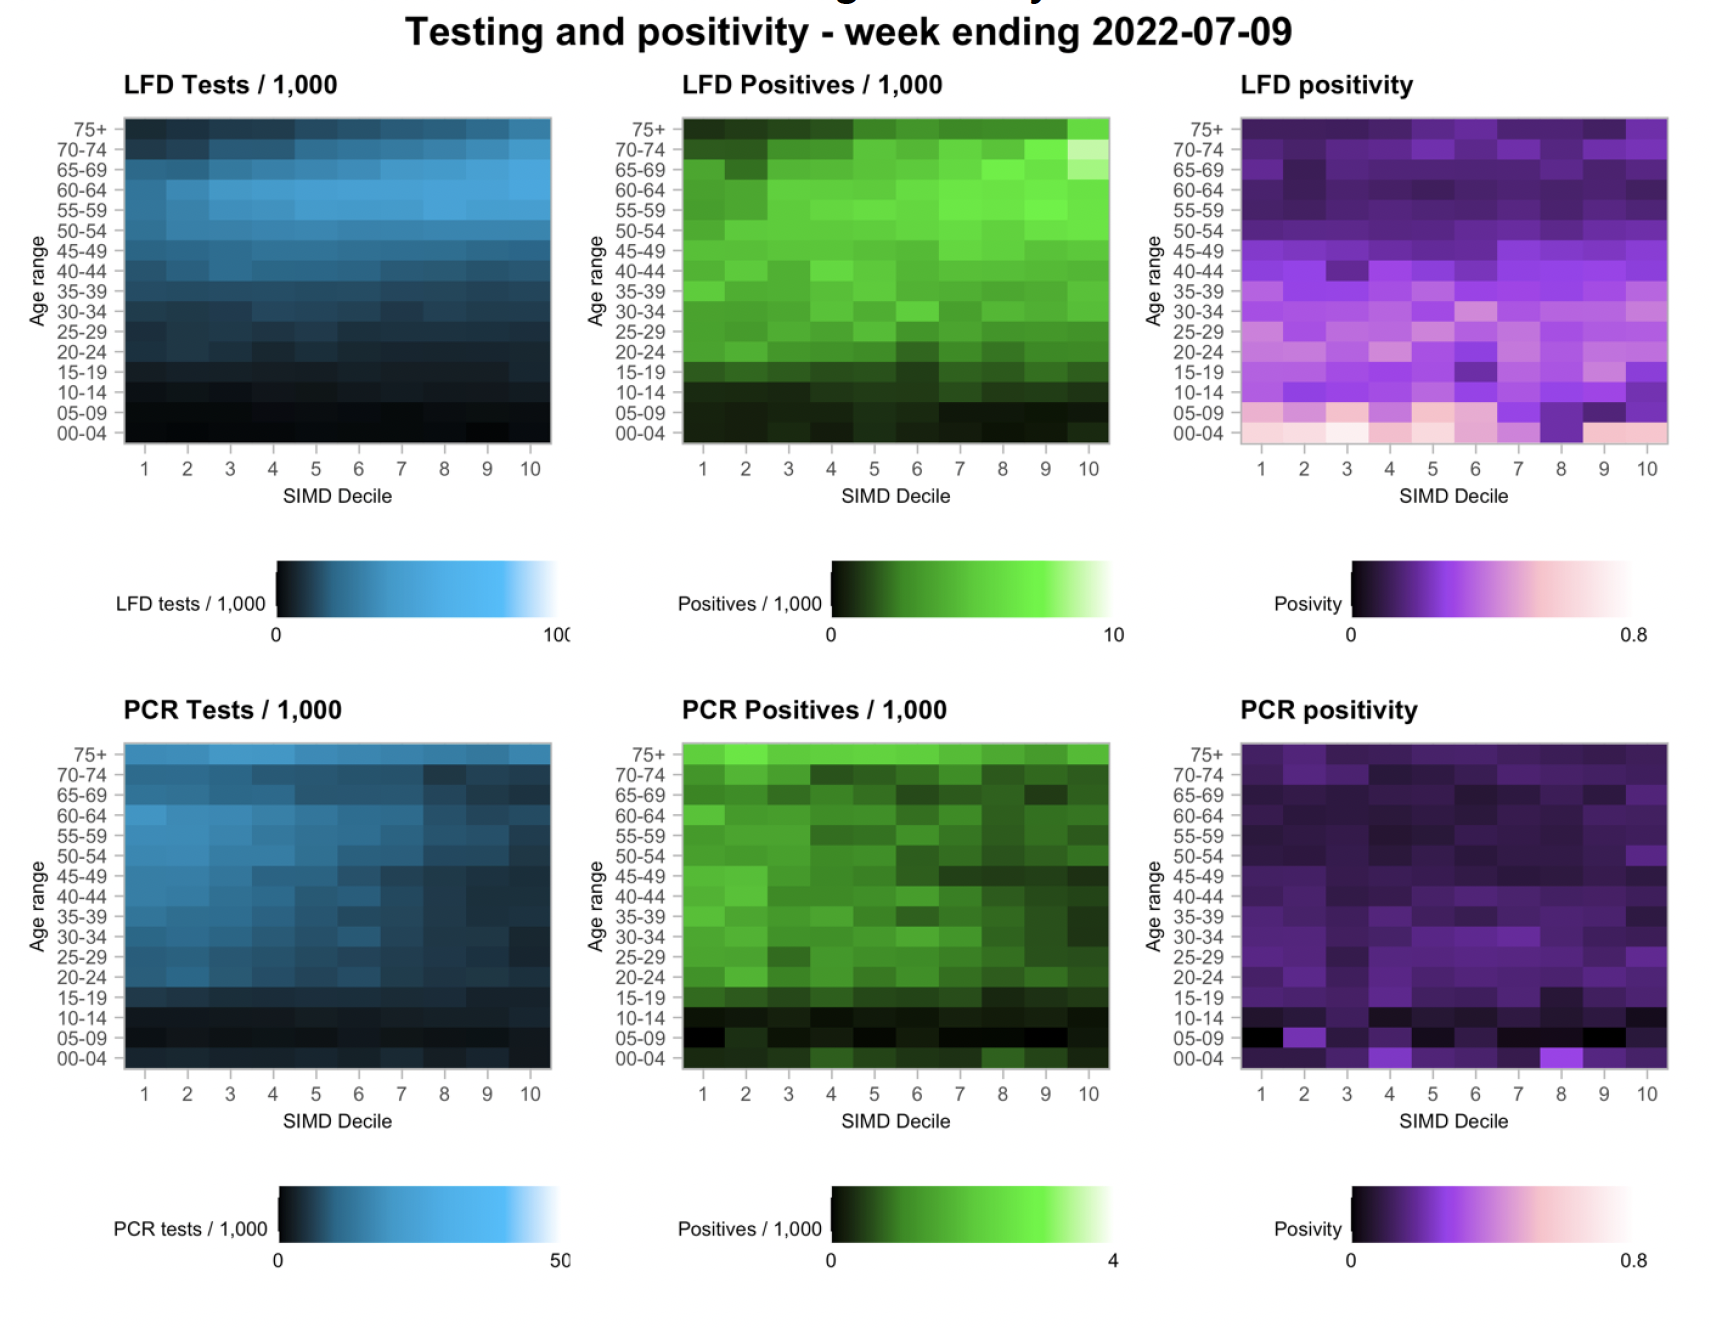
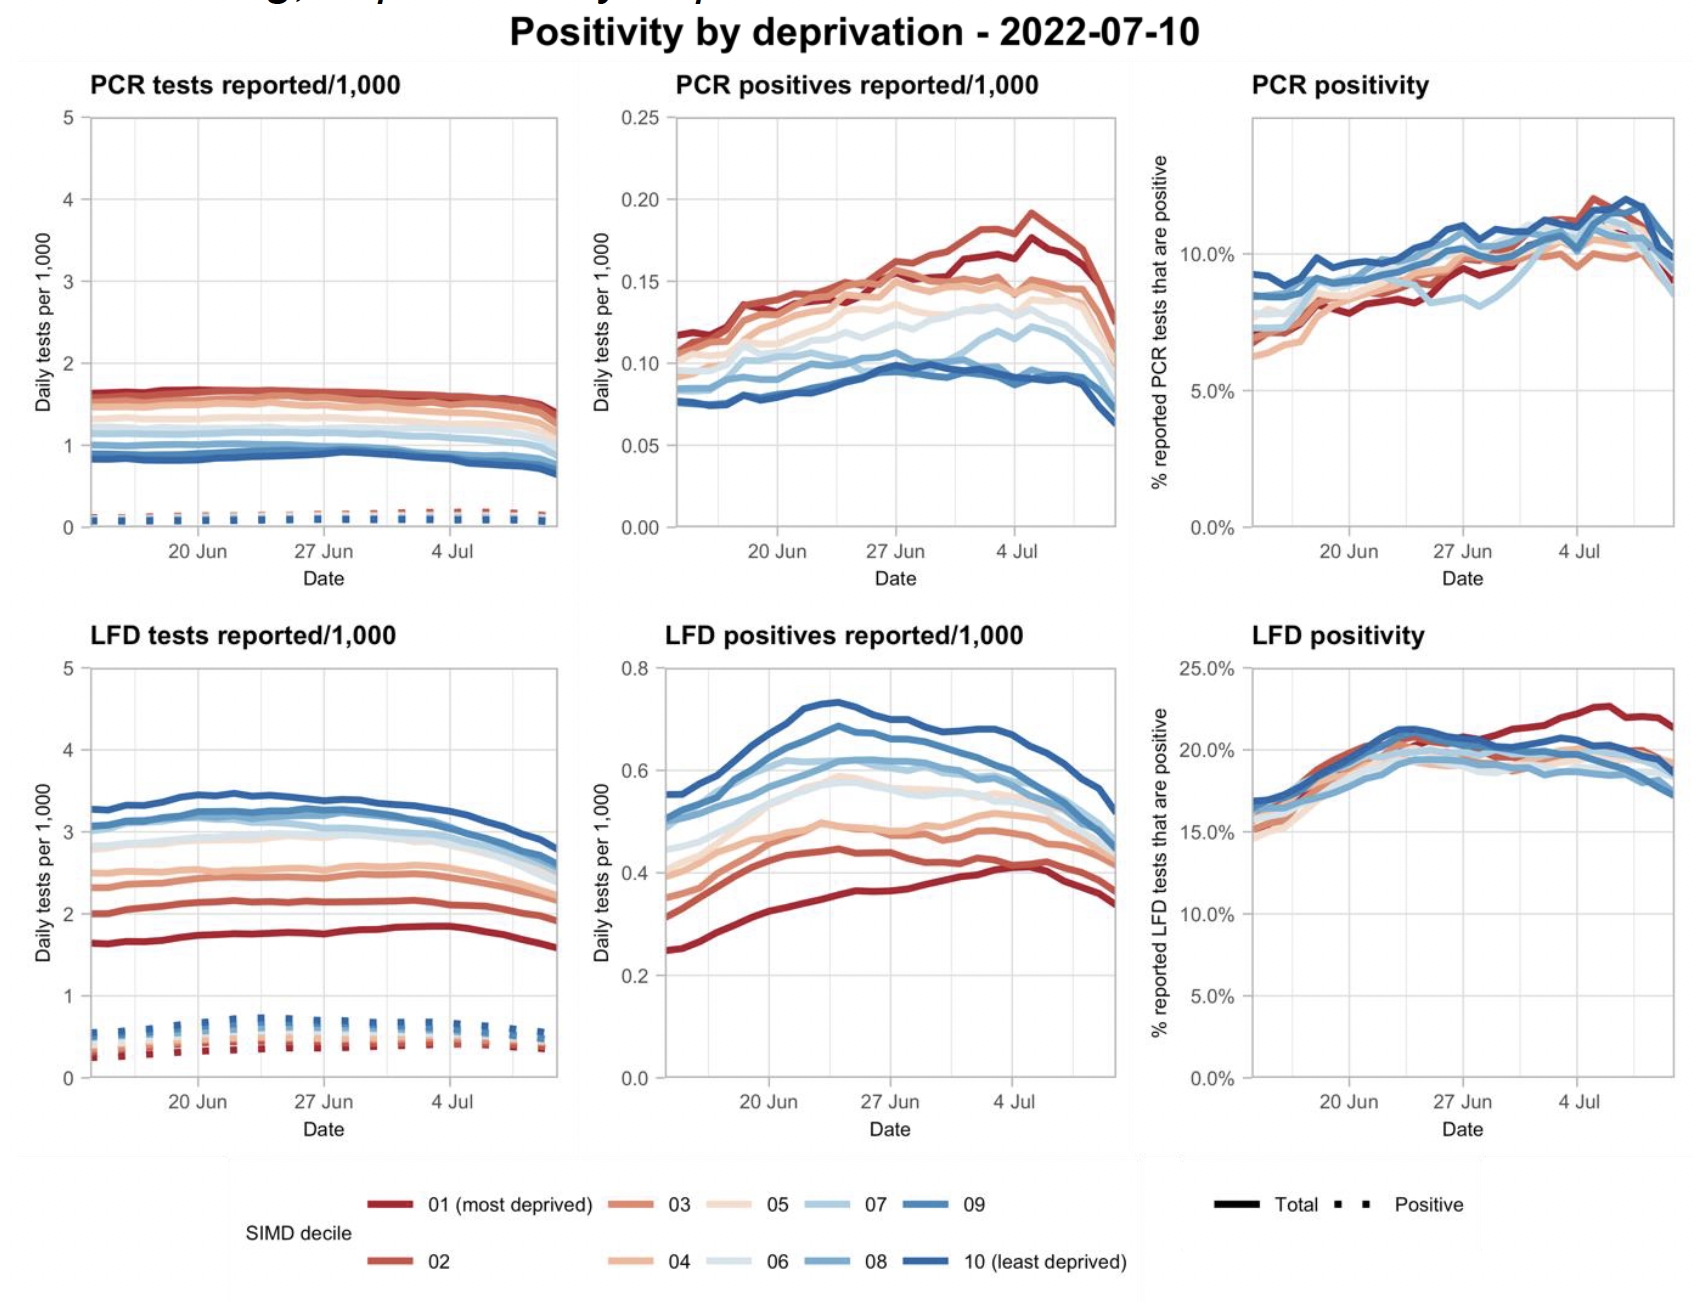
- The data show a small fall in reported tests across all deprivation deciles, and but a stabilising in reported positive tests and overall positivity, with early signs of a decline. There is no clear trend in positivity with respect to deprivation, contrary to nearly all earlier periods of the epidemic where positivity was substantially higher in more deprived datazones. The volume of PCR testing remains very low.
- The distribution of lateral flow/LFD tests being reported continues to vary substantially by both age and deprivation status, with many fewer tests reported in younger adults across all deciles of deprivation, and for children in more deprived deciles. The high level of LFD positivity in the latter category is marked, and when compared to the high number of positives amongst the least deprived, consistent with under ascertainment being concentrated (and in turn higher circulation than the cases data suggest) in particular groups.
- Nationwide, during the period 1st July – 14th July Covid-19 wastewater (WW) levels varied between 90 to 160 million gene copies per person per day (Mgc/p/d). Considerable uncertainty is present, but indications are that in the most recent week of data, Covid-19 viral levels in WW are increasing.
Overview of Scottish Government Modelling
Modelling outputs are provided here on the current epidemic in Scotland as a whole, based on a range of methods. Because it takes a little over three weeks on average for a person who catches SARS-CoV-2 (the causative agent of Covid-19) to show symptoms, become sick and either die or recover, there is a time lag in what our model can tell us about any changes in the epidemic.
The Scottish Government presents outputs from two models (Epidemia and Covasim) to the Epidemiology Modelling Review Group (EMRG), both using wastewater-derived data. These outputs are included in Figure 1.
The R value and growth rates are also estimated by several independent modelling groups based in universities and the UKHSA. Estimates are considered, discussed and combined at the EMRG, which sits within UKHSA. These are based on data up to 18th July.
The consensus view of the UKHSA across these methods was that the value of R in Scotland is between 0.9 and 1.1 as of 5th July 2022 (Figure 1). The lower and upper limits have both decreased since previous publication. R is an indicator that lags by two to three weeks.
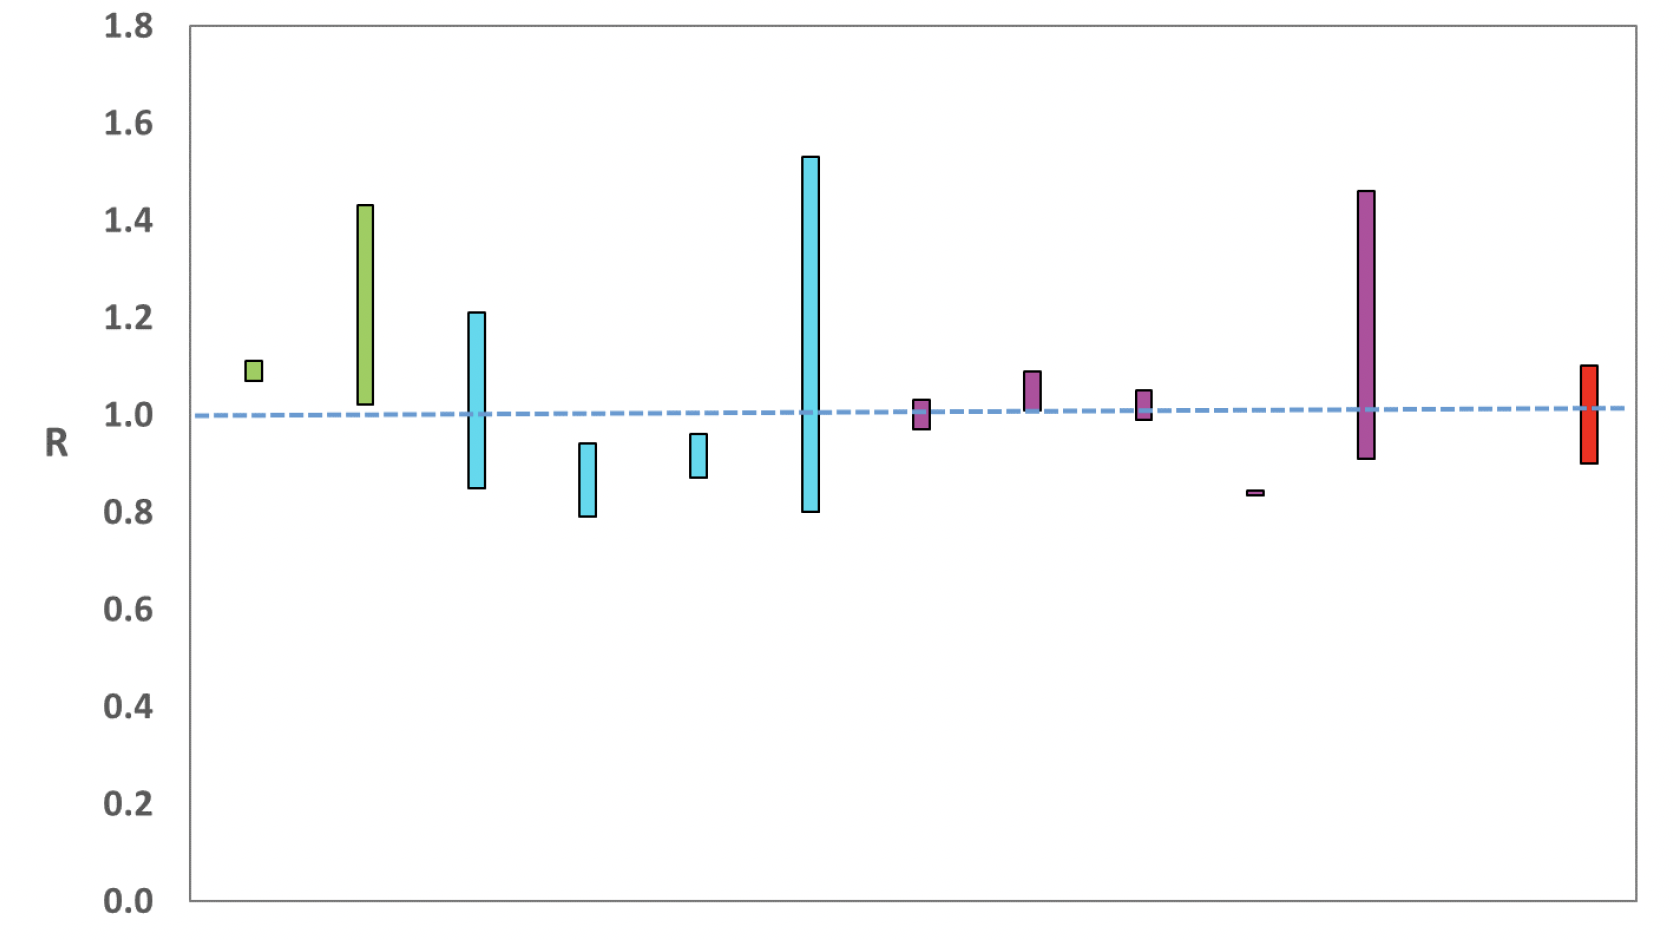
Source: EMRG
The consensus from UKHSA is that the growth rate in Scotland is between -2% and 2% per day as at 5th July. The lower and upper limits have both decreased since last publication.
The various groups which report to EMRG use different sources of data in their models to produce estimates of incidence (Figure 2). The consensus view of the UKHSA across these methods, as at 5th July, was that the incidence of new daily infections in Scotland was between 513 and 1,044 new infections per 100,000. This equates to between 28,000 and 57,100 people becoming infected each day in Scotland.
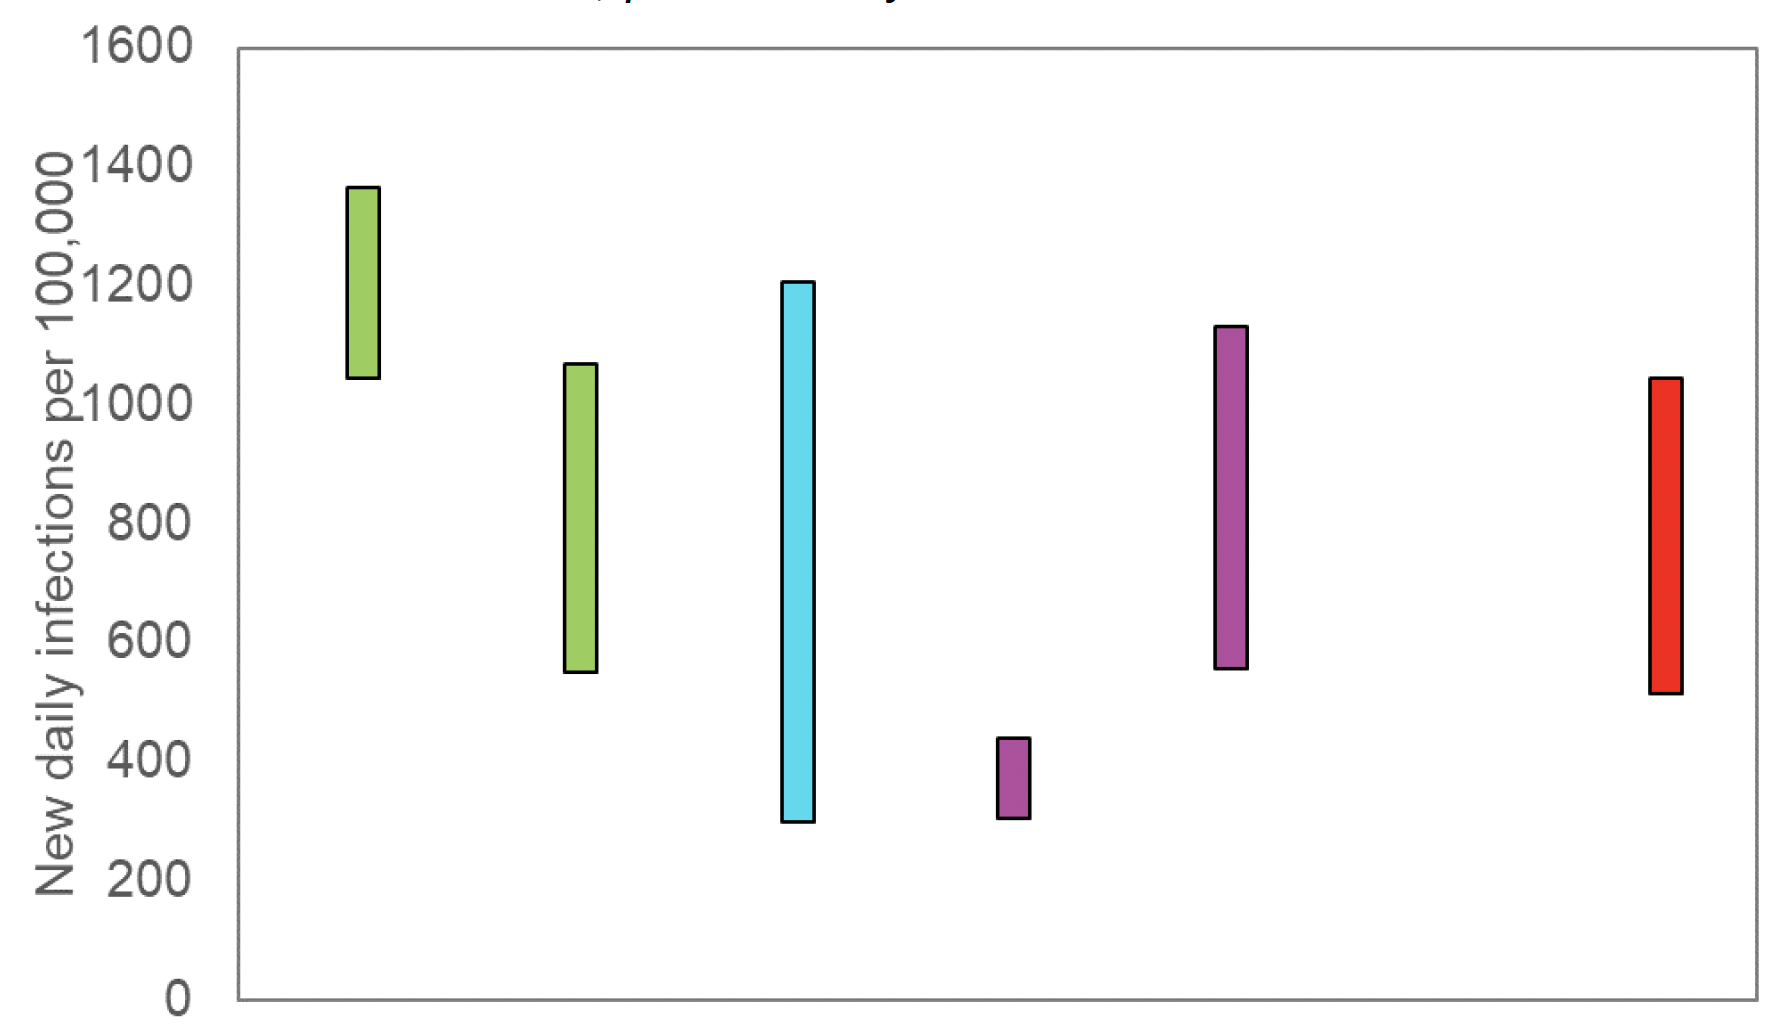
Source: EMRG
What we know about how people's contact patterns have changed
Prior to the Covid-19 pandemic, the average daily contacts for adults in the UK were reported to be 10.8 from the UK-wide POLYMOD study[1].
Average contacts from the most recent wave of the Scottish Contact Survey (7th July - 13th July) indicate an average of 4.0 contacts. This has decreased by 33% compared to the previous wave of the survey (23rd June - 29th June) where average contacts were 6.0, as seen in Figure 3.
Mean contacts within the work and other setting (contacts outside home, school and work) have decreased by 54% and 30% respectively over the last two weeks. Contacts within the home have increased by 7% over the same period.
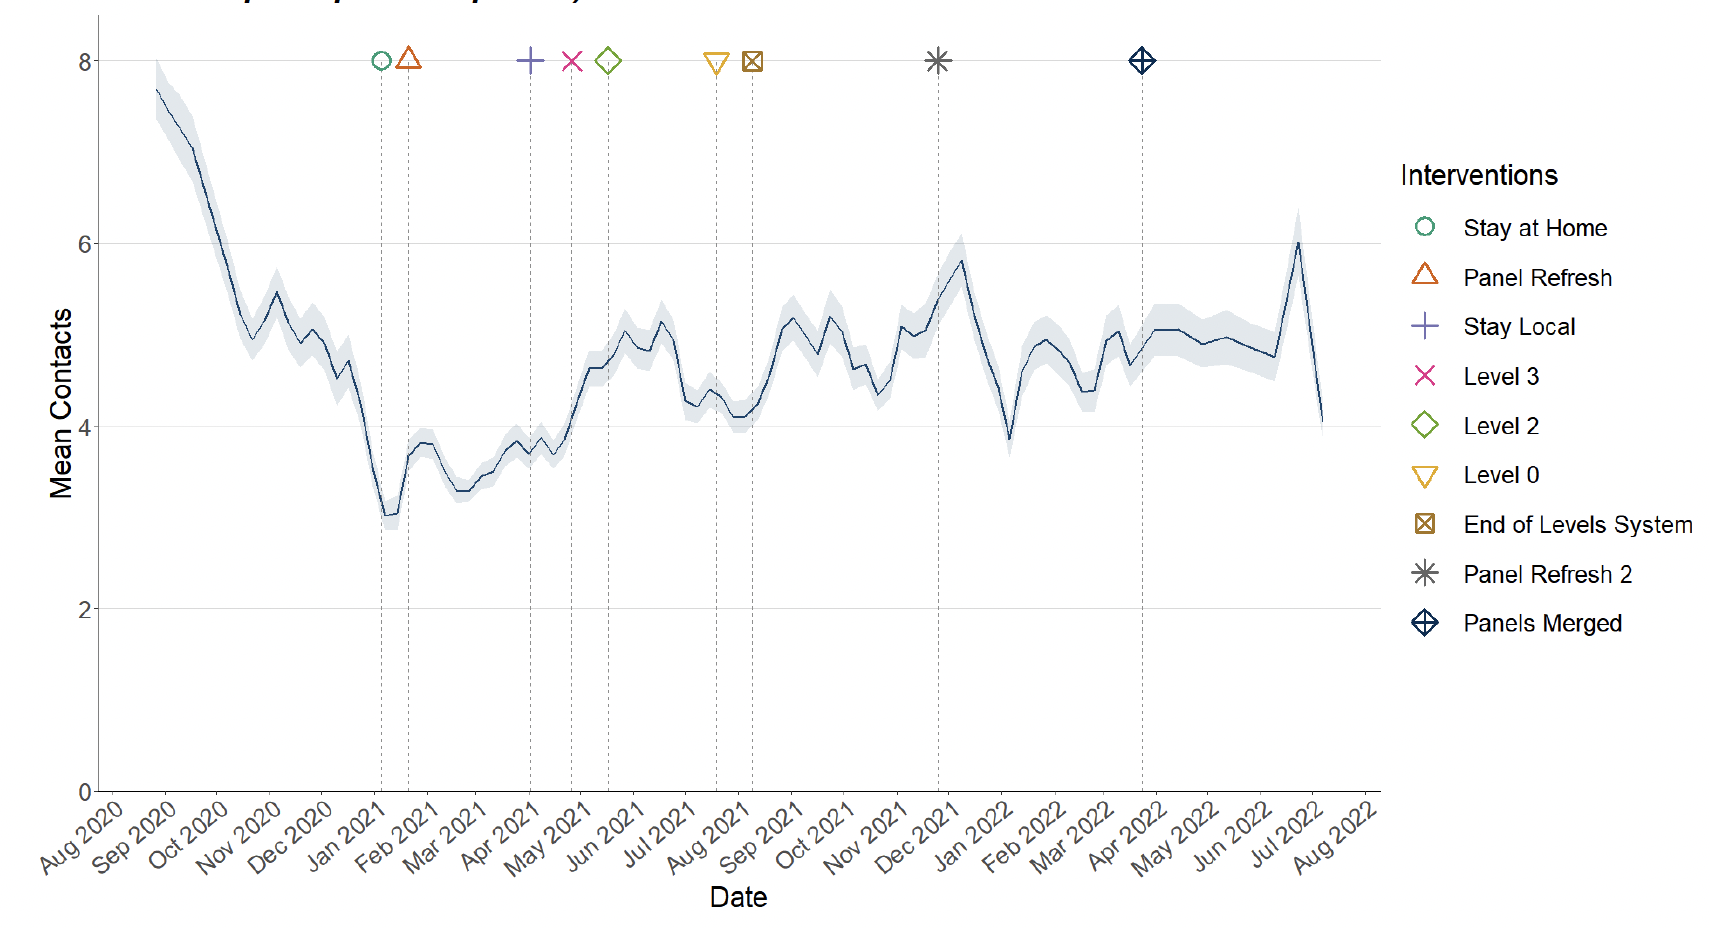
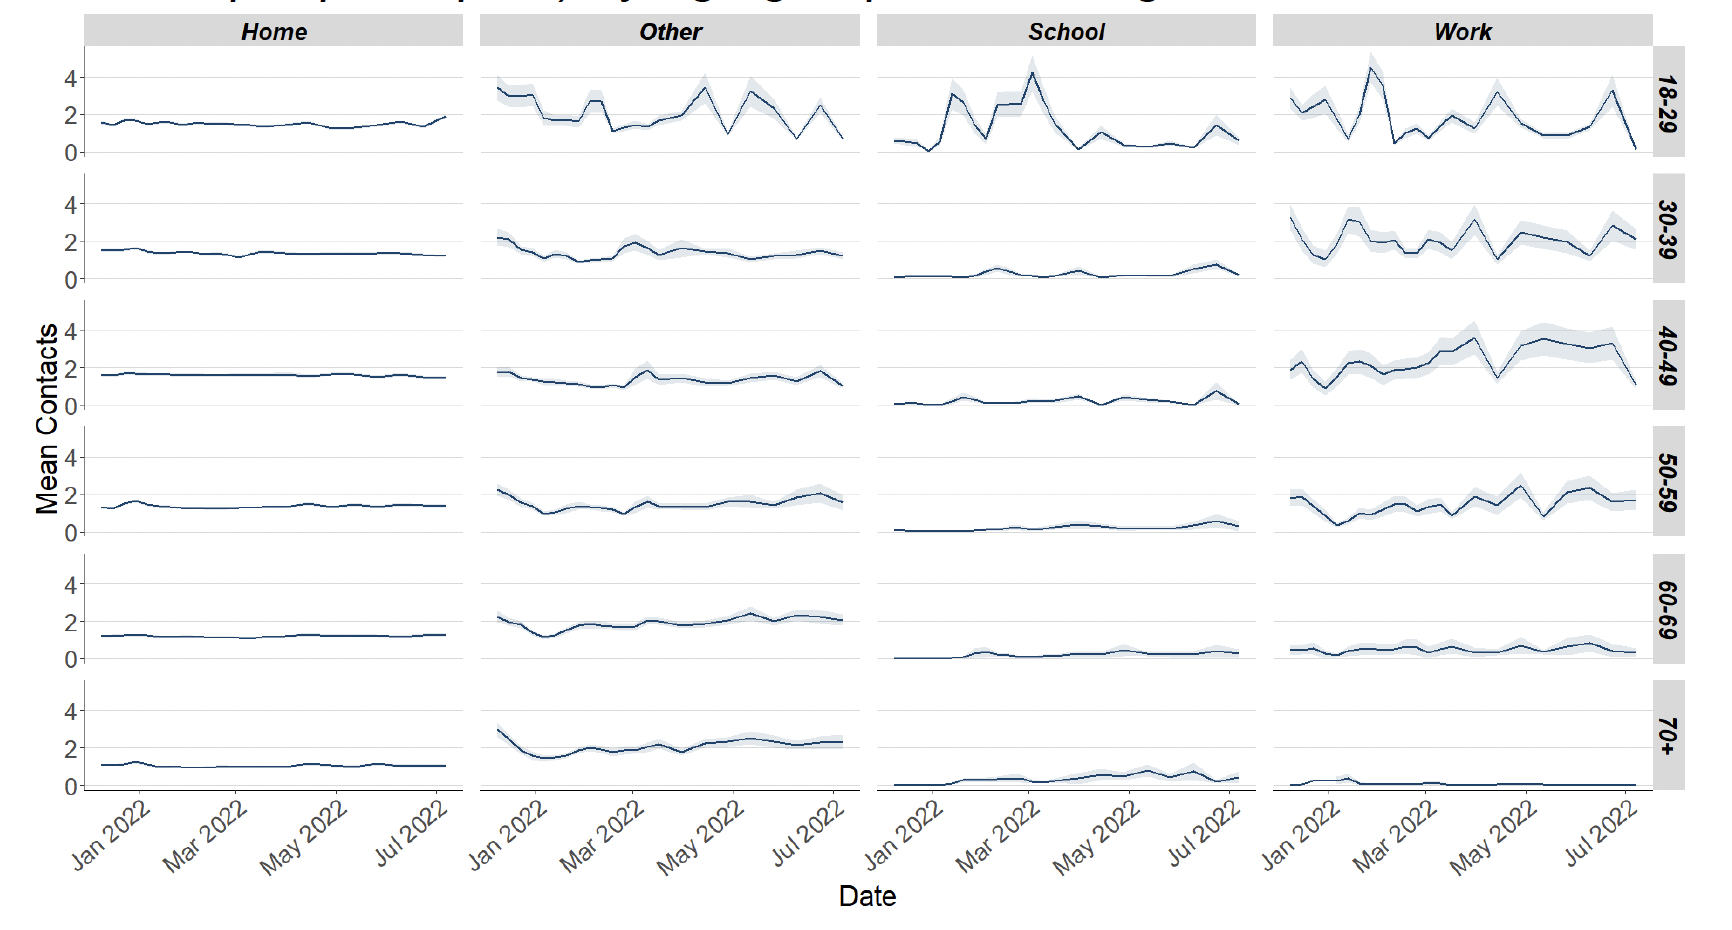
Figure 4 shows how contacts change across age group and setting. Average contacts have decreased in all age groups with the exception of those over 70 who have reported an increase by 8%. Those within the 18-29 age group have reported the biggest decrease over the last two weeks which has been largely driven by a reduction in contacts within the workplace.
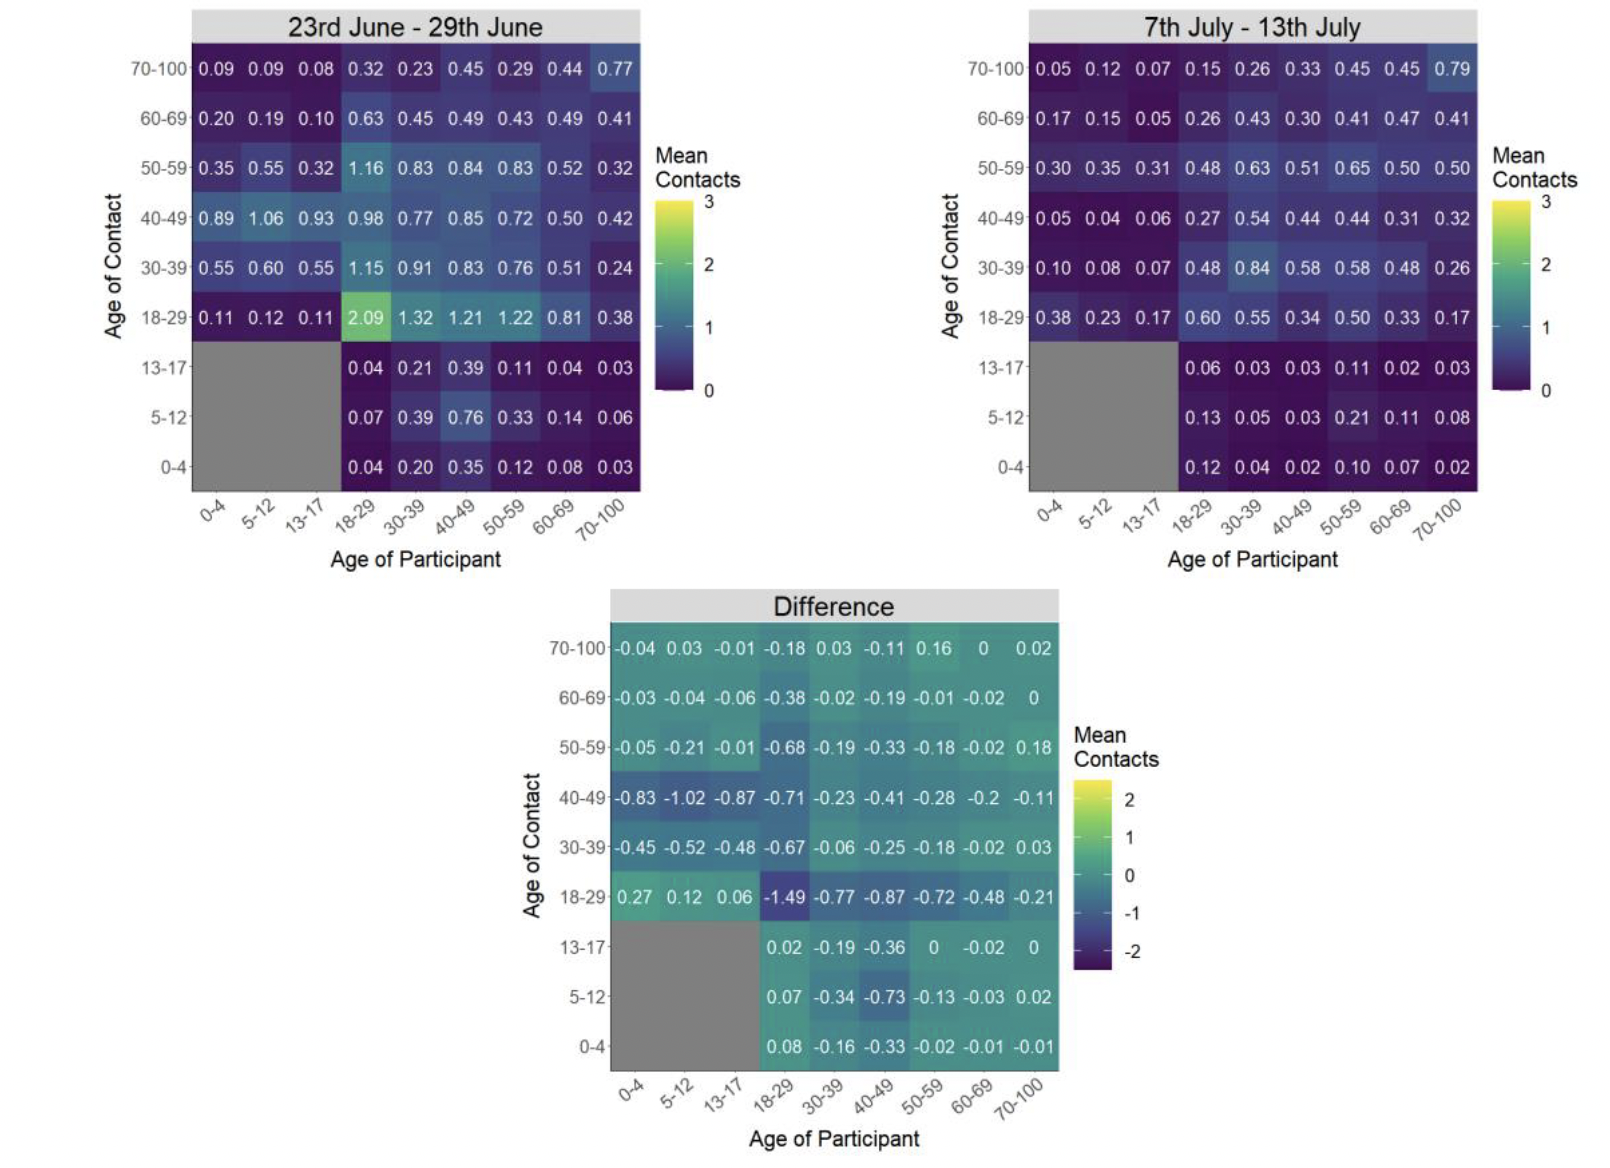
The heatmaps in Figure 5 show the mean overall contacts between age groups for the surveys relating to 23rd June - 29th June and 7th July - 13th July and the difference between these periods. The biggest reduction in interactions is observed between the those within the 18-29 age group with each other.
The biggest decreases in the proportion of participants visiting different locations are seen in those using public transport, decreasing from 32% to 29% and individuals attending the workplace, decreasing from 33% to 30% as shown in Figure 6.
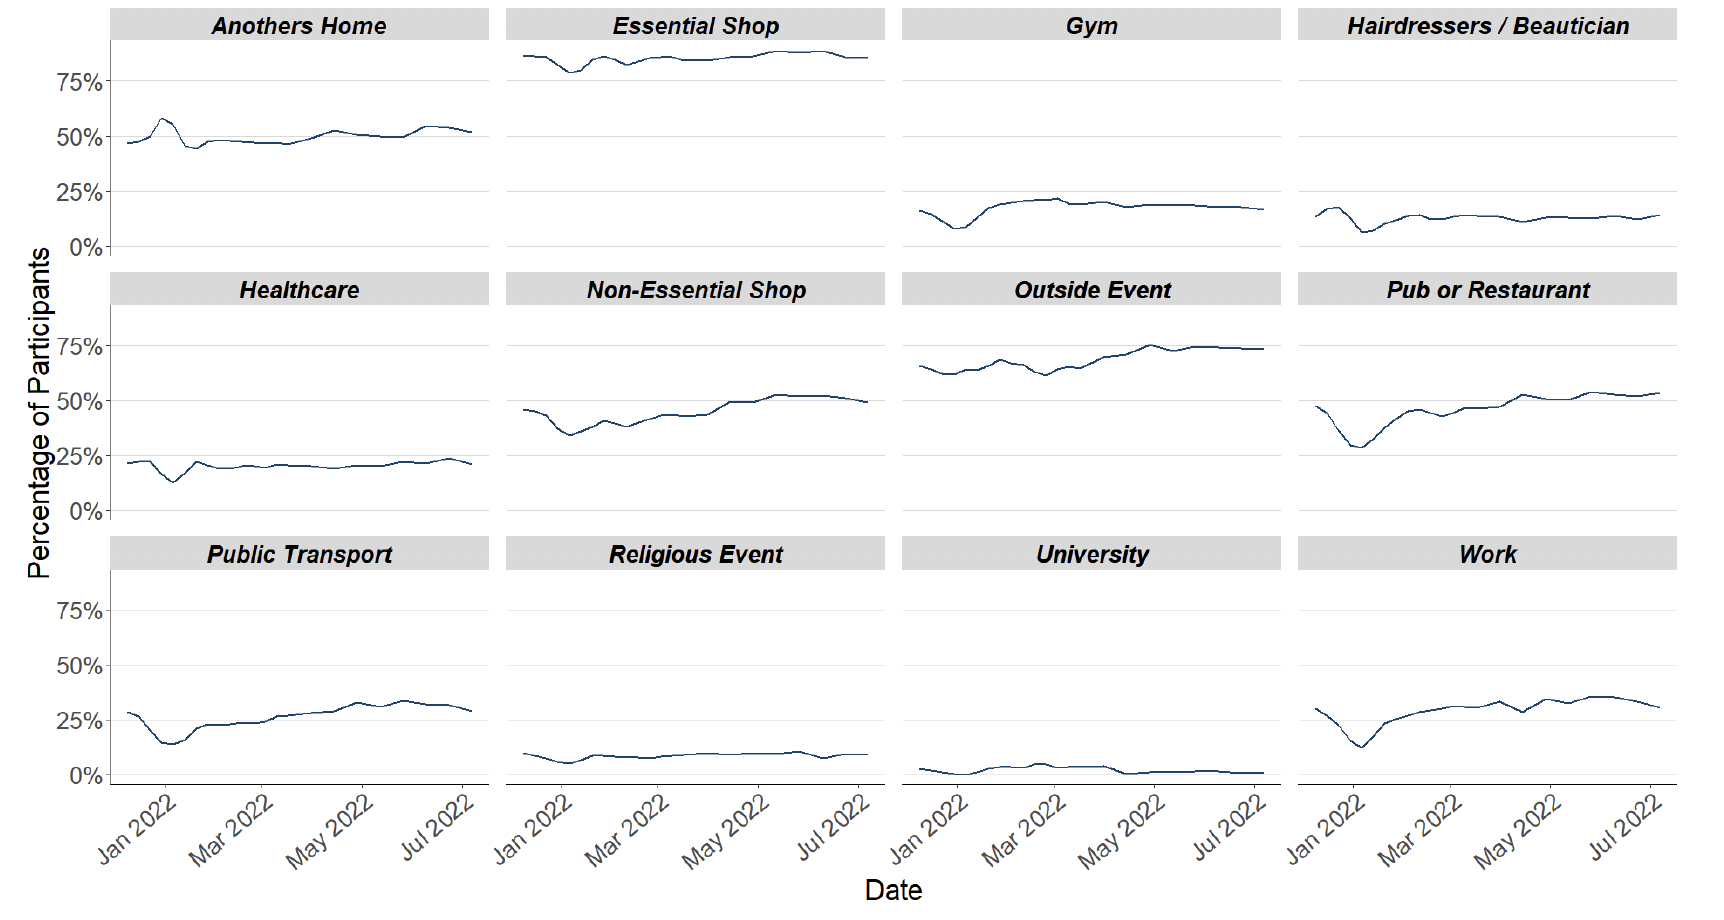
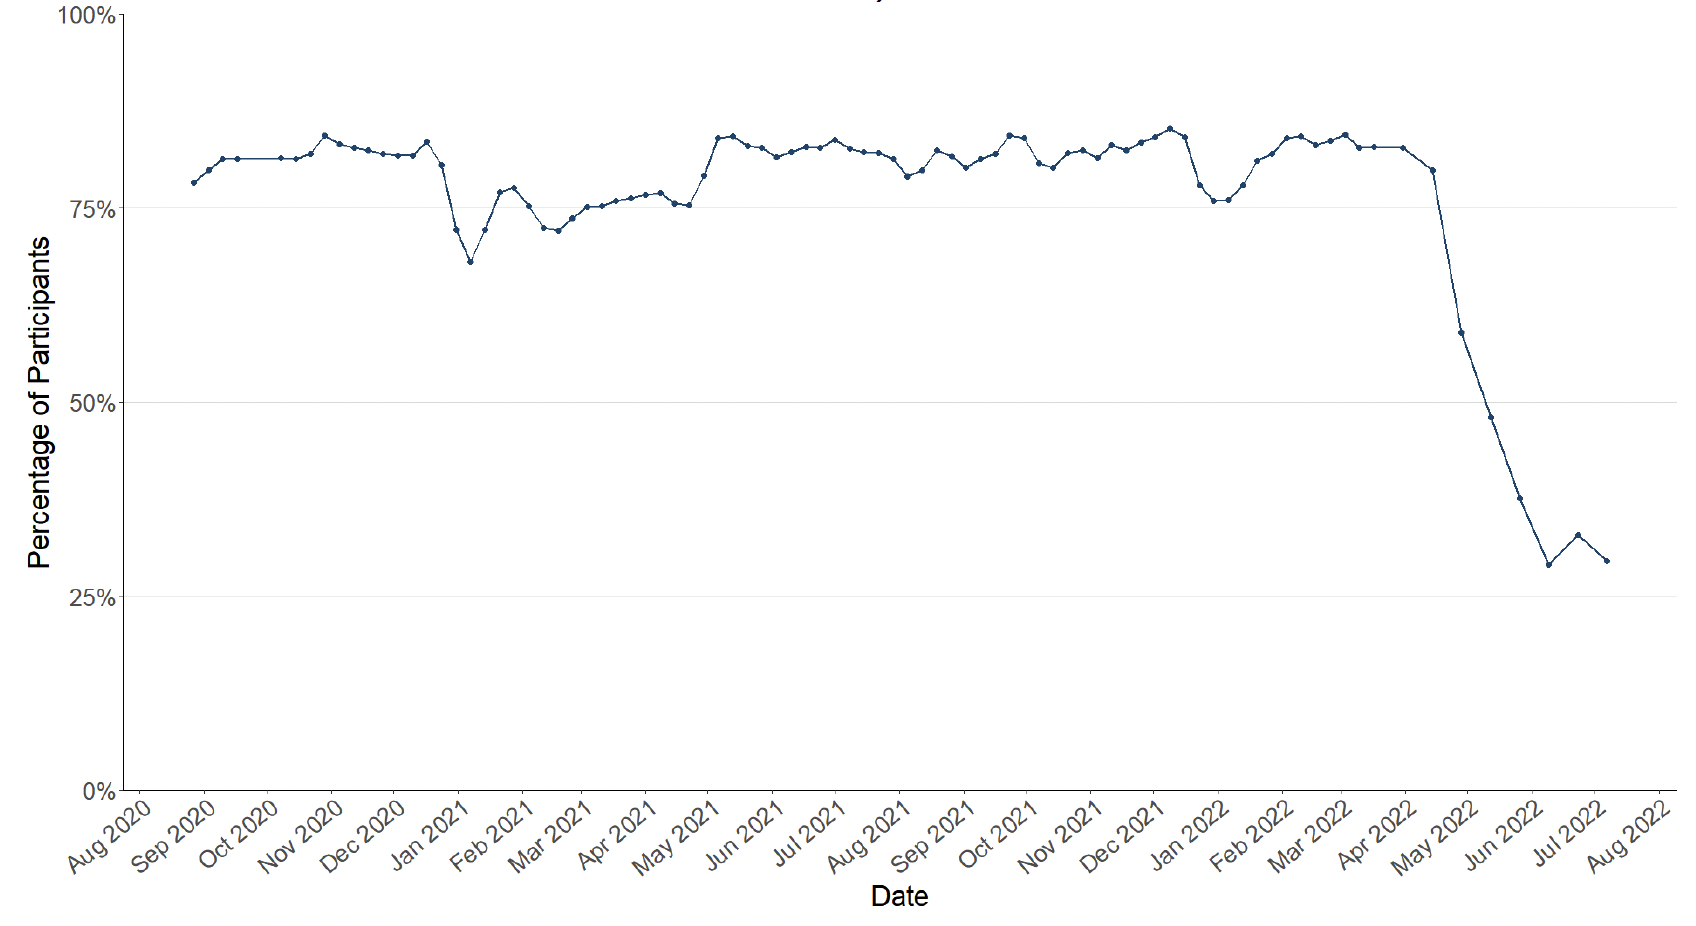
Figure 7 shows the percentage of people wearing a face covering where they have at least one contact outside of the home. This has decreased from 33% to 30% since the last wave of the survey.
In the survey pertaining to 7th July - 13th July, 46% of people had taken at least one lateral flow test in the previous 7 days, remaining the same as in the previous wave of the survey pertaining to the 23rd June - 29th June.
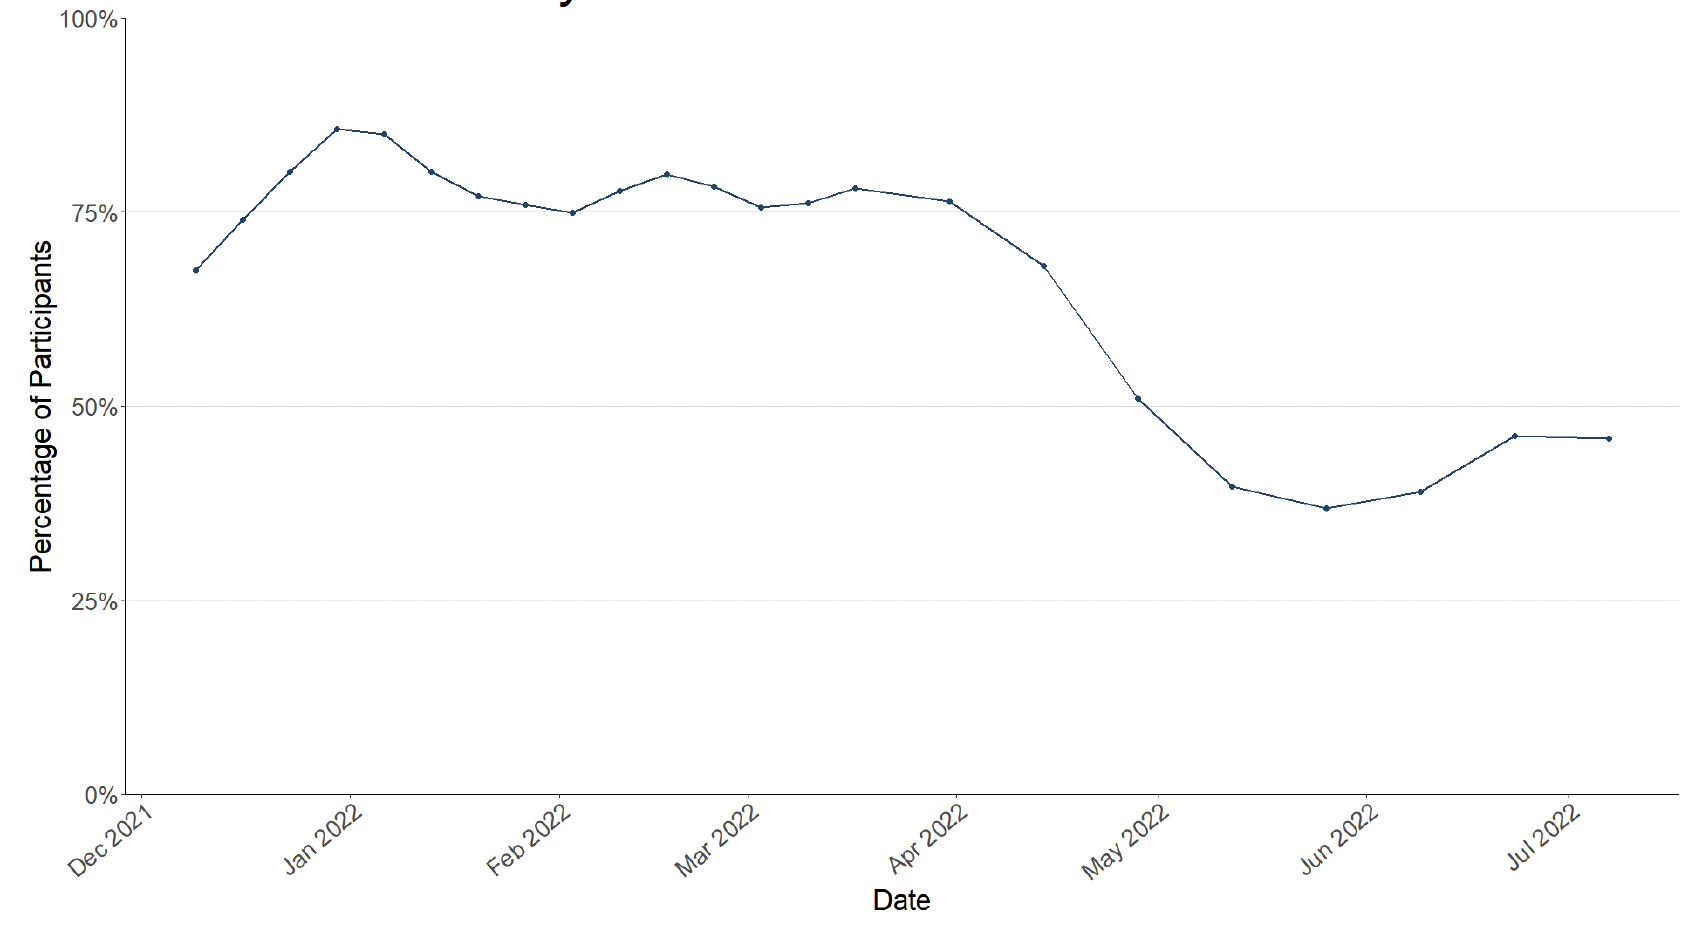
Figure 9 shows that 54% of participants believe they have had Covid-19 at least once since March 2020. Of those who think they have had Covid-19, 94% have had this confirmed through a test.
What the modelling tells us about projections of hospitalisations and hospital occupancy in the medium term
SPI-M-O produces projections of the epidemic (Figures 10 - 11), combining estimates from several independent models. These projections are not forecasts or predictions. They represent a scenario in which the trajectory of the epidemic continues to follow the trends that were seen in the data available to 18th July and do not include the effects of any future policy or behavioural changes. The delay between infection, developing symptoms and the need for hospital care means they cannot fully reflect the impact of behaviour changes in the two to three weeks prior to 18th July. The projections include the potential impact of vaccinations over the next few weeks. Modelling groups have used their expert judgement and evidence from UKHSA, Scottish Universities & Public Health Scotland, and other published efficacy studies when making assumptions about vaccine effectiveness
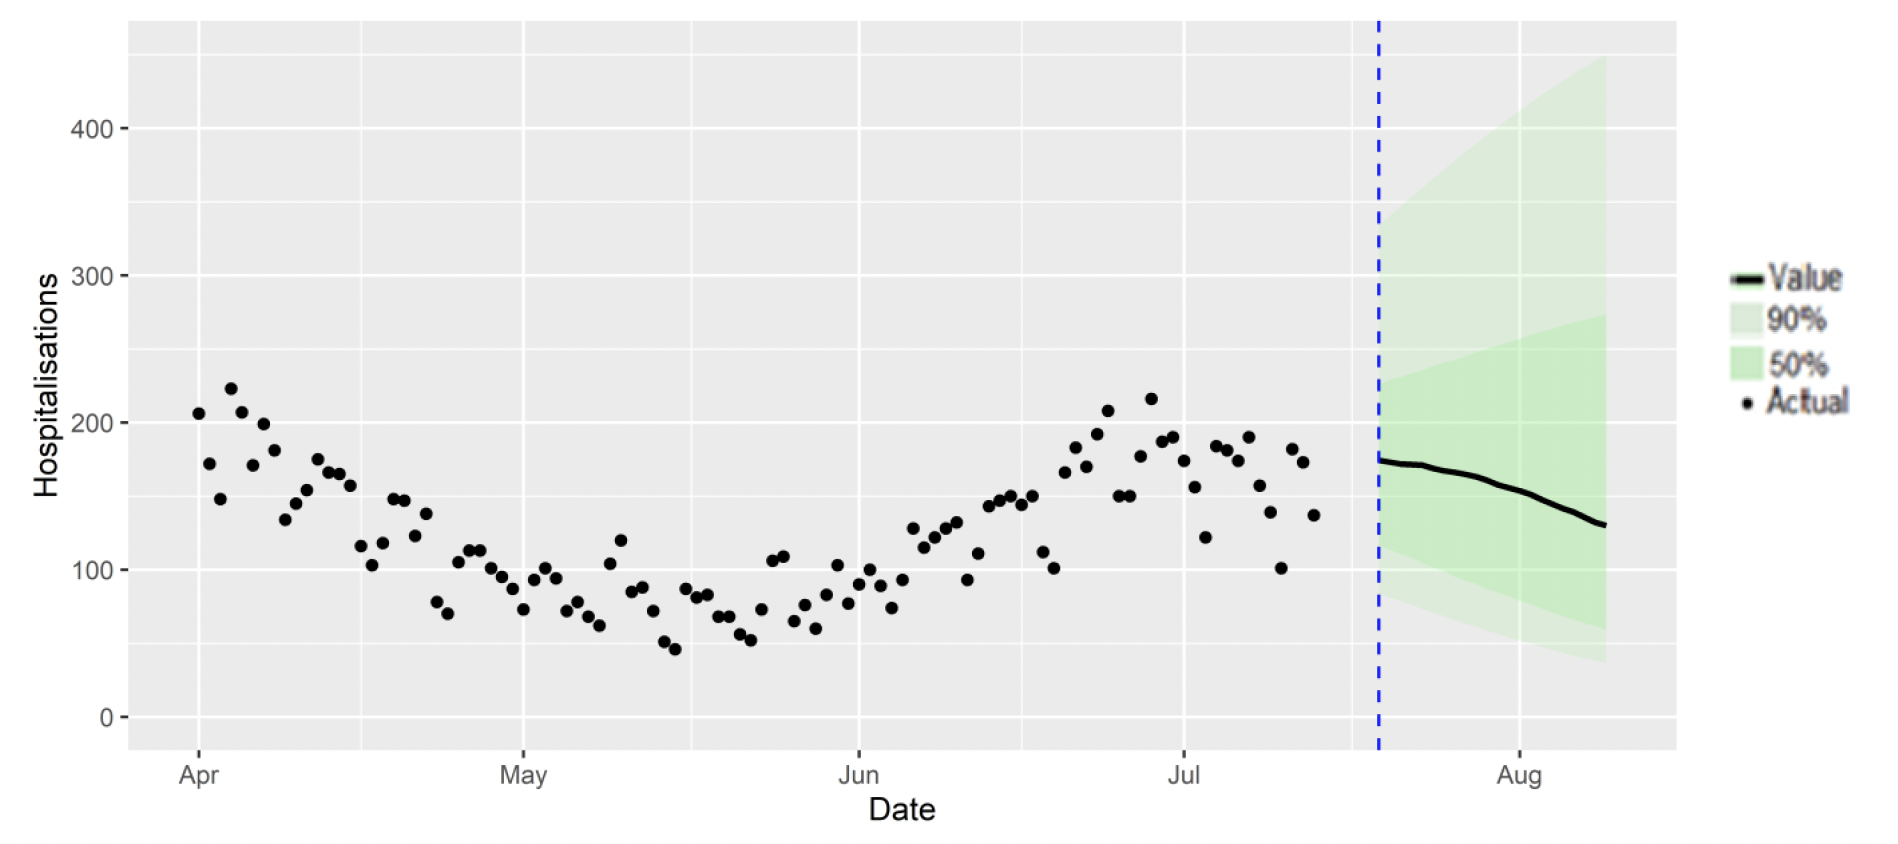
Figure 11 shows the SPI-M-O consensus on hospital occupancy. Hospital occupancy is determined by the combination of admissions and length of stay, the latter of which is difficult to model with confidence.
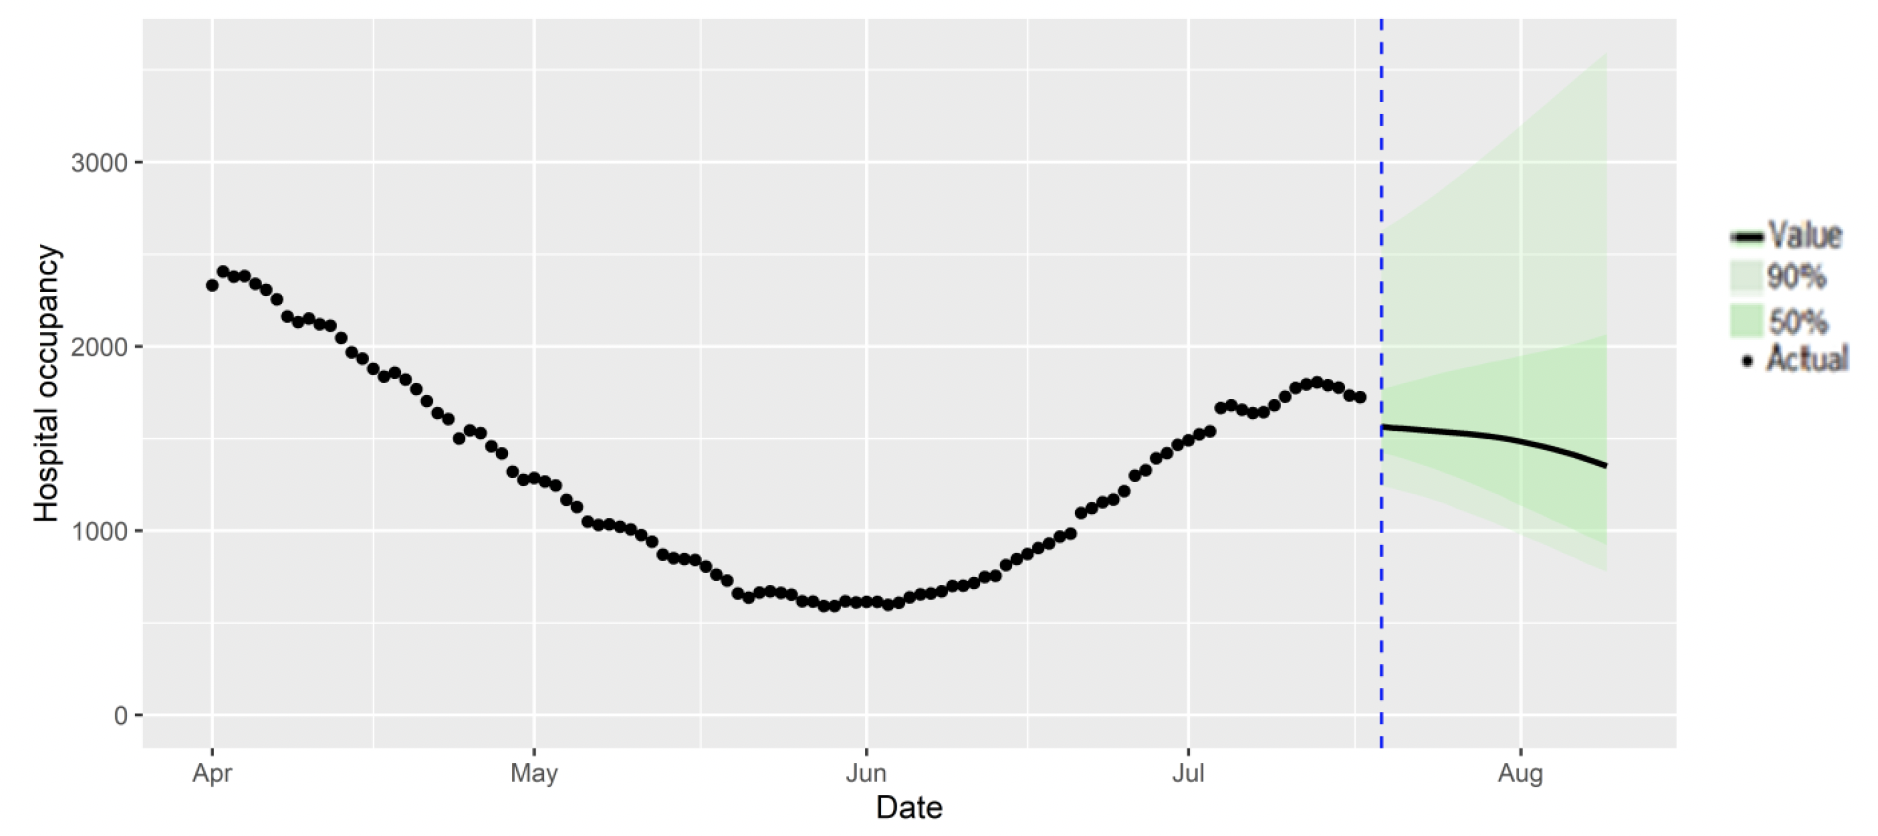
The SPI-M-O consensus view is that by 9th August, daily hospitalisations from Covid-19 in Scotland are estimated to be between 37 and 451, and hospital occupancy is estimated to be between 777 and 3,597.
Summary of spatial analysis of Covid-19 spread in Scotland
Researchers at the Edinburgh Roslin Institute have conducted spatial analysis of COVID-19 Spread in Scotland. A summary of findings from from 1st July to 14th July 2022 is included here.
Rates of LFD and PCR testing have since stabilised, albeit at substantially lower rates than those seen earlier in the epidemic.
The distribution of lateral flow/LFD tests being reported varies substantially by both age and deprivation status, with many fewer tests reported in younger adults across all deciles of deprivation, and for children in more deprived deciles. The high level of LFD positivity in the latter category is marked, and when compared to the high number of positives amongst the least deprived, suggests that ascertainment may be lower in younger people in deprived areas.
What can analysis of wastewater samples tell us about local outbreaks of Covid-19 infection?
Levels of Covid-19 RNA in wastewater (WW) collected at a number of sites around Scotland are adjusted for population and local changes in intake flow rate (or ammonia levels where flow is not available). See Technical Annex in Issue 34 of Scottish Government Research Findings for the methodology. These reports are based on the most recent data available. Future updates to data may lead to small retrospective changes.
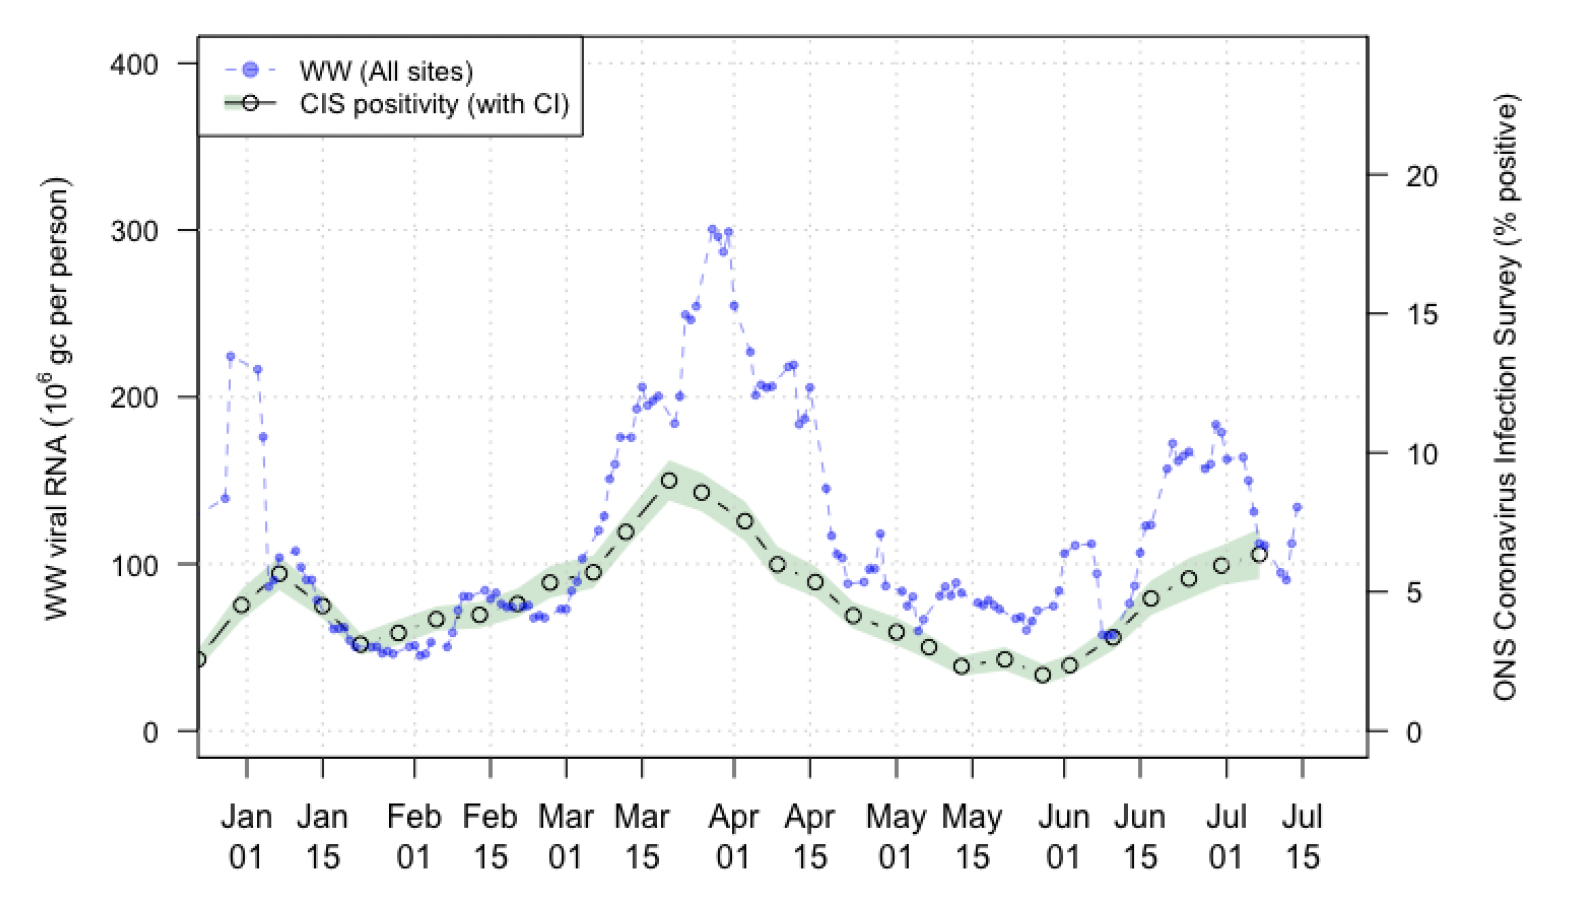
Nationwide, during the period 1st July – 14th July Covid-19 wastewater levels varied between 90 to 160 million gene copies per person per day (Mgc/p/d). Considerable uncertainty is present, but indications are that in the most recent week of data, Covid-19 viral levels in WW are increasing.
In Figure 14, we show national running average trends in wastewater RNA as of 14th July 2022. In recent reports, we have been cautious in interpreting short term changes in viral RNA in wastewater because their pattern of variability may not necessarily have been driven by changes in population viral loads. In particular, lab quality control data indicates that the decline from the 4th of July seen in this graph may not be accurate and population viral loads may actually have remained level, or even increased during this period. This would be consistent with the ONS Coronavirus Infection Survey (CIS) estimate which shows a slow increase, although such survey data is only available up to 7th July.
Regardless of this considerations, overall, the data (including quality control data) is supportive of an increase in Covid-19 RNA levels in WW after 11th July.
What next?
Archiving of models is currently being undertaken via the Data Science Scotland GitHub organisation. Details of the Medium Term Projections Model has most recently been made available. This model has been peer reviewed by Edinburgh University. Details of the Epidemia model has also been made available. More models will be added over the coming weeks - see the Technical Annex of issue 96 for further details.
In future publications we will continue with our section Looking to the Future.