Consideration of climatic factors within Strategic Environmental Assessment (SEA)
Guidance on the consideration of climatic factors within Strategic Environmental Assessment (SEA), developed by the Scottish Environmental Protection Agency (SEPA).
5. UK CLIMATE PROJECTIONS
5.1 The UK Climate Projections have been created to help the UK to plan for a changing climate. The most recent work on climate projections ( UKCP09) was launched on 18 th June 2009. This contains information on observed and future climate change, based on the latest scientific understanding. More information can be found at the introductory site http://ukcp09.defra.gov.uk and the technical site http://ukclimateprojections.defra.gov.uk .
5.2 UKCP09 provides information on how the UK's climate is likely to change in the 21st century, as it responds to rising levels of greenhouse gases in the atmosphere. The projections are based on different emissions scenarios and can be presented for varying levels of probability. They show the effects of current levels of emissions, and also what would happen if emissions were to increase or decrease. The data offer greater accuracy and understanding of possible scenarios. Although it is not possible to predict with 100% certainty exactly how much the climate will change by a given time, UKCP09 sets out the amount of change and the associated probability of being less than, or greater than, each value at a given point in time. It is also important to note that the next 30 to 40 years of climate change are determined by the current levels of emissions in the system and are therefore highly likely. Regardless, uncertainty should not form a barrier to adaptation. Robust options within a range of scenarios can be viewed as planning for resilience in any case.
5.3 UKCP09 gives information about the changing climate (e.g. precipitation) but not the effects the climate may have (e.g. whether or where it might flood). The UKCP09 information can be used to feed into risk assessments of what the impacts of a changing climate might be, for example, rail networks, habitats, health services or coastal defences.
5.4 The UKCP09 projections are set out on maps (an example is provided in Figure 4 below) that show a range of climate change scenarios depending on future emissions. The scenarios cover average and maximum temperatures, precipitation, humidity and cloud levels. The maps cover 25km grid squares and can be searched by regional areas of Scotland and by river basins.
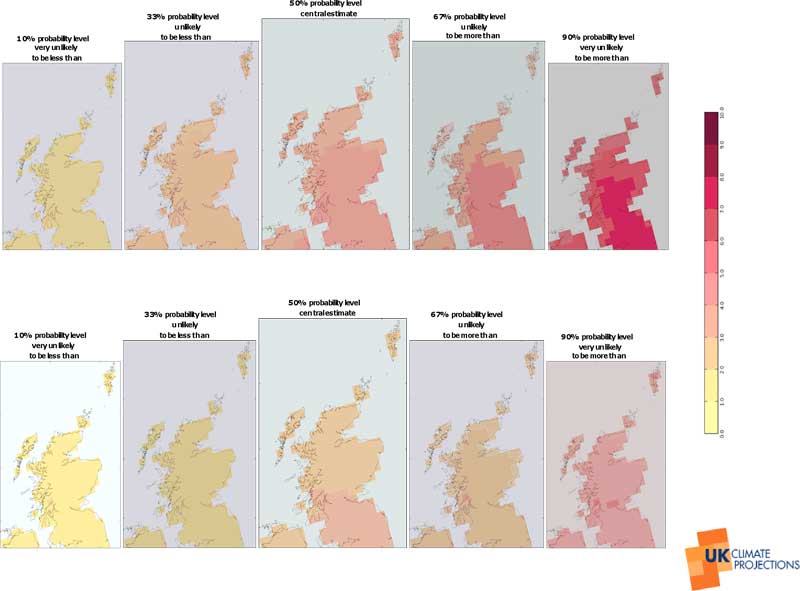
Figure 4 - Example maps from UKCP09 showing annual mean temperature change for high emissions scenario 7 .