Scenario mapping for offshore renewable energy development economic benefits: case studies
Report to identify, measure and value the delivered and potential economic impact for Scotland from offshore wind and tidal energy projects.
4. As-is analysis
4.1. Beatrice Offshore Wind Farm
Scottish supply chain used for Beatrice wind farm included the following:
- A number of activities during the development phase were carried out in Scotland, including SSE’s internal project management, and some of the surveys.
- Wick was selected as the OMS base, and the port of Nigg was used as an installation port.
- BiFab supplied 26 of the jacket foundations for the project.
We drew primarily on SSE’s published report by Biggar Economics on the economic impacts of Beatrice[2].
The costs used for the Beatrice project were based on figures for a similar UK project. We adjusted the costs to reflect the differences between this original project and the Beatrice project using BVGA’s experience of cost modelling.
Scottish and content
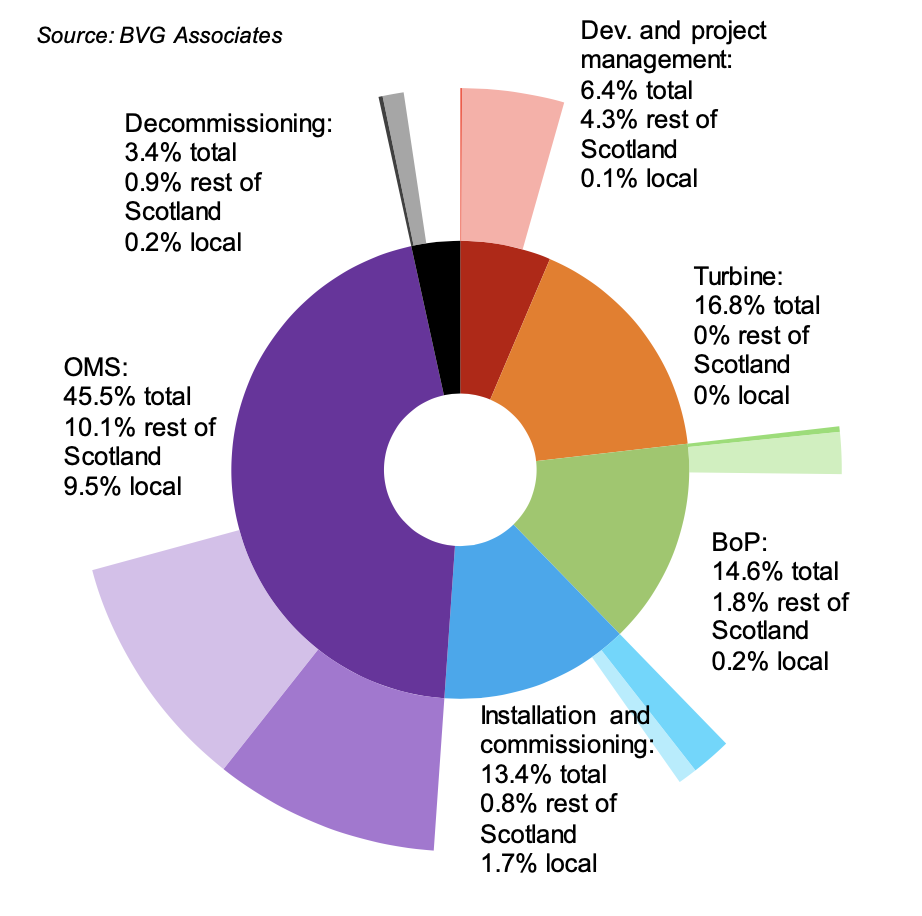
Our analysis of Beatrice wind farm shows that the overall Scottish content for the project was 29.6%, of which the local content was 11.7%. Figure 1 and Table 1 show these figures broken down by area of supply chain. It includes both generation and dedicated transmission assets. Expenditure on transmission assets ultimately owned by the OFTO is included in balance of plant, installation and commissioning, and OMS, as appropriate.
The highest Scottish content is in project development and management, where 68.5% of the total spend was in Scotland.
The highest local content was in OMS, where 21% of the spend was local.
| Level 1 category | % of total | Territory | % of category | % of total | Territory | % of category | % of total |
|---|---|---|---|---|---|---|---|
| Development and project management | 6.4% | Scotland | 68.5% | 4.4% | Local | 1.2% | 0.1% |
| Non-Scotland | 31.5% | 2% | Rest of Scotland | 67.4% | 4.3% | ||
| Turbine supply | 16.8% | Scotland | 0% | 0% | Local | 0% | 0% |
| Non-Scotland | 100% | 16.8% | Rest of Scotland | 0% | 0% | ||
| Balance of plant | 14.6% | Scotland | 13.8% | 2% | Local | 1.6% | 0.2% |
| Non-Scotland | 86.2% | 12.5% | Rest of Scotland | 12.1% | 1.8% | ||
| Installation and commissioning | 13.4% | Scotland | 18.8% | 2.5% | Local | 12.7% | 1.7% |
| Non-Scotland | 81.2% | 10.9% | Rest of Scotland | 6.1% | 0.8% | ||
| Operation, maintenance and service | 45.5% | Scotland | 43.2% | 19.7% | Local | 21% | 9.5% |
| Non-Scotland | 56.8% | 25.8% | Rest of Scotland | 22.2% | 10.1% | ||
| Decommissioning | 3.4% | Scotland | 31% | 1.1% | Local | 5% | 0.2% |
| Non-Scotland | 69% | 2.4% | Rest of Scotland | 26% | 0.9% | ||
| Total | 100% | Scotland | 29.6% | 29.6% | Local | 11.7% | 11.7% |
| Non-Scotland | 70.4% | 70.4% | Rest of Scotland | 17.9% | 17.9% |
GVA, earnings and employment
Table 2 summarises the economic impact on Scotland and locally from the Beatrice project.
Gross value-added
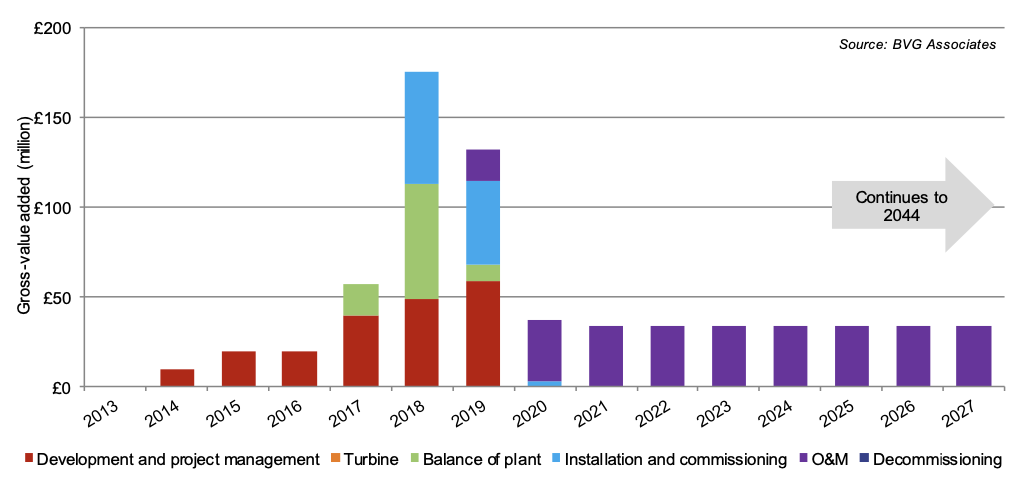
We concluded that Beatrice will generate about £1,300 million direct, indirect and induced GVA in Scotland, of which £444 million is local, over the lifetime of the wind farm. Figure 2 shows that Scottish GVA peaks at £175 million in 2018. The main contributors are balance of plant, mainly from turbine and substation foundations, and installation and commissioning, mainly from the construction of the onshore substation and cable route.
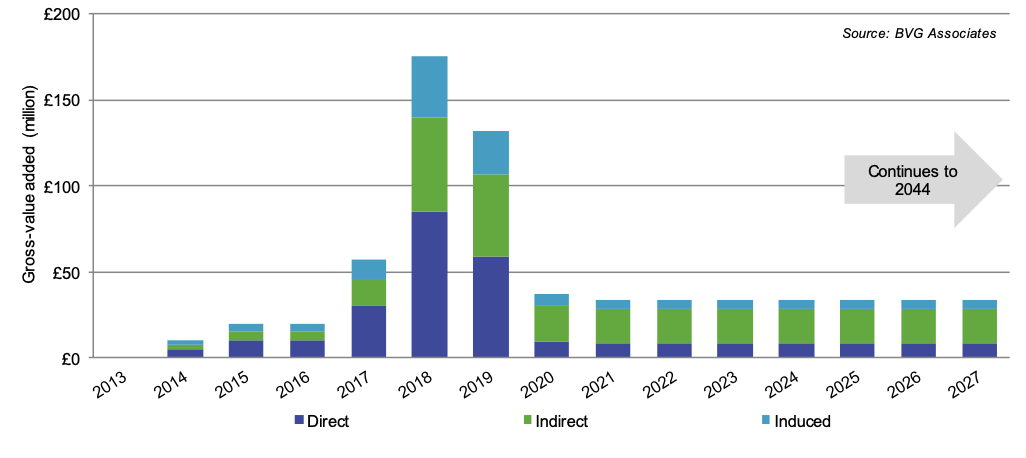
OMS will generate the greatest amount of Scottish GVA at £850 million, comprising 24% direct, 59% indirect and 17% induced GVA (see Figure 3). OMS will create £360 million locally.
| Scotland | Local | |||||||
|---|---|---|---|---|---|---|---|---|
| Impact | Direct | Indirect | Induced | Total | Direct | Indirect | Induced | Total |
| Value-added (millions) | £422 | £643 | £235 | £1,300 | £309 | £113 | £22 | £444 |
| Earnings (millions) | £256 | £180 | £70 | £506 | £189 | £31 | £7 | £227 |
| FTE years | 4,830 | 4,980 | 1,810 | 11,620 | 3,970 | 880 | 220 | 5,070 |
Employment
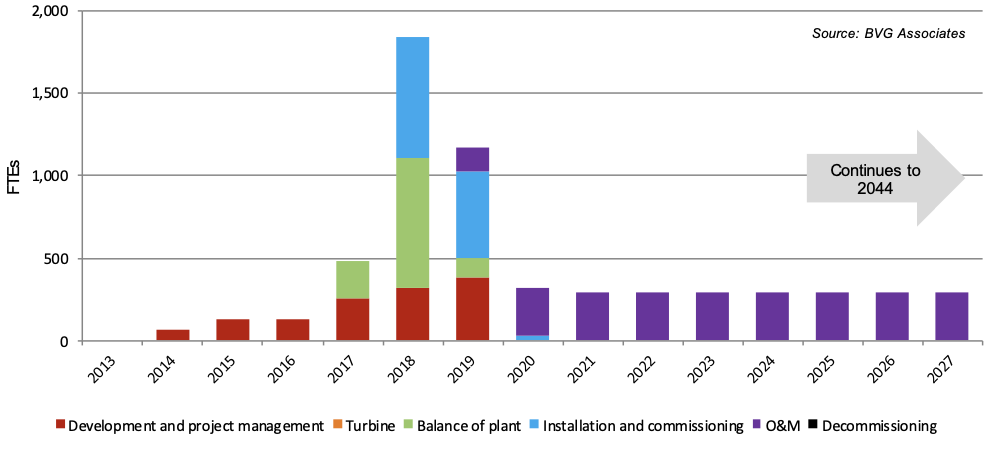
Over the lifetime of the wind farm 11,620 FTE years will have been created in Scotland, of which 5,070 will have been local. The number of FTEs created each year between 2014 and 2044, broken down by supply chain, is shown in Figure 4.
Scottish FTEs peaked in the construction and installation phase in 2018, when 1,800 FTE years were created. This comprised 56% direct, 26% indirect and 18% induced FTE years (see Figure 5).
OMS will create around 7,400 FTE years over the lifetime of Beatrice, including the permanent local work force, developer back office functions and periodic work on the wind farm. 4,070 of these OMS jobs will be local.
4.2. Neart Na Gaoithe Offshore Wind Farm
Scottish supply chain used for NNG offshore wind farm includes the following:
- The assembly of the turbines will be carried out in Port of Dundee.
- BiFab will fabricate eight of the jacket foundations.
- Eyemouth Harbour will be the OMS base.
We drew on publicly available information about contracts placed, which was used to validate the modelling.
The costs used for the NNG project were based on figures for a similar UK project. We adjusted the costs to reflect the differences between this original project and the NNG project using BVGA’s own experience of cost modelling.
Scottish and local content
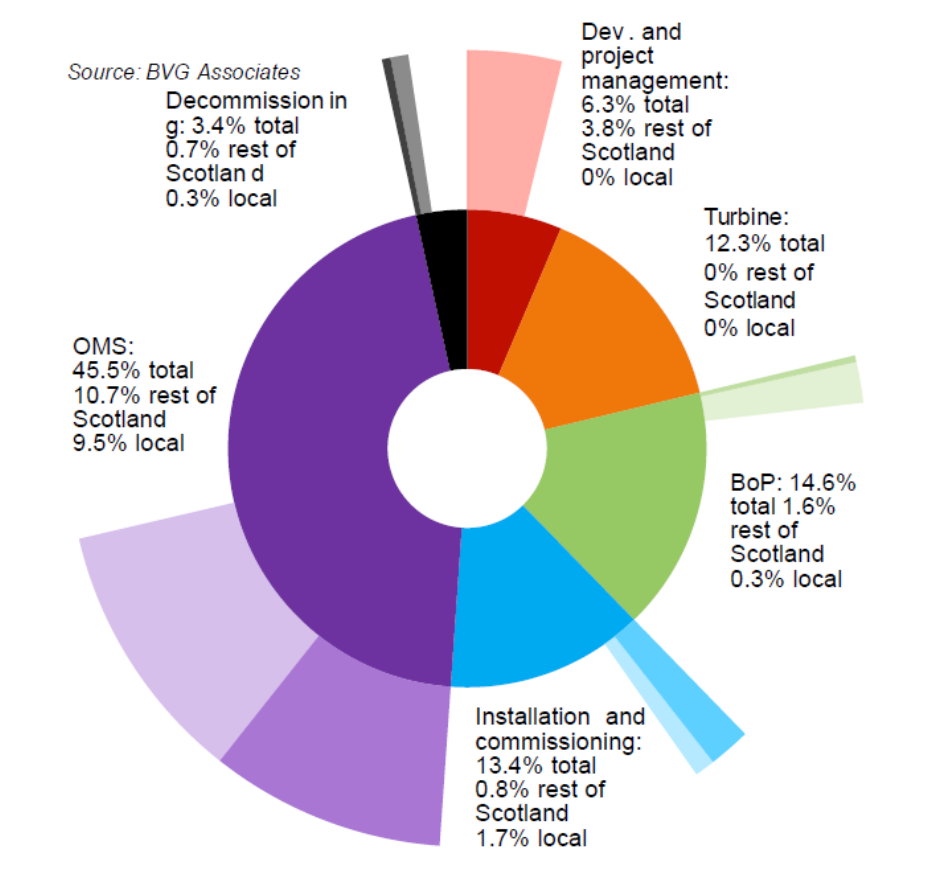
Our analysis of NNG shows that the overall Scottish content for the project was 29.3% and that 11.9% was local content. Figure 6 and Table 3 show these figures broken down by area of supply chain.
The largest Scottish content by percentage is in project development and management, where 59.6% of the total spend in the category was in Scotland. Although Scottish content is only 44.5% for OMS, the large lifetime spend means OMS delivers the largest total value to the Scottish supply chain. OMS also provide the highest local content, at 21%.
| Level 1 category | % of total | Territory | % of category | % of Territory total | % of category | % of total | |
|---|---|---|---|---|---|---|---|
| Development and project management | 6.3% | Scotland | 59.6% | 3.8% | Local | 0.7% | 0% |
| Non-Scotland | 40.4% | 2.6% | Rest of Scotland | 58.8% | 3.8% | ||
| Turbine supply | 12.3% | Scotland | 0% | 0% | Local | 0% | 0% |
| Non-Scotland | 100% | 14.8% | Rest of Scotland | 0% | 0% | ||
| Balance of plant | 14.6% | Scotland | 11.6% | 1.9% | Local | 1.6% | 0.3% |
| Non-Scotland | 88.4% | 14.6% | Rest of Scotland | 10% | 1.6% | ||
| Installation and commissioning | 13.4% | Scotland | 18.8% | 2.5% | Local | 12.7% | 1.7% |
| Non-Scotland | 81.2% | 10.9% | Rest of Scotland | 6.1% | 0.8% | ||
| Operation, maintenance and service | 45.5% | Scotland | 44.5% | 20.2% | Local | 21% | 9.5% |
| Non-Scotland | 55.5% | 25.2% | Rest of Scotland | 23.5% | 10.7% | ||
| Decommissioning | 3.4% | Scotland | 31% | 1.1% | Local | 10% | 0.3% |
| Non-Scotland | 69% | 2.4% | Rest of Scotland | 21% | 0.7% | ||
| Total | 100% | Scotland | 29.3% | 29.3% | Local | 11.9% | 11.9% |
| Non-Scotland | 70.7% | 70.7% | Rest of Scotland | 17.5% | 17.5% | ||
GVA, earnings and employment
Table 4 summarises the economic impact locally and on Scotland from the NNG project.
Gross-value added
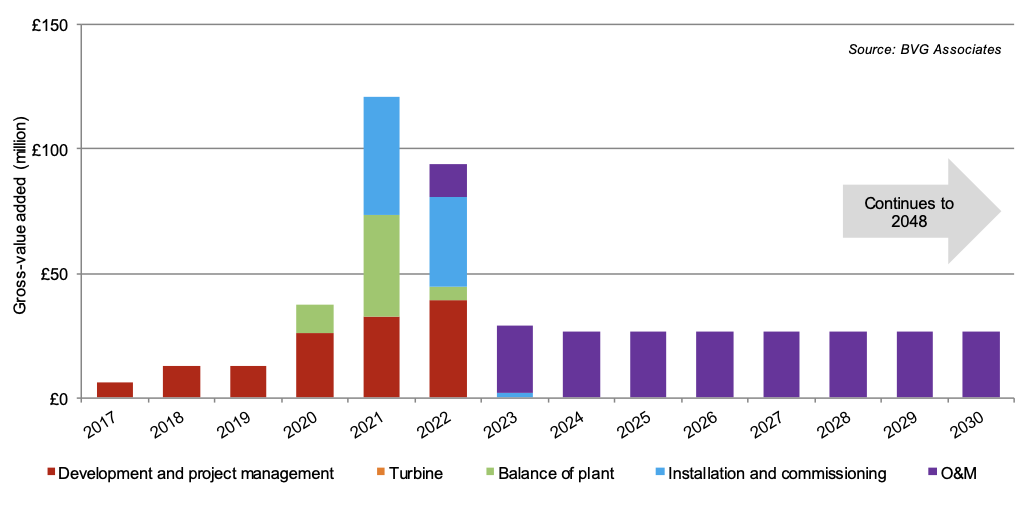
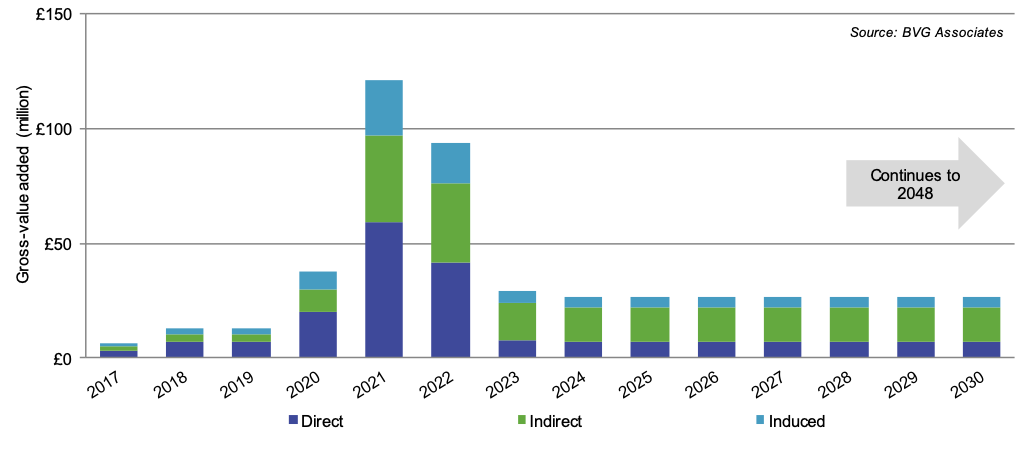
NNG will generate £980 million direct, indirect and induced GVA in Scotland over the lifetime of the wind farm, of which £342 million will be local.
Figure 7 shows that Scottish GVA peaks during the construction and installation phase in 2021, at around £120 million.
Over the lifetime OMS generates the greatest amount of Scottish and local GVA at £670 million and £275 million respectively, comprising of 25% direct, 58% indirect and 17% induced GVA (see Figure 8).
| Scotland | Local | |||||||
|---|---|---|---|---|---|---|---|---|
| Impact | Direct | Indirect | Induced | Total | Direct | Indirect | Induced | Total |
| Value-added (millions) | £320 | £483 | £177 | £980 | £236 | £89 | £17 | £342 |
| Earnings (millions) | £194 | £135 | £53 | £382 | £145 | £24 | £5 | £174 |
| FTE years | 3,700 | 3,940 | 1,400 | 9,040 | 3,030 | 710 | 170 | 3,910 |
Employment
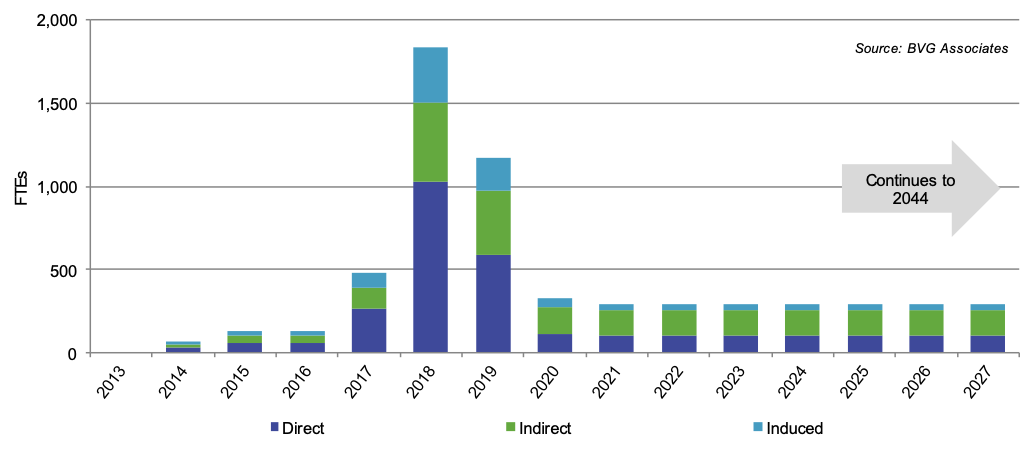
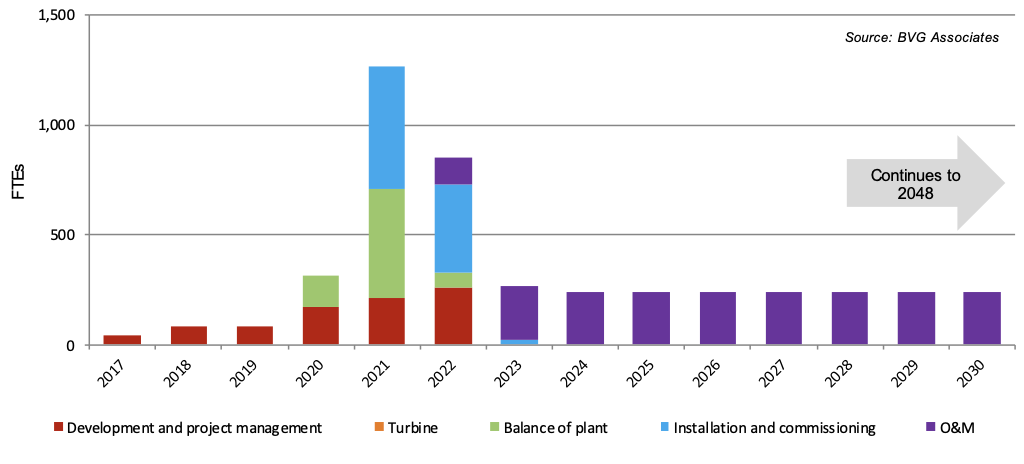
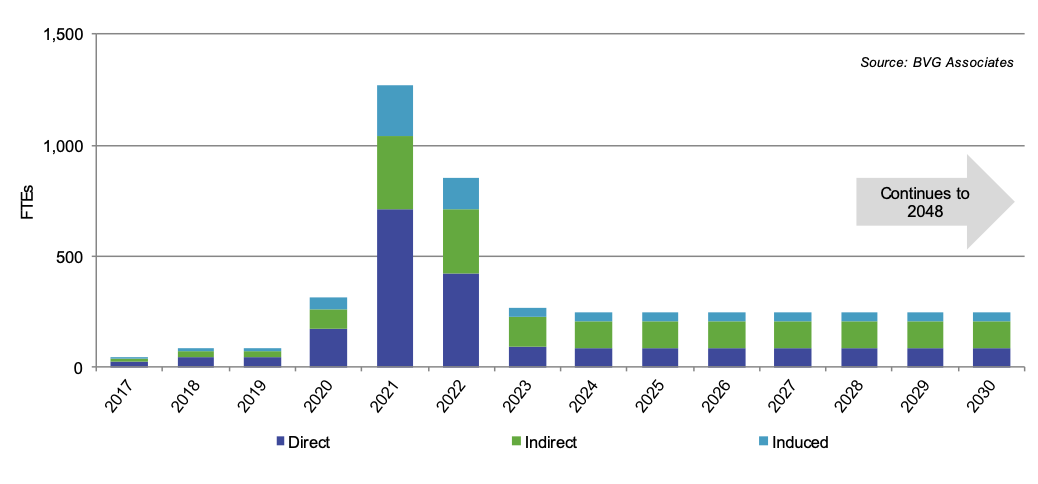
Over the lifetime of the wind farm 9,040 FTE years will be created in Scotland, of which 3,910 will have been local. The number of FTE years created each year between 2017 and 2048, broken down by supply chain, is shown in Figure 9. Scottish FTE years peak in the construction and installation phase in 2021, when 1,270 FTE years will be created. This comprises 56% direct, 26% indirect and 28% induced FTE years (see Figure 10).
OMS will create 6,100 FTE years over the lifetime of NNG in Scotland, and this includes the permanent local work force, developer back office functions and periodic work on the wind farm. OMS will create 3,110 FTE years locally.
4.3 Hywind Scotland
Scottish supply chain used for Hywind Scotland offshore wind farm included the following:
- The suction anchors were fabricated by Isleburn.
- The trenching for the export cable was undertaken by Fugro UK from Aberdeen.
- The offshore cable installation engineering was undertaken by Subsea 7 from Aberdeen.
Equinor provided us with some information about suppliers used and contracts placed, as well as some information around costs.
The costs used for the Hywind Scotland project were based on a percentage breakdown of cost provided by Equinor for the project and adjusted and validated using BVGA’s own experience of offshore wind farm cost modelling.
Hywind Scotland is a demonstration project. It is unlikely that a commercial scale project would be delivered in the same way and this would have implications for the selection of Scottish suppliers.
Scottish and local content
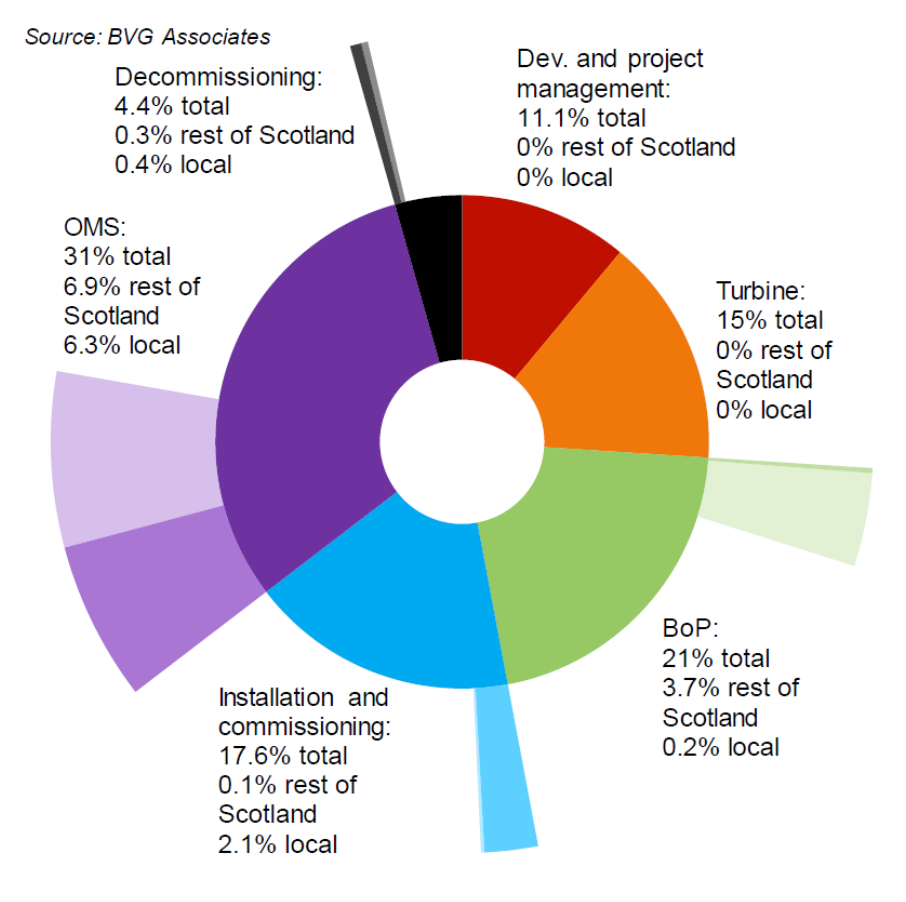
The overall Scottish content for the project was 19.9%. The local content was 9%. Figure 11 and Table 5 show these figures broken down by area of supply chain. It includes both generation and transmission assets.
The largest Scottish content by percentage is in OMS, where 42.4% of the total spend in the category was in Scotland.
| Level 1 category | % of total | Territory | % of category | % of total | Territory | % of category | % of total |
|---|---|---|---|---|---|---|---|
| Development and project management | 11.1% | Scotland | 0% | 0% | Local | 0% | 0% |
| Non-Scotland | 100% | 11.1% | Rest of Scotland | 0% | 0% | ||
| Turbine supply | 15.0% | Scotland | 0% | 0% | Local | 0% | 0% |
| Non-Scotland | 100% | 15% | Rest of Scotland | 0% | 0% | ||
| Balance of plant | 21.0% | Scotland | 18.3% | 3.9% | Local | 0.9% | 0.2% |
| Non-Scotland | 81.7% | 17.2% | Rest of Scotland | 17.4% | 3.7% | ||
| Installation and commissioning | 17.6% | Scotland | 12.7% | 2.2% | Local | 11.9% | 2.1% |
| Non-Scotland | 87.3% | 15.3% | Rest of Scotland | 0.7% | 0.1% | ||
| Operation, maintenance and service | 31.0% | Scotland | 42.4% | 13.1% | Local | 20.2% | 6.3% |
| Non-Scotland | 57.6% | 17.9% | Rest of Scotland | 22.2% | 6.9% | ||
| Decommissioning | 4.4% | Scotland | 16% | 0.7% | Local | 10% | 0.4% |
| Non-Scotland | 84% | 3.7% | Rest of Scotland | 6.0% | 0.3% | ||
| Total | 100% | Scotland | 19.9% | 19.9% | Local | 9% | 9% |
| Non-Scotland | 80.1% | 80.1% | Rest of Scotland | 10.9% | 10.9% |
GVA, earnings and employment
The economic impacts have been assessed between 2015 and 2038, which is the projected decommissioning date for Hywind Scotland. Table 6 summarises the impact of the wind farm over Hywind Scotland’s lifetime.
Gross-value added
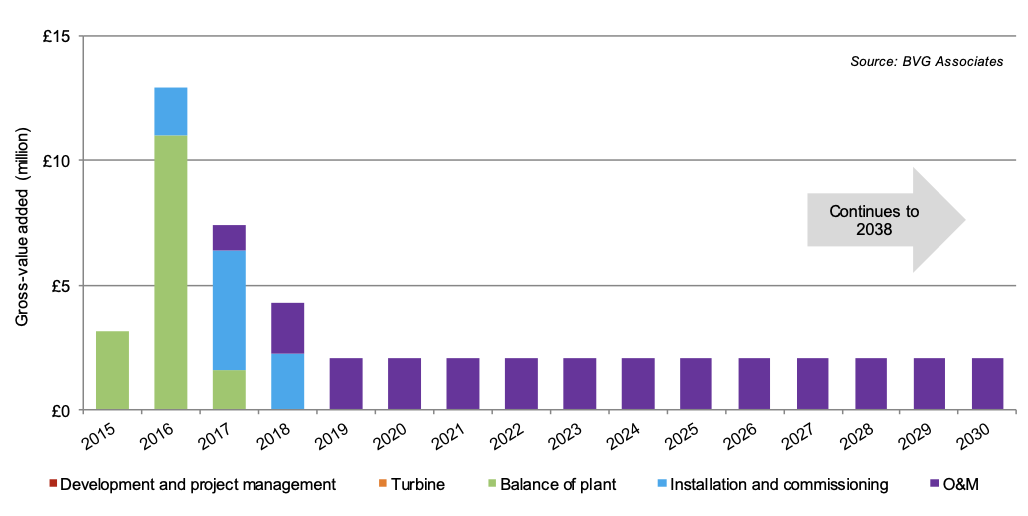
Hywind Scotland will generate £68 million direct, indirect and induced GVA in Scotland over the lifetime of the wind farm, of which £26 million will be generated locally. GVA peaked during the construction and installation phase in 2016, at around £13 million (see Figure 12).
Over the lifetime OMS generates the greatest amount of GVA at £41 million, comprising of 25% direct, 58% indirect and 17% induced GVA (see Figure 13). Locally this would generate £17 million.
| Scotland | Local | |||||||
|---|---|---|---|---|---|---|---|---|
| Impact | Direct | Indirect | Induced | Total | Direct | Indirect | Induced | Total |
| Value-added (millions) | £24 | £31 | £13 | £68 | £15 | £10 | £1 | £26 |
| Earnings (millions) | £14 | £9 | £4 | £27 | £9 | £3 | £0.5 | £12.5 |
| FTE years | 310 | 270 | 110 | 690 | 185 | 95 | 15 | 295 |
Employment
Over the lifetime of the wind farm 690 FTE years will have been created in Scotland, of which 295 are local. The number of FTEs created in Scotland each year between 2014 and 2038, broken down by supply chain, is shown in Figure 14.
FTE years in Scotland peak in the construction and installation phase in 2016, when 152 FTE years were created. This comprises 64% direct, 18% indirect and 18% induced FTE years (see Figure 15).
OMS will create 375 FTE years in Scotland over the lifetime of the wind farm, and this includes the permanent local work force, developer back office functions and periodic work on the wind farm. Of these, 190 will be local.
4.4. MeyGen Phase 1A
Scottish supply chain used for MeyGen Phase 1A includes:
- A large part of the fabrication of the turbine support structure work was undertaken by Global Energy Group.
- The fabrication of the ballast blocks for the turbine support structure was mainly carried out by JGC.
- Fabrication and assembly of the one of the turbines was performed in Scotland.
- More than half of the project delivery work by MeyGen was carried out in Scotland.
- SHEPD installed 15km of 33kV onshore cable.
We had access to cost data and content information used in a previous study for HIE, which was used to inform and validate our modelling. The costs used for the MeyGen Phase 1A project were based on costs provided by the developer of the project.
MeyGen Phase 1A is a demonstration project, and therefore procurement decisions might not be representative of a commercial scale tidal project.
Scottish and local content
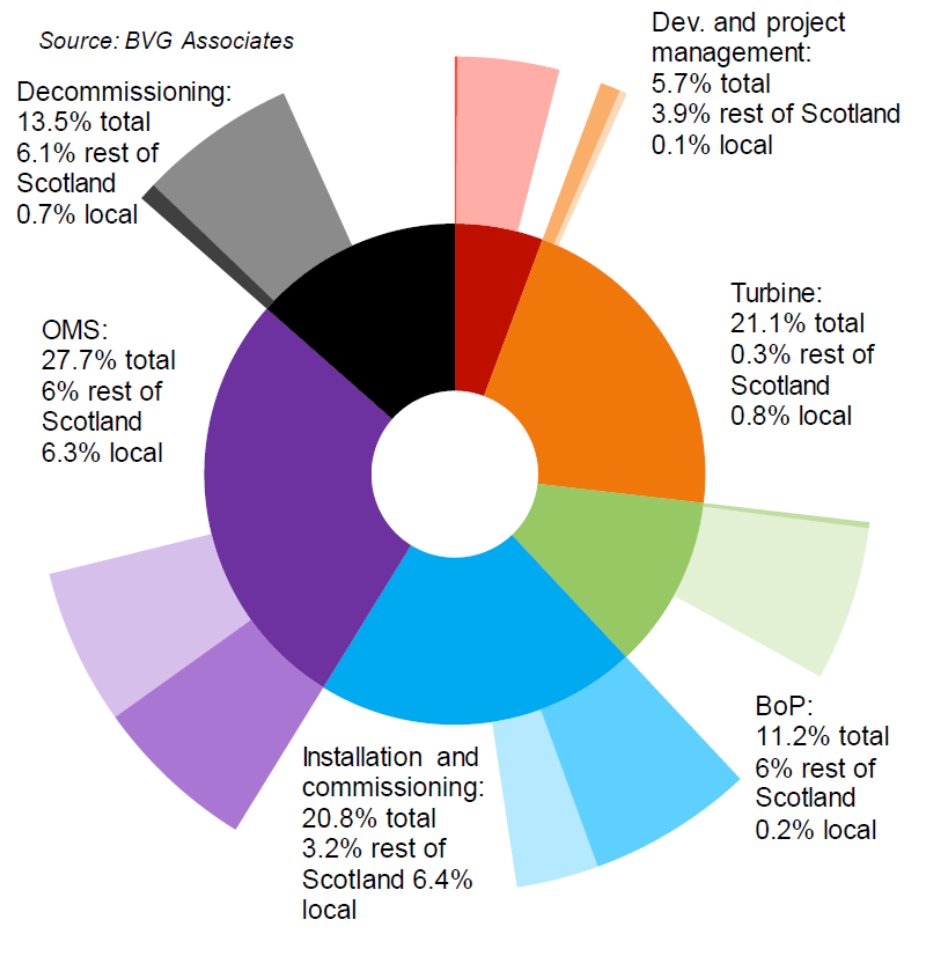
Our analysis of MeyGen shows that the overall Scottish content for the project was 40%, of which the local content was 14.5%. Figure 16 and Table 7 show these figures broken down by area of supply chain. It includes both generation and transmission assets.
The largest Scottish content by percentage is in development and project management, where 70.7% of the total spend in the category was in Scotland. Although Scottish content is only 44.6% for OMS, the large lifetime spend means OMS delivers the largest total value to the Scottish supply chain.
| Level 1 category | % of total | Territory | % of category | % of total | Territory | % of category | % of total |
|---|---|---|---|---|---|---|---|
| Development and project management | 5.7% | Scotland | 70.7% | 4% | Local | 1.7% | 0.1% |
| Non-Scotland | 29.3% | 1.7% | Rest of Scotland | 69% | 3.9% | ||
| Turbine supply | 21.1% | Scotland | 5% | 1.1% | Local | 3.7% | 0.8% |
| Non-Scotland | 95% | 20.1% | Rest of Scotland | 1.3% | 0.3% | ||
| Balance of plant | 11.2% | Scotland | 55.5% | 6.2% | Local | 2.1% | 0.2% |
| Non-Scotland | 44.5% | 5% | Rest of Scotland | 53.4% | 6% | ||
| Installation and commissioning | 20.8% | Scotland | 46.2% | 9.6% | Local | 30.9% | 6.4% |
| Non-Scotland | 53.8% | 11.2% | Rest of Scotland | 15.3% | 3.2% | ||
| Operation, maintenance and service | 27.7% | Scotland | 44.6% | 12.4% | Local | 22.8% | 6.3% |
| Non-Scotland | 55.4% | 15.3% | Rest of Scotland | 21.8% | 6% | ||
| Decommissioning | 13.5% | Scotland | 50.2% | 6.8% | Local | 5% | 0.7% |
| Non-Scotland | 49.8% | 6.7% | Rest of Scotland | 45.2% | 6.1% | ||
| Total | 100% | Scotland | 40% | 40% | Local | 14.5% | 14.5% |
| Non-Scotland | 60% | 60% | Rest of Scotland | 25.5% | 25.5% |
GVA, earnings and employment
Table 8 summarises the economic impact of MeyGen Phase 1A locally and in Scotland.
Gross-value added
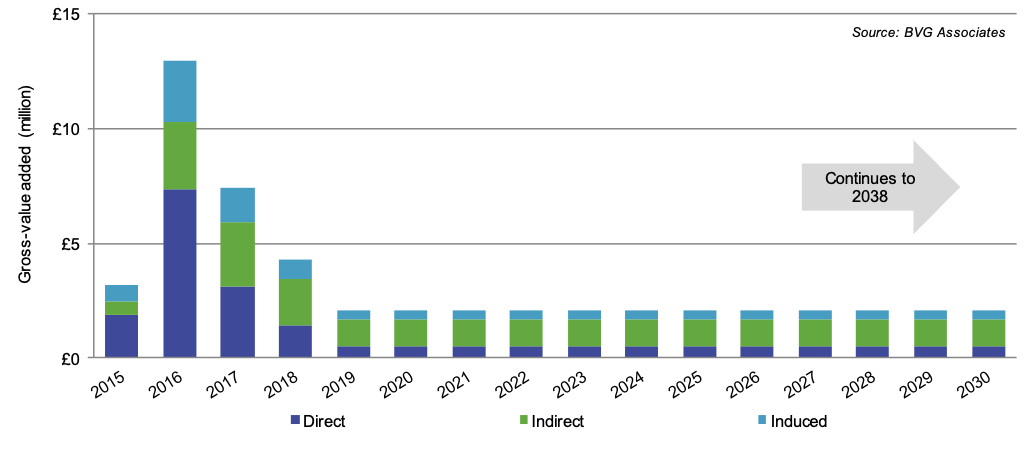
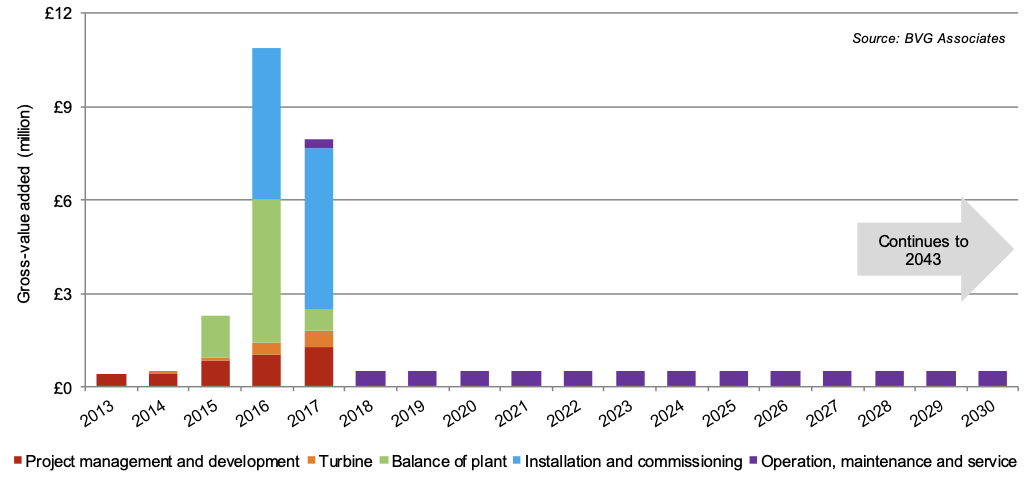
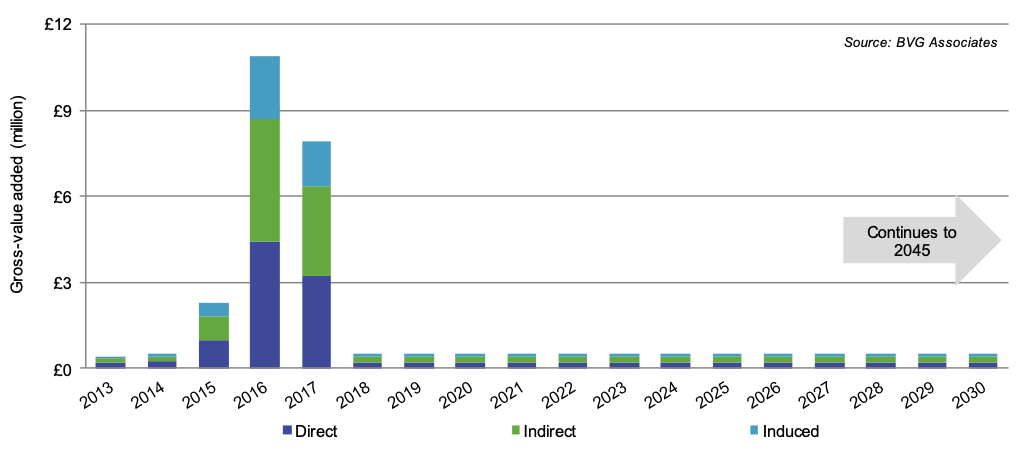
MeyGen will generate £41 million direct, indirect and induced GVA in Scotland over the lifetime of the project, of which £13.5 million will be generated locally. GVA in Scotland peaked during the construction and installation phase in 2016, at around £11 million (see Figure 17)
Over the lifetime OMS generates the greatest amount of GVA in Scotland at £13 million, comprising of 42% direct, 39% indirect and 19% induced GVA (see Figure 18). OMS would create £4 million locally.
| Scotland | Local | |||||||
|---|---|---|---|---|---|---|---|---|
| Impact | Direct | Indirect | Induced | Total | Direct | Indirect | Induced | Total |
| Value-added (millions) | £17 | £16 | £8 | £41 | £6 | £7 | £0.5 | £13 |
| Earnings (millions) | £5 | £9 | £2 | £16 | £2 | £4 | £0.5 | £6.5 |
| FTE years | 170 | 260 | 90 | 520 | 60 | 110 | 5 | 175 |
Employment
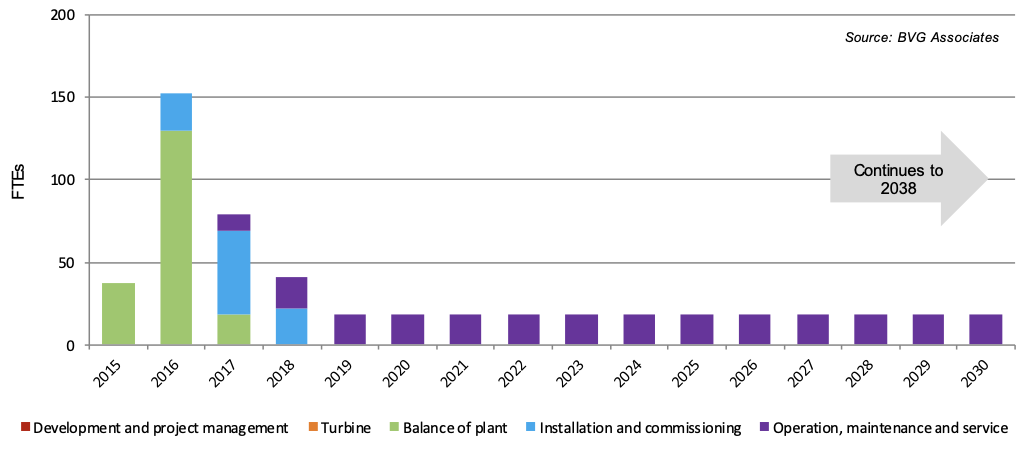
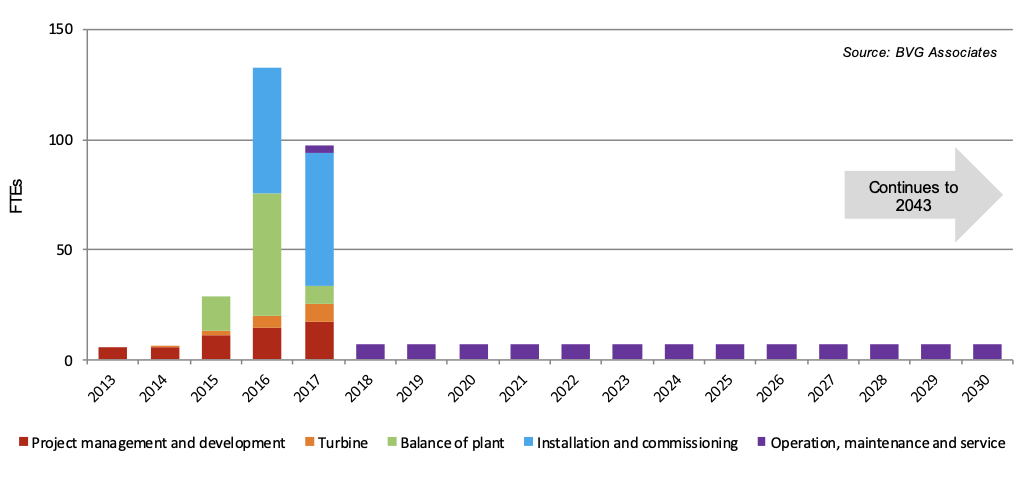
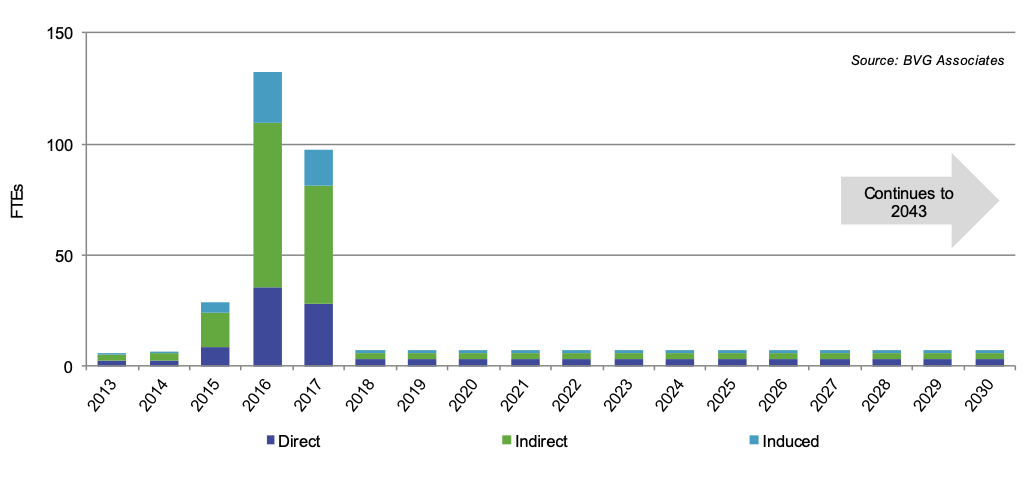
Over the lifetime of the project 520 FTE years will have been created in Scotland, of which 175 are local. The number of FTE years created in Scotland each year between 2013 and 2043, broken down by supply chain, is shown in Figure 19.
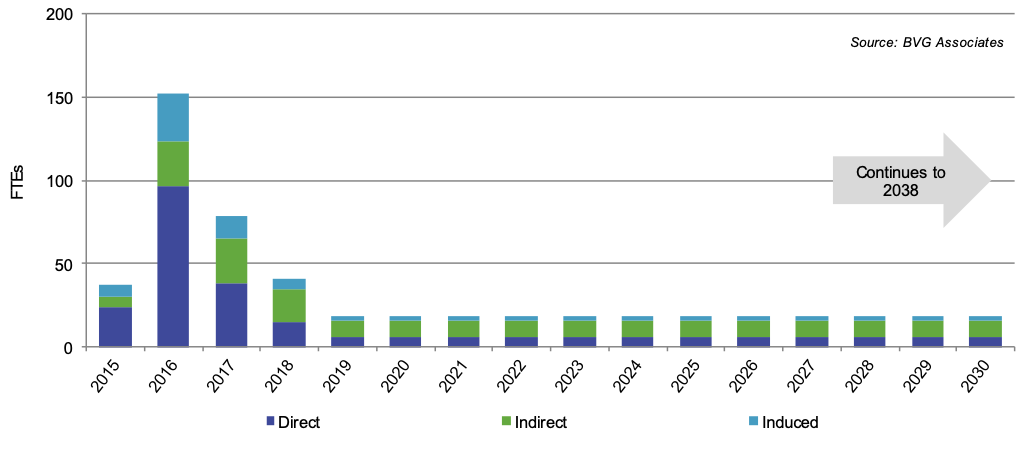
FTEs peak in the construction and installation phase in 2016, when 130 FTEs were created. This comprises 27% direct, 56% indirect and 17% induced FTEs (see Figure 20).
OMS will create 180 FTE years over the lifetime of project in Scotland, and this includes the permanent local work force, developer back office functions and periodic work on the project. Of those, 75 FTE years will be local.
Contact
Email: ScotMER@gov.scot