Scenario mapping for offshore renewable energy development economic benefits: case studies
Report to identify, measure and value the delivered and potential economic impact for Scotland from offshore wind and tidal energy projects.
6. What-if analysis
For the what-if analysis we modelled what could have been delivered in terms of economic impacts in Scotland from similar projects to the case study projects delivered on the same timescale, if they had used the maximum realistic content from Scottish supply chain. We used the supply chain assessment in section 4 to consider whether the Scottish supply chain had the potential to secure a greater proportion of business from the wind farms, therefore establishing the maximum realistic content.
6.1. Beatrice Offshore Wind Farm
The key differences between the as-is analysis and the what-if analysis includes:
- An increased use of Scottish suppliers for the development and project management phase
- Part of the tower order placed in Scotland, and
- A higher Scottish content in OMS.
Scottish content
We concluded that Beatrice could have achieved 39.2% Scottish content and 12.3% local content (see Table 9 and Figure 54). This compares with 29.6% and 11.7% respectively for the as-is analysis.
The areas with highest percentage Scottish content would be project development and management, where 86.5% of the could come from Scotland. This area is closely followed by OMS which has could have an average Scottish content of 56%, due to its utilisation of Scottish based technicians and operational staff.
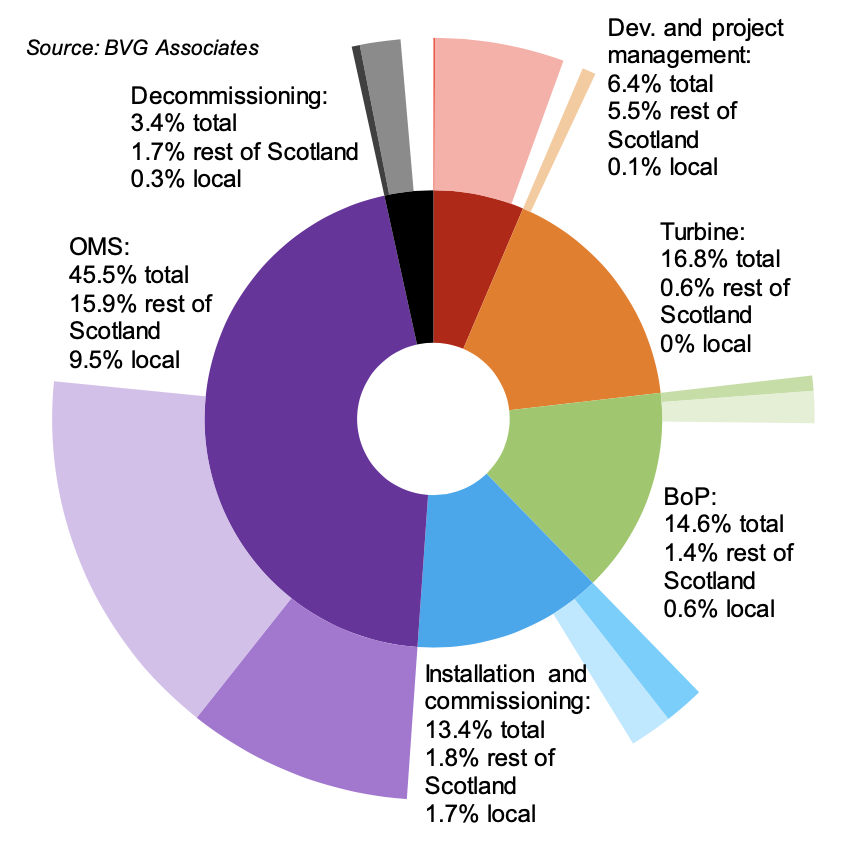
| Level 1 category | % of total | Territory | % of category | % of total | Territory | % of category | % of total |
|---|---|---|---|---|---|---|---|
| Development and project management | 6.4% | Scotland | 86.5% | 5.5% | Local | 1.2% | 0.1% |
| Non-Scotland | 13.5% | 0.9% | Rest of Scotland | 85.3% | 5.5% | ||
| Turbine supply | 16.8% | Scotland | 3.5% | 0.6% | Local | 0% | 0% |
| Non-Scotland | 96.6% | 16.2% | Rest of Scotland | 3.5% | 0.6% | ||
| Balance of plant | 14.6% | Scotland | 13.8% | 2% | Local | 4.4% | 0.6% |
| Non-Scotland | 86.2% | 12.5% | Rest of Scotland | 9.3% | 1.4% | ||
| Installation and commissioning | 13.4% | Scotland | 26.2% | 3.5% | Local | 12.7% | 1.7% |
| Non-Scotland | 73.8% | 9.9% | Rest of Scotland | 13.4% | 1.8% | ||
| Operation, maintenance and service | 45.5% | Scotland | 56% | 25.5% | Local | 21% | 9.5% |
| Non-Scotland | 44% | 20% | Rest of Scotland | 35% | 15.9% | ||
| Decommissioning | 3.4% | Scotland | 60% | 2.1% | Local | 10% | 0.3% |
| Non-Scotland | 40% | 1.4% | Rest of Scotland | 50% | 1.7% | ||
| Total | 100.0% | Scotland | 39.2% | 39.2% | Local | 12.3% | 12.3% |
| Non-Scotland | 60.8% | 60.8% | Rest of Scotland | 26.8% | 26.8% |
GVA, earnings and employment
Table 10 summarises the economic impacts that could have been created by Beatrice Offshore Wind Farm.
Gross value-added
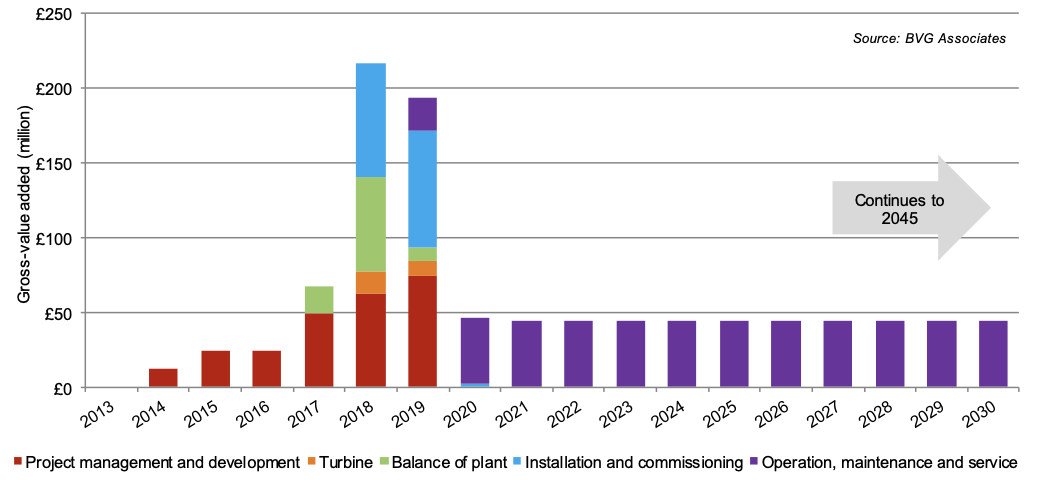
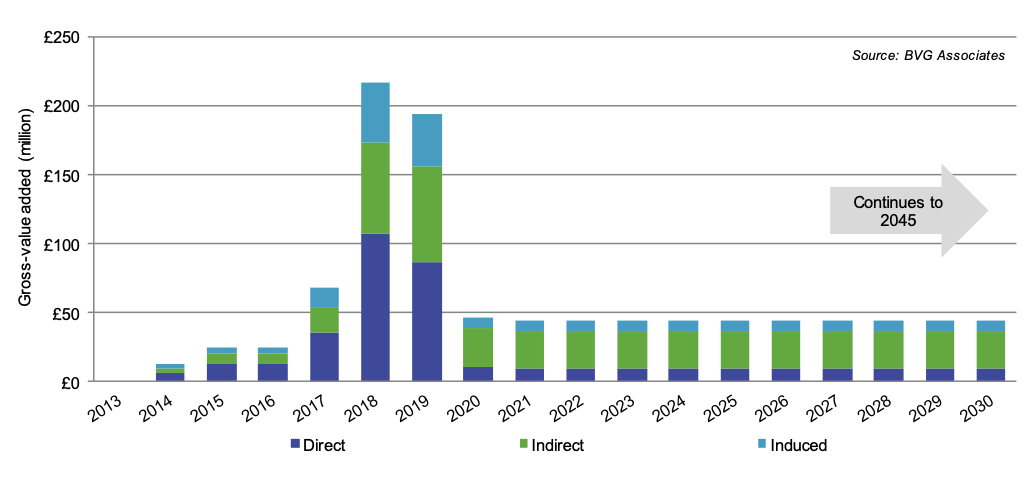
Beatrice could have generated £1,716 million direct, indirect and induced GVA in Scotland over the lifetime of the wind farm (£416 million more than as-is analysis), of which £465 million could have been generated locally (£21 million more than as-is analysis). GVA would peak during the construction and installation phase at around £217 million (£42 million more than as-is analysis) in 2018 (see Figure 55).
Over the lifetime OMS could generate the greatest amount of GVA at £1,100 million (£250 million more than as-is analysis), comprising 22% direct, 61% indirect and 17% induced GVA (see Figure 56). OMS could create £360 million locally.
| Scotland | Local | |||||||
|---|---|---|---|---|---|---|---|---|
| Impact | Direct | Indirect | Induced | Total | Direct | Indirect | Induced | Total |
| Value-added (millions) | £546 | £861 | £309 | £1,716 | £309 | £133 | £23 | £465 |
| Earnings (millions) | £333 | £242 | £92 | £667 | £190 | £37 | £7 | £243 |
| FTE years | 6,260 | 7,130 | 2,420 | 15,810 | 3,970 | 1,090 | 230 | 5,290 |
Employment
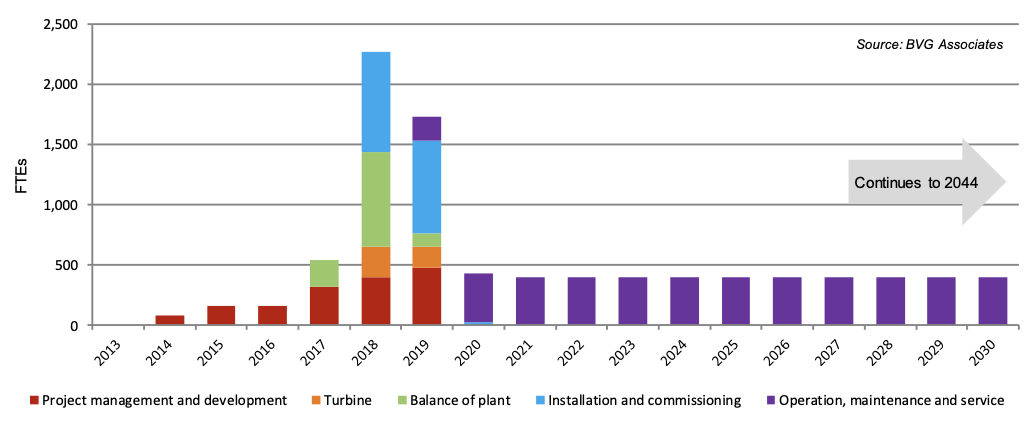
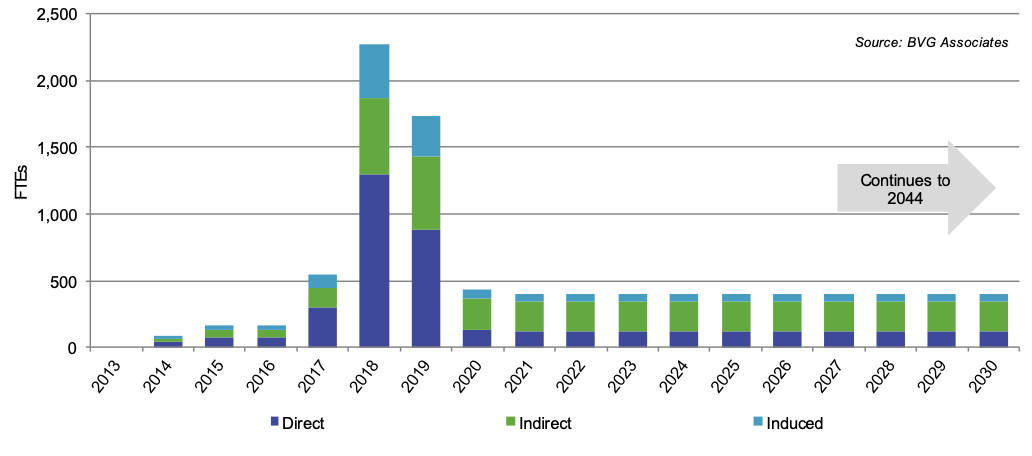
Over the lifetime of the project 15,810 FTEs, could have been created (4,190 more than the as-is analysis), of which 5,290 locally. The number of FTEs created each year between 2013 and 2043, broken down by supply chain, is shown in Figure 57.
FTEs peak in the construction and installation phase in 2017, when 2,270 FTEs could be created (470 more than the as-is analysis). This comprises 57% direct, 25% indirect and 18% induced FTEs (see Figure 58). OMS could create 10,000 FTEs over the lifetime of project (2,600 more than the as-is analysis), and this includes the permanent local work force, developer back office functions and periodic work on the project. 4,090 of these OMS jobs would be local (20 more than the as-is analysis).
Indirect FTE years, FTEs created below tier 1 contracting level, would make the largest contribution to the total.
6.2 Neart Na Gaoithe Offshore Wind farm
The key differences between the as-is analysis and the what-if analysis includes:
- An increased use of Scottish suppliers for the development and project management phase
- Part of the tower work pack being contracted in Scotland
- A small portion of the offshore substation work using Scottish suppliers, and
- A higher Scottish content in OMS.
Scottish content
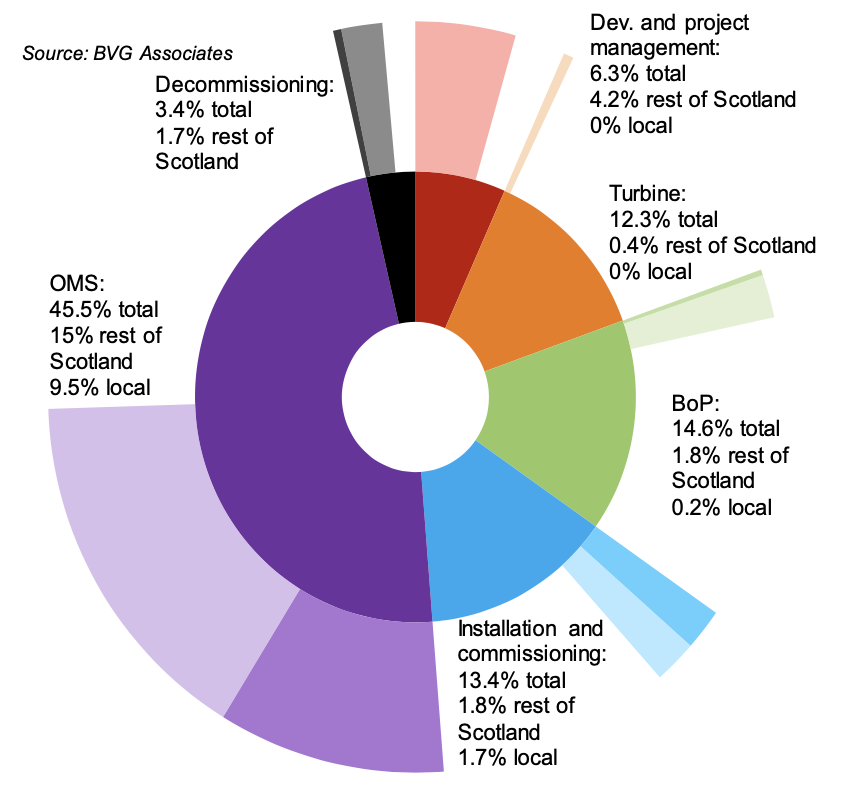
NNG could have achieved 38.2% Scottish content and 11.9% local content (see Figure 59 and Table 11). This compares with 29.3% and 11.9% respectively for the as-is analysis.
The areas with highest percentage Scottish content would be project development and management with 66.4%. This area would be closely followed by OMS which would have a Scottish content of 54%, due to its use of Scottish based technicians and operational staff. OMS also provide the highest local content, at 21%.
| Level 1 category | % of total | Territory | % of category | % of total | Territory | % of category | % of total |
|---|---|---|---|---|---|---|---|
| Development and project management | 6.3% | Scotland | 66.4% | 4.2% | Local | 0.2% | 0% |
| Non-Scotland | 33.6% | 2.1% | Rest of Scotland | 66.2% | 4.2% | ||
| Turbine supply | 12.3% | Scotland | 3.5% | 0.4% | Local | 0% | 0% |
| Non-Scotland | 96.6% | 11.9% | Rest of Scotland | 3.5% | 0.4% | ||
| Balance of plant | 14.6% | Scotland | 13.8% | 2% | Local | 1.6% | 0.2% |
| Non-Scotland | 86.2% | 12.5% | Rest of Scotland | 12.1% | 1.8% | ||
| Installation and commissioning | 13.4% | Scotland | 26.2% | 3.5% | Local | 12.7% | 1.7% |
| Non-Scotland | 73.8% | 9.9% | Rest of Scotland | 13.4% | 1.8% | ||
| Operation, maintenance and service | 45.5% | Scotland | 54% | 24.6% | Local | 21% | 9.5% |
| Non-Scotland | 46% | 20.9% | Rest of Scotland | 33.0% | 15% | ||
| Decommissioning | 3.4% | Scotland | 60% | 2.1% | Local | 10% | 0.3% |
| Non-Scotland | 40% | 1.4% | Rest of Scotland | 50% | 1.7% | ||
| Total | 100.0% | Scotland | 38.2% | 38.2% | Local | 11.9% | 11.9% |
| Non-Scotland | 61.8% | 61.8% | Rest of Scotland | 26.4% | 26.4% |
GVA, earnings and employment
Table 12 summarises the economic impacts that could have been created by NNG.
Gross value-added
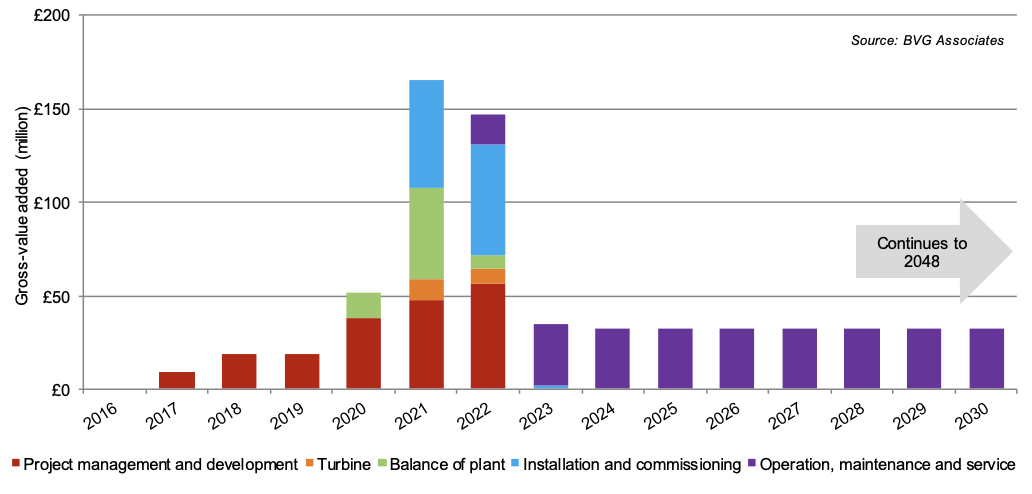
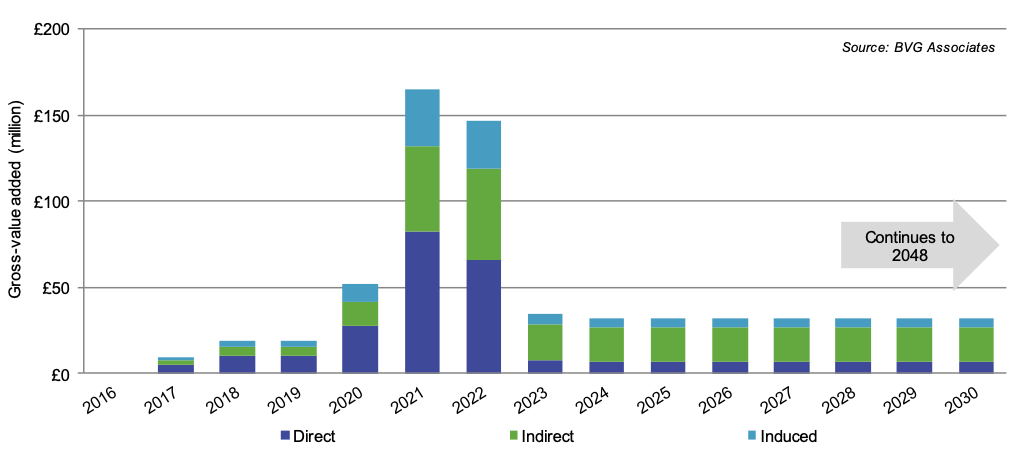
NNG could have generated £1,277 million direct, indirect and induced GVA in Scotland over the lifetime of the wind farm (£297 million more than as-is analysis), of which £342 million would be local. GVA would peak during the construction and installation phase at around £165 million (£45 million more than as-is analysis) in 2021 (see Figure 60).
Over the lifetime OMS could generate the greatest amount of GVA at £810 million (£140 million more than as-is analysis), comprising 22% direct, 61% indirect and 17% induced GVA (see Figure 61). OMS could create £275 million locally.
| Scotland | Local | |||||||
|---|---|---|---|---|---|---|---|---|
| Impact | Direct | Indirect | Induced | Total | Direct | Indirect | Induced | Total |
| Value-added (millions) | £407 | £640 | £230 | £1,277 | £236 | £89 | £17 | £342 |
| Earnings (millions) | £248 | £180 | £69 | £497 | £145 | £24 | £5 | £174 |
| FTE years | 4,660 | 5,305 | 1,805 | 11,770 | 3,030 | 710 | 170 | 3,910 |
Employment
Over the lifetime of the project 11,770 FTEs could have been created (2,730 more than the as-is analysis) of which 3,910 would be local. The number of FTEs created each year between 2016 and 2048, broken down by supply chain, is shown in Figure 62.
FTEs peak in the construction and installation phase in 2021, when 1,730 FTEs could be created (460 more than the as-is analysis). This comprises 57% direct, 25% indirect and 18% induced FTEs (see Figure 63).
OMS could create 7,350 FTEs over the lifetime of project (1,250 more than the as-is analysis), of which 3,110 would be local. This includes the permanent local work force, developer back office functions and periodic work on the project.
6.3. Hywind Scotland
The key differences between the as-is analysis and the what-if analysis includes:
- A higher Scottish content in the development and project management phase
- Part of the tower order being placed in Scotland
- Using Scottish supply chain for the installation of foundations and turbines, and
- A higher Scottish content in OMS.
Scottish content
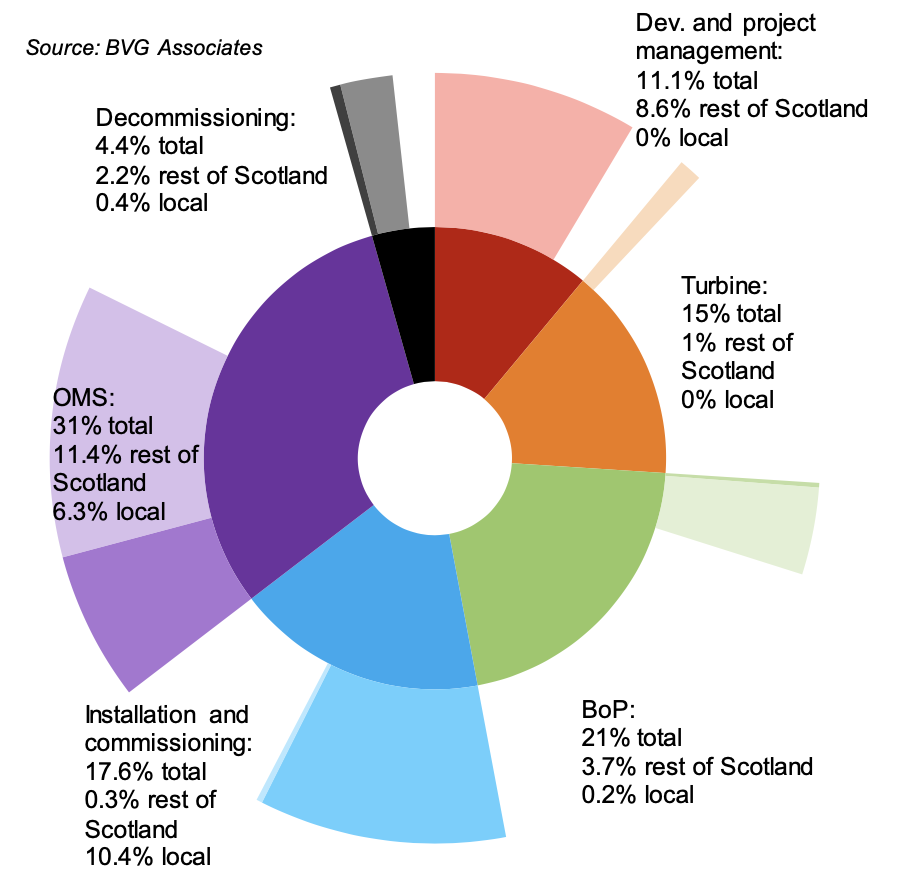
We conclude that Hywind Scotland could have achieved 44.4% Scottish content and 17.3% local content (see Figure 64 and Table 13). This compares with 19.9% and 9% respectively for the as-is analysis.
The areas with highest percentage Scottish content are development and project management with 77.5%.
This area is closely followed by installation and commissioning with 60.5%, due to its utilisation of Scottish based technicians and operational staff.
| Level 1 category | % of total | Territory | % of category | % of total | Territory | % of category | % of total |
|---|---|---|---|---|---|---|---|
| Development and project management | 11.1% | Scotland | 77.5% | 8.6% | Local | 0% | 0% |
| Non-Scotland | 22.5% | 2.5% | Rest of Scotland | 77.5% | 8.6% | ||
| Turbine supply | 15% | Scotland | 6.5% | 1% | Local | 0% | 0% |
| Non-Scotland | 93.5% | 14% | Rest of Scotland | 6.5% | 1% | ||
| Balance of plant | 21% | Scotland | 18.3% | 3.9% | Local | 0.9% | 0.2% |
| Non-Scotland | 81.7% | 17.2% | Rest of Scotland | 17.4% | 3.7% | ||
| Installation and commissioning | 17.6% | Scotland | 60.5% | 10.6% | Local | 59% | 10.4% |
| Non-Scotland | 39.5% | 6.9% | Rest of Scotland | 1.4% | 0.3% | ||
| Operation, maintenance and service | 31% | Scotland | 57.1% | 17.7% | Local | 20.2% | 6.3% |
| Non-Scotland | 42.9% | 13.3% | Rest of Scotland | 36.9% | 11.4% | ||
| Decommissioning | 4.4% | Scotland | 60.0% | 2.6% | Local | 10% | 0.4% |
| Non-Scotland | 40% | 1.8% | Rest of Scotland | 50% | 2.2% | ||
| Total | 100% | Scotland | 44.4% | 44.4% | Local | 17.3% | 17.3% |
| Non-Scotland | 55.6% | 55.6% | Rest of Scotland | 27.1% | 27.1% |
GVA, earnings and employment
Table 14 summarises the economic impacts that could have been created by Hywind Scotland.
Gross value-added
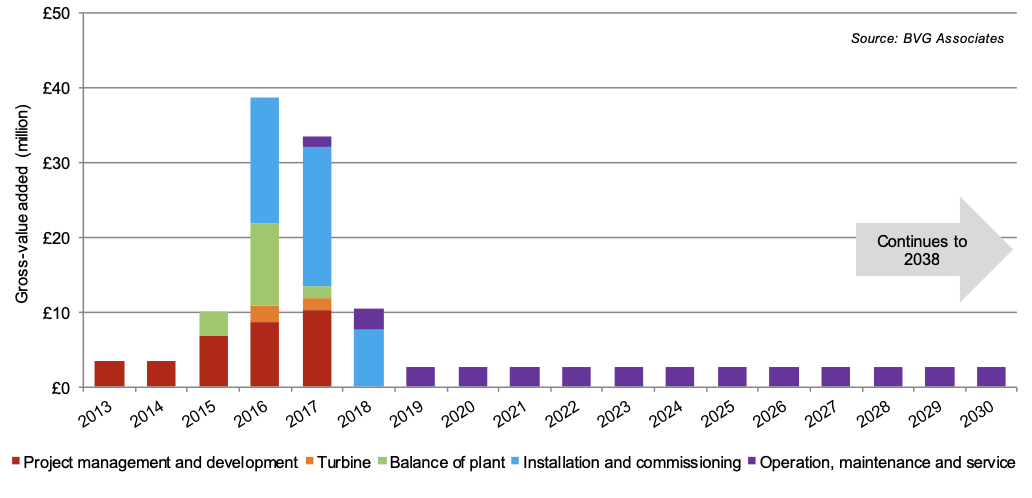
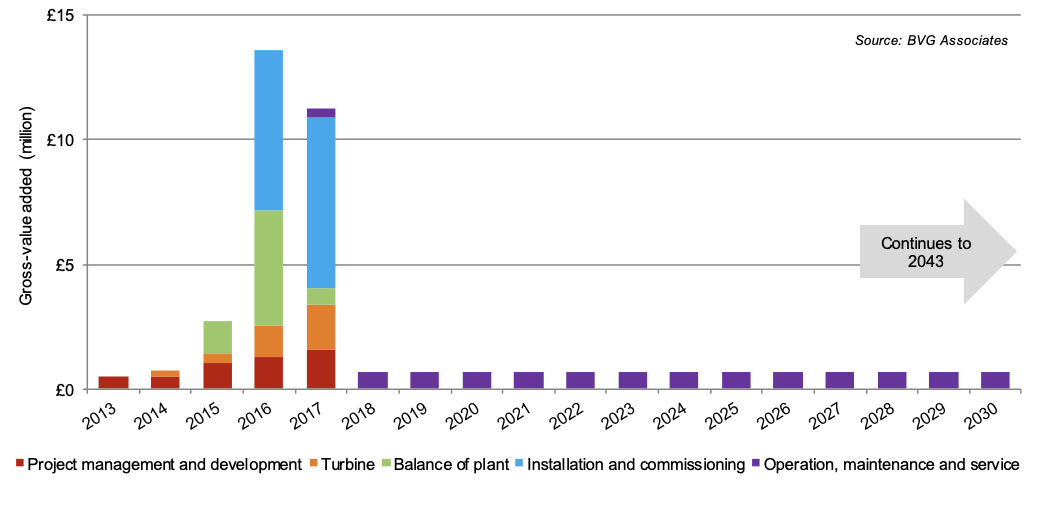
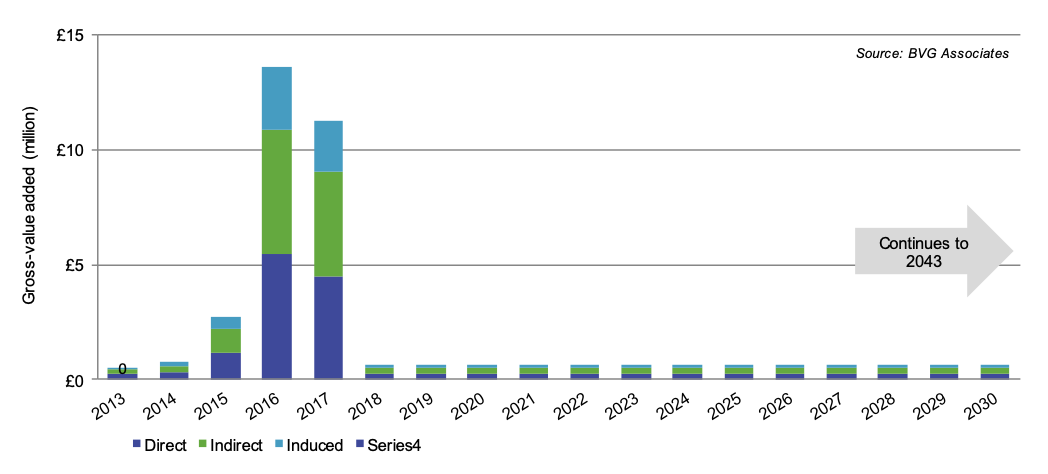
Hywind Scotland could have generated £171 million direct, indirect and induced GVA in Scotland over the lifetime of the wind farm (£103 million more than as-is analysis), of which £59 million would be local. GVA would peak during the construction and installation phase at around £39 million (£26 million more than as-is analysis) (see Figure 65).
Over the lifetime OMS could generate the greatest amount of GVA at £69 million (£28 million more than as-is analysis), comprising 20% direct, 63% indirect and 17% induced GVA (see Figure 66). OMS could create £22 million locally (£5 million more than as-is analysis).
| Scotland | Local | |||||||
|---|---|---|---|---|---|---|---|---|
| Impact | Direct | Indirect | Induced | Total | Direct | Indirect | Induced | Total |
| Value-added (millions) | £63 | £76 | £32 | £171 | £18 | £38 | £3 | £59 |
| Earnings (millions) | £39 | £22 | £10 | £71 | £11 | £12 | £0.5 | £23.5 |
| FTE years | 700 | 660 | 265 | 1,625 | 225 | 350 | 25 | 600 |
Employment
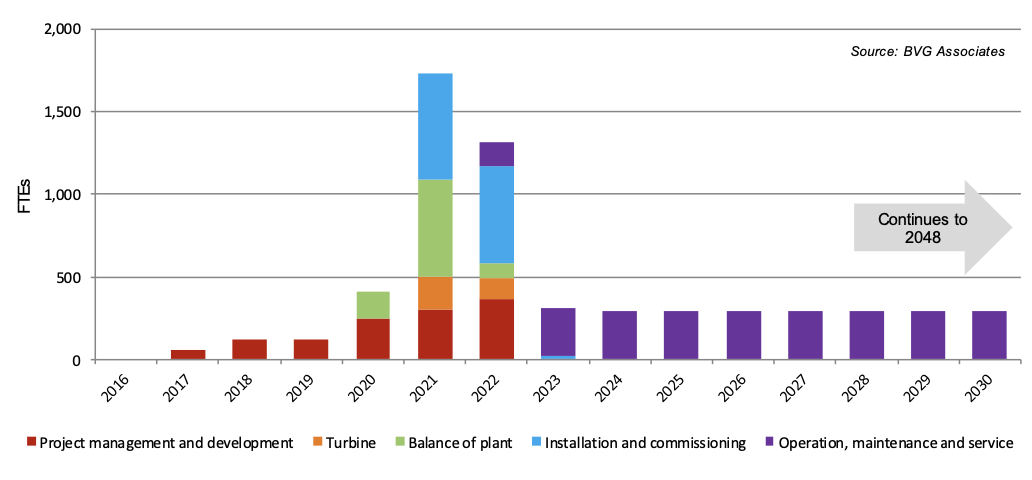
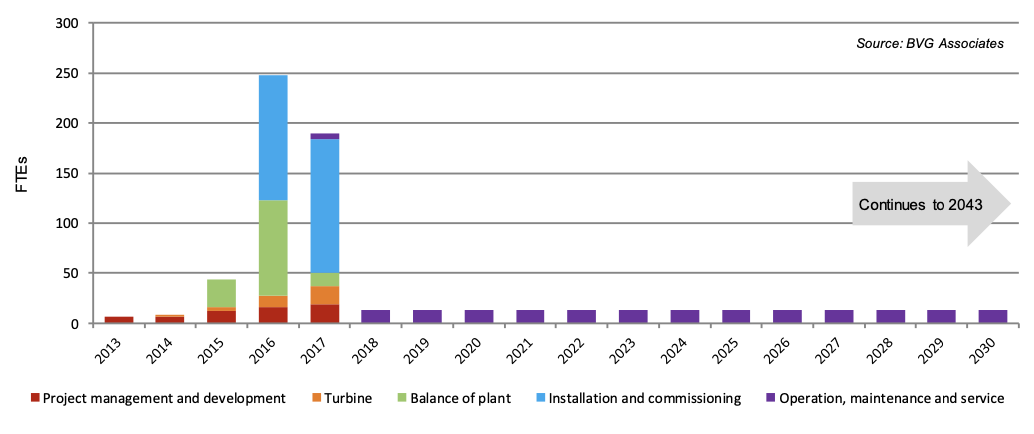
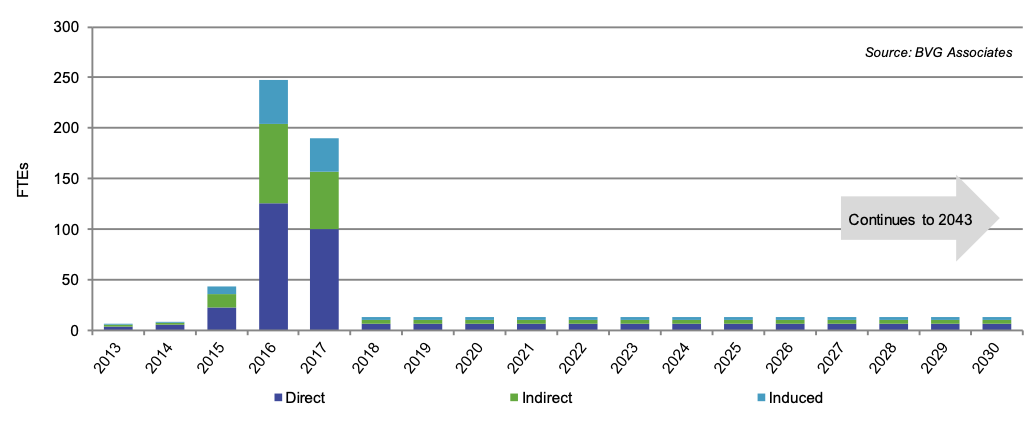
Over the lifetime of the project 1,625 FTEs, could have been created in Scotland (935 more than the as-is analysis), of which 600 locally (305 more than the as-is analysis). The number of FTEs created each year between 2013 and 2038, broken down by supply chain, is shown in Figure 67).
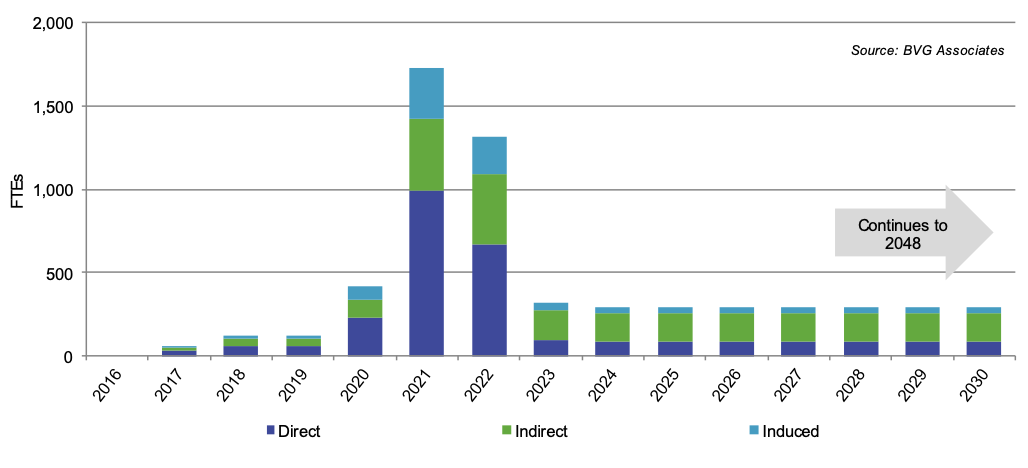
FTEs peak in the construction and installation phase in 2016, when 405 FTEs could be created (253 more than the as-is analysis). This comprises 57% direct, 25% indirect and 18% induced FTEs (see Figure 68).
OMS could create 620 FTEs over the lifetime of project (245 more than the as-is analysis), and this includes the permanent local work force, developer back office functions and periodic work on the project. Of these, 240 would be local.
6.4. MeyGen Phase 1A
The key additional Scottish supply for the what-if analysis are:
- Higher Scottish content in the development and project management phase
- A small part of the turbine rotor and nacelle assembly work being contracted in Scotland, and
- A higher Scottish content in OMS.
Scottish content
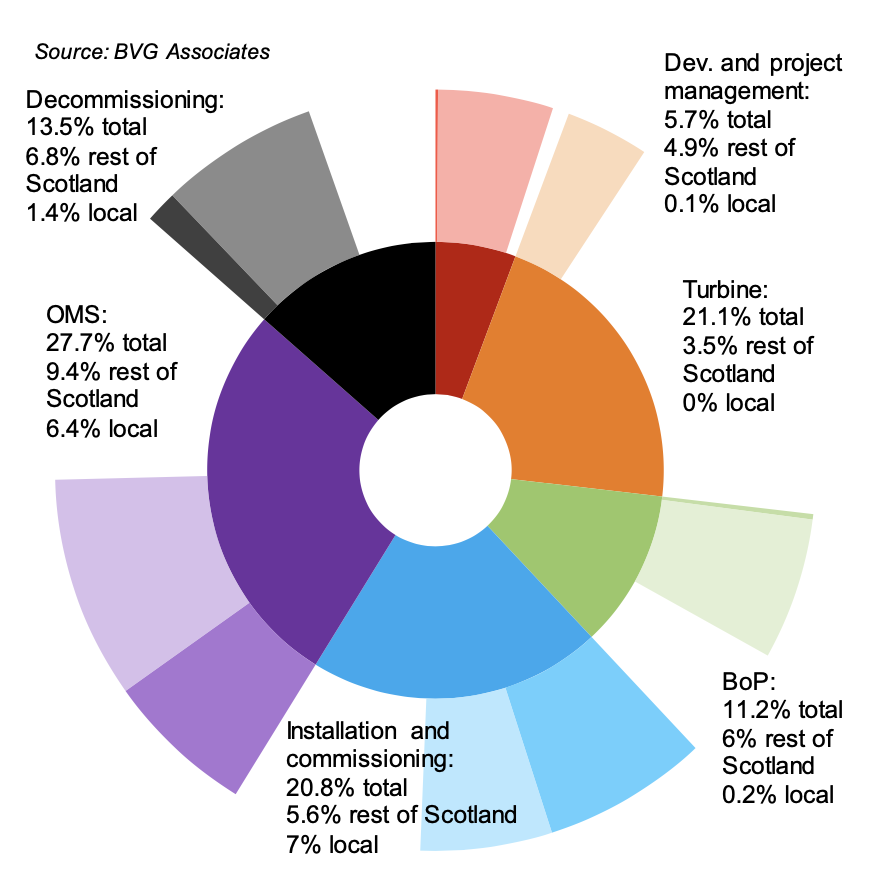
We conclude that MeyGen could have achieved 51.3% Scottish content and 15.1% local content (see Figure 69 and Table 15Table 13). This compares with 40% and 14.5% respectively for the as-is analysis.
The areas with highest percentage Scottish content are development and project management with 87.7%. This area is followed by installation and commissioning which has an average Scottish content of 60.7%, due to its utilisation of Scottish based technicians and operational staff.
| Level 1 category | % of total | Territory | % of category | % of total | Territory | % of category | % of total |
|---|---|---|---|---|---|---|---|
| Development and project management | 5.7% | Scotland | 87.7% | 5% | Local | 1.9% | 0.1% |
| Non-Scotland | 12.3% | 0.7% | Rest of Scotland | 85.8% | 4.9% | ||
| Turbine supply | 21.1% | Scotland | 16.8% | 3.5% | Local | 0% | 0% |
| Non-Scotland | 83.2% | 17.6% | Rest of Scotland | 16.8% | 3.5% | ||
| Balance of plant | 11.2% | Scotland | 55.9% | 6.3% | Local | 2.1% | 0.2% |
| Non-Scotland | 44.1% | 4.9% | Rest of Scotland | 53.9% | 6% | ||
| Installation and commissioning | 20.8% | Scotland | 60.7% | 12.6% | Local | 33.8% | 7% |
| Non-Scotland | 39.3% | 8.2% | Rest of Scotland | 26.9% | 5.6% | ||
| Operation, maintenance and service | 27.7% | Scotland | 57.1% | 15.8% | Local | 23% | 6.4% |
| Non-Scotland | 42.9% | 11.9% | Rest of Scotland | 34.1% | 9.4% | ||
| Decommissioning | 13.5% | Scotland | 60% | 8.1% | Local | 10% | 1.4% |
| Non-Scotland | 40% | 5.4% | Rest of Scotland | 50% | 6.8% | ||
| Total | 100.0% | Scotland | 51.3% | 51.3% | Local | 15.1% | 15.1% |
| Non-Scotland | 48.7% | 48.7% | Rest of Scotland | 36.3% | 36.3% |
GVA, earnings and employment
Table 16 summarises the economic impacts that could have been created by MeyGen.
Gross value-added
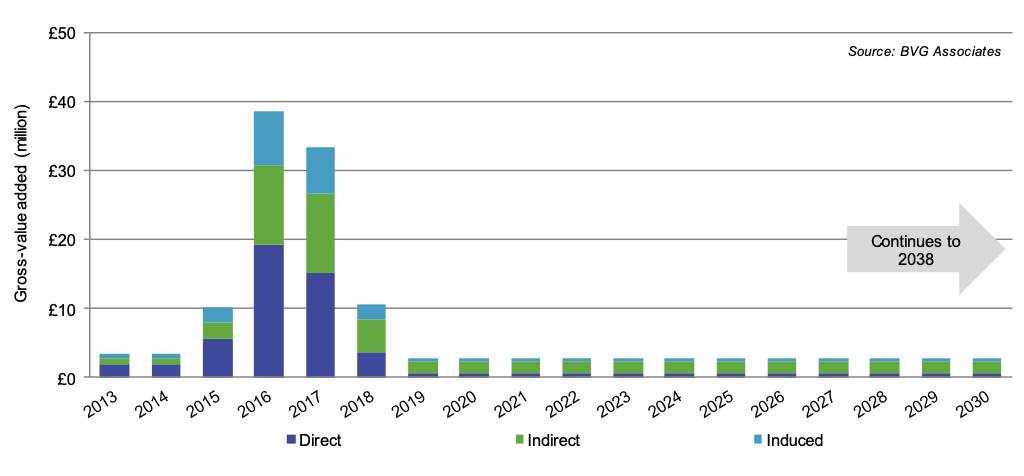
Meygen Phase 1A could have generated £54 million direct, indirect and induced GVA in Scotland over the lifetime of the project (£13 million more than as-is analysis) of which £13.5 million would be local. GVA would peak during the construction and installation phase in 2016, at around £14 million (£3 million more than as-is analysis) (see Figure 70).
Over the lifetime OMS could generate the greatest amount of GVA at £17 million (£4 million more than as-is analysis)., comprising 42% direct, 39% indirect and 19% induced GVA (see Figure 71). OMS could generate £6 million locally.
| Scotland | Local | |||||||
|---|---|---|---|---|---|---|---|---|
| Impact | Direct | Indirect | Induced | Total | Direct | Indirect | Induced | Total |
| Value-added (millions) | £22 | £21 | £11 | £54 | £6 | £7 | £0.5 | £13.5 |
| Earnings (millions) | £19 | £10 | £5 | £34 | £4 | £4 | £0.5 | £8.5 |
| FTE years | 505 | 295 | 170 | 970 | 140 | 110 | 10 | 260 |
Employment
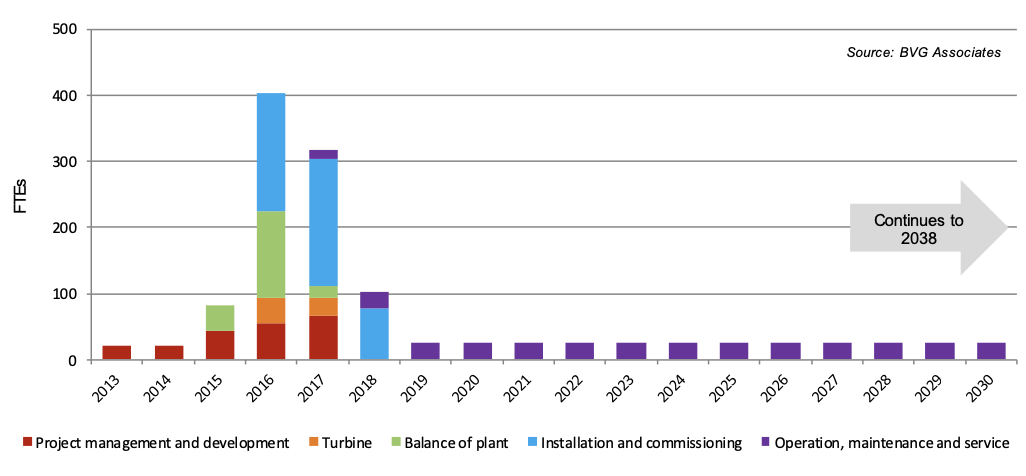
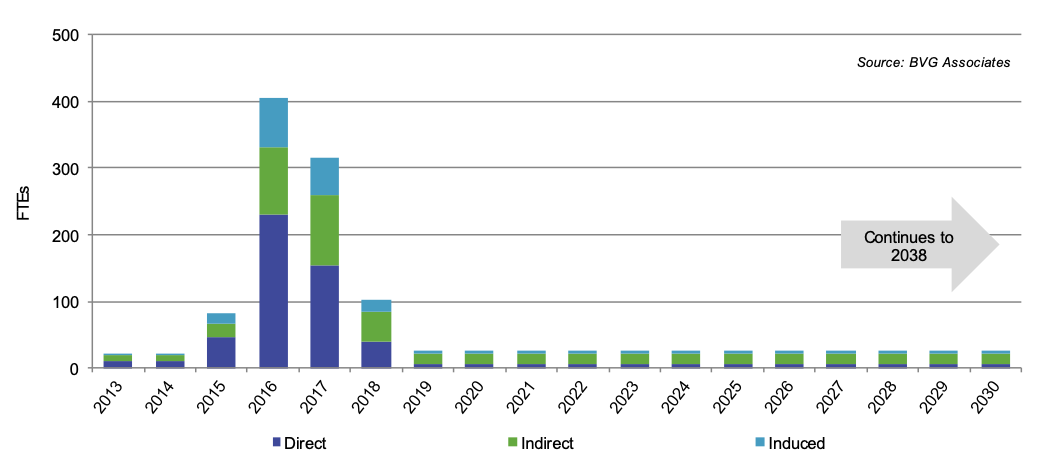
Over the lifetime of the project 970 FTEs, could have been created (450 more than the as-is analysis) in Scotland. Locally, 260 FTEs would be created (85 more than the as-is analysis). The number of FTEs created each year between 2013 and 2043, broken down by supply chain, is shown in Figure 72).
FTEs peak in the construction and installation phase in 2016, when 250 FTEs could be created (120 more than the as-is analysis). This comprises 50% direct, 32% indirect and 18% induced FTEs (see Figure 73).
OMS could create 320 FTEs over the lifetime of project (140 more than the as-is analysis), and this includes the permanent local work force, developer back office functions and periodic work on the project. 115 of those FTE years would be local.
Indirect FTE years, FTEs created below tier 1 contracting level, would make the largest contribution to the total.
Contact
Email: ScotMER@gov.scot