Bringing Hope, Building Futures: Tackling child poverty delivery plan 2026-2031 – annex 5: Cumulative Impact Assessment
This report is an annex to Bringing Hope, Building Futures: the third tackling child poverty delivery plan 2026 to 2031 and assesses the cumulative impact of a package of our policies on child poverty.
3. Cumulative impact assessment
This section sets out the estimated impacts of Scottish Government policies on two of our target measures, namely relative and absolute child poverty. We also present analysis on how these policies are affecting children at different points in the income distribution.
All modelling is subject to a degree of uncertainty, relying on a number of assumptions and simplifications, and this modelling is no different. The results presented in this report, particularly projections of outturn poverty rates, should therefore be treated with caution. The estimated projections this year carry an additional degree of uncertainty given planned revisions to the underlying survey data by the Department for Work and Pensions as detailed later in this publication, in addition, to the upcoming Scottish Parliament elections. Poverty projections are not a forecast, they are an estimate of future trends in low-income poverty levels under a specific set of assumptions.
The first edition of the CIA, published in 2022, sets out the full details of our methodology. As in previous modelling, we run two scenarios in each year: a baseline scenario, which represents projections of child poverty taking into account current and planned policies, and a counterfactual scenario, which represents a hypothetical scenario in which a select package of Scottish Government policies did not exist. The difference between the two scenarios represents the cumulative impact of this package.
Since the 2025 CIA the policy package has been updated to include the removal of the two-child limit on Universal Credit, and its previously planned mitigation by the Scottish Government, and the introduction of a Scottish Child Payment Premium for children under the age of one. In addition, notable changes in existing policies were made such as increases to the standard allowance of Universal Credit by the UK Government, and the Scottish Government’s expansion of Free School meal eligibility.
Otherwise, the same policies are included in the policy package as in both the first edition (2022) and 2025 CIA, along with any changes to these policies that have been announced or implemented in the interim period. Section 7 includes further details on our methodology, including the policies included in the package and the changes we have introduced.
3.1 Target measures
Figure 1 and Table 1 summarise the results of our analysis in terms of relative child poverty, with the results for absolute child poverty shown in Figure 2 and Table 2. Relative poverty is defined as having equivalised household income below 60% of the UK median, while absolute poverty uses 60% of the UK median in 2010-11,[7] adjusted for inflation.
In 2026-27, we estimate that the policy package will keep 100,000 children out of relative poverty, with the rate ten percentage points lower than it would be without these policies in place. In terms of absolute child poverty, the impact is estimated to be seven percentage points, representing 70,000 children who would otherwise be in poverty on this measure.
By 2030-31, the impact of the policy package is estimated to be 11 percentage points on the relative child poverty rate and eight percentage points on the absolute child poverty rate, representing 110,000 and 80,000 children respectively. This increase in impact over the projected period reflects the ongoing and cumulative estimated impact of support for people to enter and sustain employment.
While relative and absolute child poverty are projected to fall by 2030-31, based on policies outlined on the face of the delivery plan and the latest statistics, this drop is not sufficient to reach the final child poverty targets in 2030-31. This projection is based on the best available data, but there are known uncertainties which could affect this projection:
- The data linkage project noted for the FRS survey data could change child poverty rates, with a consequential impact on projected child poverty rates also.
- The current data uncertainty and its impact on calibration, which are further explored in Section 4.
- Wider economic factors that can affect future trends, such as changes in employment and earnings growth arising from external economic conditions, and how is the impacts of these are distributed across the economy.
- Further, there are policies focused on tackling child poverty which cannot be robustly modelled as part of the cumulative impact assessment. An indication of the potential unrepresented impacts are outlined in Section 5.
As such, future data releases which include improvements to the data quality and embed the impacts of policies not included in the model could see current child poverty projections change without any new policy intervention.
As noted previously, the policy choices of an incoming Scottish Government could alter the cumulative impact of policies and progress toward the 2030 targets – reducing or increasing child poverty rates by several percentage points. Alongside this, the choices made by the UK Government in relation to social security could also have a material impact on poverty rates – further affecting the gap to the 2030 targets.
There is additional scope for changes in employment, wages, or benefit take-up rates to impact child poverty rates. For example, were both UK and SG benefits to see maximum take-up of eligible social security benefits (where modellable),[8] modelling suggests this would reduce projected child poverty by 3 percentage points – equivalent to keeping a further 30,000 children out of poverty. However, improvements in employment and take-up of eligible benefits can be complex due to the interactions between various systems and known barriers. The Tackling Child Poverty Delivery Plan for 2026-31 provides a framework for action to help address these challenges, providing a strong foundation for continued action.
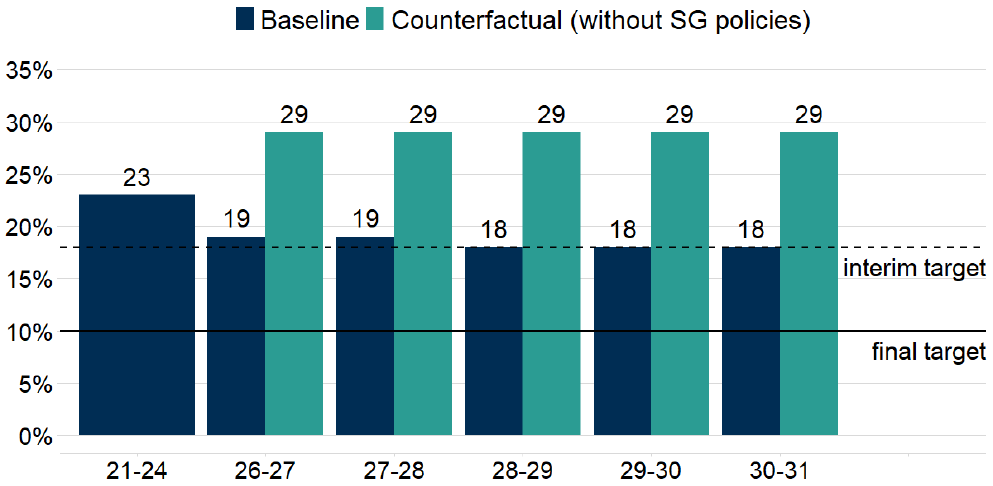
Notes: Counterfactual scenario represents a hypothetical scenario in which a package of Scottish Government policies does not exist. See Section 7 for further details. 21-24 represents the baseline years used to calculate the projection. Source: Scottish Government (SG) analysis using UKMOD
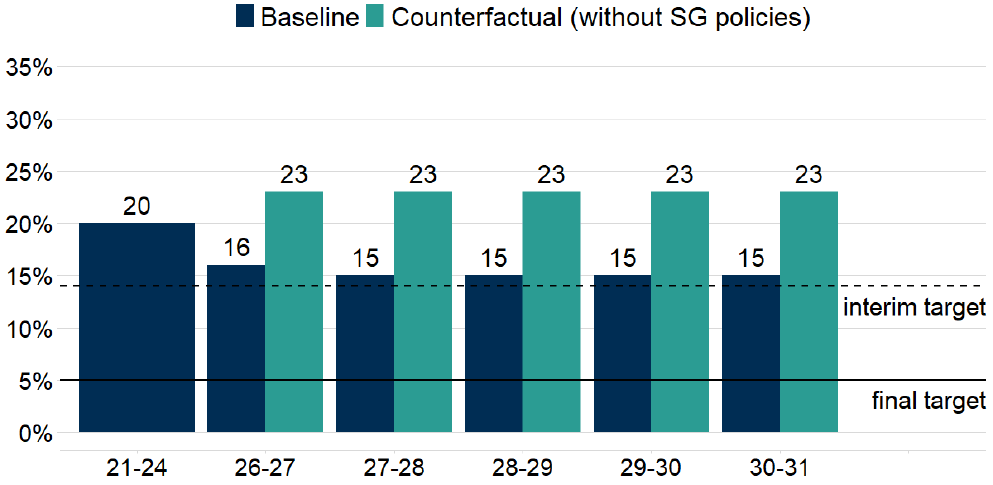
Notes: Counterfactual scenario represents a hypothetical scenario in which a package of Scottish Government policies does not exist. See Section 7 for further details. 21-24 represents the baseline years used to calculate the projection. Source: SG analysis using UKMOD
Table 1 and 2 show that our projections of child poverty, as represented by the baseline scenario, have improved since our last update. This is largely due to the incorporation of the 2023-24 FRS data which reduced both the baseline and counterfactual projections of child poverty, with 2023-24 seeing similar or lower poverty rates than the preceding two years that made up the last baseline.
The impact of the Scottish policy package on relative and absolute child poverty, compared with the counterfactual, has also changed since the last update. This is in part due to the removal of the two-child-limit at source by the UK Government from April 2026. As the previous CIA included the Scottish Government’s planned mitigation in the baseline only, this reduces the impact of the Scottish policy package relative to the counterfactual. However, the additional year of data has also changed the number of families close to the relative poverty line which increases the impact of the Scottish policy package. The end result is an increase in the impact of the Scottish policy package on relative child poverty and a decrease in the impact on absolute child poverty, relative to the previous update.
| Year | Baseline – March 2025 | Counter-factual – March 2025 | Impact of policy package – March 2025 | Baseline – March 2026 | Counter-factual – March 2026 | Impact of policy package – March 2026 |
|---|---|---|---|---|---|---|
| 2021-24 | n/a | n/a | n/a | 23% | n/a | n/a |
| 2022-23 | 26% | n/a | n/a | n/a | n/a | n/a |
| 2025-26 | 24% | 31% | 7 ppts | n/a | n/a | n/a |
| 2026-27 | 23% | 31% | 8 ppts | 19% | 29% | 10 ppts |
| 2027-28 | 23% | 32% | 9 ppts | 19% | 29% | 10 ppts |
| 2028-29 | 22% | 32% | 10 ppts | 18% | 29% | 11 ppts |
| 2029-30 | 22% | 32% | 10 ppts | 18% | 29% | 11 ppts |
| 2030-31 | n/a | n/a | n/a | 18% | 29% | 11 ppts |
Notes: n/a indicates that year was not modelled. Figures may not sum due to rounding. Counterfactual scenario represents a hypothetical scenario in which a package of Scottish Government policies does not exist. Impact of policy package represents difference between baseline and counterfactual scenarios and is therefore affected by exogenous changes that affect these scenarios differentially. See Section 7 for further details. Source: SG analysis using UKMOD
| Year | Baseline – March 2025 | Counter-factual – March 2025 | Impact of policy package – March 2025 | Baseline – March 2026 | Counter-factual – March 2026 | Impact of policy package – March 2026 |
|---|---|---|---|---|---|---|
| 2021-24 | n/a | n/a | n/a | 20% | n/a | n/a |
| 2022-23 | 23% | n/a | n/a | n/a | n/a | n/a |
| 2025-26 | 21% | 27% | 6 ppts | n/a | n/a | n/a |
| 2026-27 | 18% | 29% | 11 ppts | 16% | 23% | 7 ppts |
| 2027-28 | 18% | 29% | 11 ppts | 15% | 23% | 8 ppts |
| 2028-29 | 18% | 29% | 11 ppts | 15% | 23% | 8 ppts |
| 2029-30 | 18% | 29% | 11 ppts | 15% | 23% | 8 ppts |
| 2030-31 | n/a | n/a | n/a | 15% | 23% | 8 ppts |
Notes: n/a indicates that year was not modelled. Figures may not sum due to rounding. Counterfactual scenario represents a hypothetical scenario in which a package of Scottish Government policies does not exist. Impact of policy package represents difference between baseline and counterfactual scenarios and is therefore affected by exogenous changes that affect these scenarios differentially. See Section 7 for further details. Source: SG analysis using UKMOD
3.2 Distributional impacts
To gain a more complete understanding of the impacts of the policy package, Table 3 compares the impacts on relative poverty with those on deep poverty and low income. Whereas the relative poverty line is set at 60% of UK median household income, deep poverty is set at 50% of the median, and low income at 70%. Deep poverty is therefore a more severe definition of poverty, while low income captures households that are above the relative poverty line but still at risk of poverty.
The impact of the policy package on deep poverty is estimated to be eight percentage points in 2026-27, representing some 70,000 children who would otherwise be in deep poverty, dropping to 6 percentage points or 60,000 children over the projected horizon. This is lower than our last update due to there being fewer children recorded in deep poverty in the latest FRS data for 2023-24. The impact of the policy package is estimated to reduce the share of children in deep poverty by the same amount as the last update, as shown in Table 4.
| Year |
Deep poverty (50% median) |
Relative poverty (60% median) |
Low income (70% median) |
|---|---|---|---|
| 2026-27 | 7 | 10 | 9 |
| 2027-28 | 7 | 10 | 10 |
| 2028-29 | 6 | 11 | 9 |
| 2029-30 | 6 | 11 | 9 |
| 2030-31 | 6 | 11 | 10 |
Notes: Deep poverty defined as having household income below 50% of UK median; relative poverty defined as having household income below 60% of UK median; low income defined as having household income below 70% of UK median. Household income defined as net equivalised household income after housing costs. Source: SG analysis using UKMOD
There are fewer children living in deep poverty than in relative poverty, and fewer living in relative poverty than in low income. In this sense, an impact of one percentage point is proportionately larger for deep poverty than it is for relative poverty – and proportionately larger for relative poverty than for low income – because it represents a higher percentage of children who would meet that definition of poverty if the policy package was not in place.
An alternative way to compare impacts across the three measures is to calculate this percentage for each measure – that is, the percentage of children in poverty in the counterfactual scenario who are not in poverty in the baseline scenario.[9] This is shown in Table 4. The table demonstrates that, when expressed as a proportion of the counterfactual poverty rate, the impacts of the policy package are even more targeted at children on the lowest incomes. In 2026-27, an estimated 50% of children who would have been in deep poverty if the policy package was not in place will not be in deep poverty, compared to 41% and 26% for relative poverty and low income respectively.
These tables show that the policy package disproportionately benefits children further down the income distribution, with equal or greater impacts on deep poverty than on relative poverty. This demonstrates that the policy package is not just pushing households over the relative poverty line, but is also reducing the depth of poverty for tens of thousands of children. The lower impacts on the low-income measure reflect the fact that the policy package is mainly comprised of means-tested benefits, but still show that Scottish Government policies are significantly reducing the risk of child poverty for many households.
| Year |
Deep poverty (50% median) |
Relative poverty (60% median) |
Low income (70% median) |
|---|---|---|---|
| 2026-27 | 50 | 41 | 26 |
| 2027-28 | 52 | 42 | 28 |
| 2028-29 | 50 | 46 | 28 |
| 2029-30 | 49 | 45 | 29 |
| 2030-31 | 49 | 46 | 28 |
Notes: Deep poverty defined as having household income below 50% of UK median; relative poverty defined as having household income below 60% of UK median; low income defined as having household income below 70% of UK median. Household income defined as net equivalised household income after housing costs. Source: SG analysis using UKMOD
3.3 Individual policies
In addition to modelling the full policy package, we can use the same methodology to estimate the impacts of individual policies within the package. For each policy, a separate counterfactual is constructed in which that policy is removed while the rest of the policy package remains in place.
In 2026-27, the impact of the Scottish Child Payment (SCP) on the relative child poverty rate is estimated to be five percentage points – representing 50,000 children – relative to a counterfactual scenario in which this policy did not exist. This has increased slightly compared with the previous estimate of four percentage points due to changes in the base data affecting how households are clustered around the poverty line, and the number of children eligible for the payment has increased somewhat following the removal of the two-child limit. Since 2023-24 estimates of take-up for SCP have increased, while uprating has preserved its value despite the high inflation seen through 2023-24.
Contact
Email: TCPU@gov.scot