Publication - Research and analysis
Scottish Energy Performance Certificates - new metrics: research
Research report summarising work to develop new EPC metrics for Scottish EPCs. This report accompanies the Energy Performance Certificate reform consultation.
Appendix A – Graphs and tables for alternative UE/m² metric
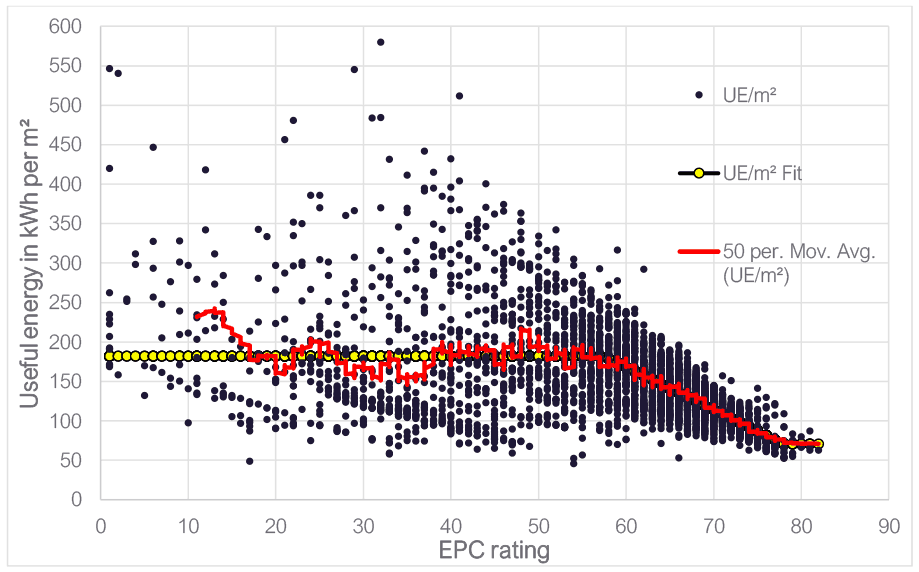
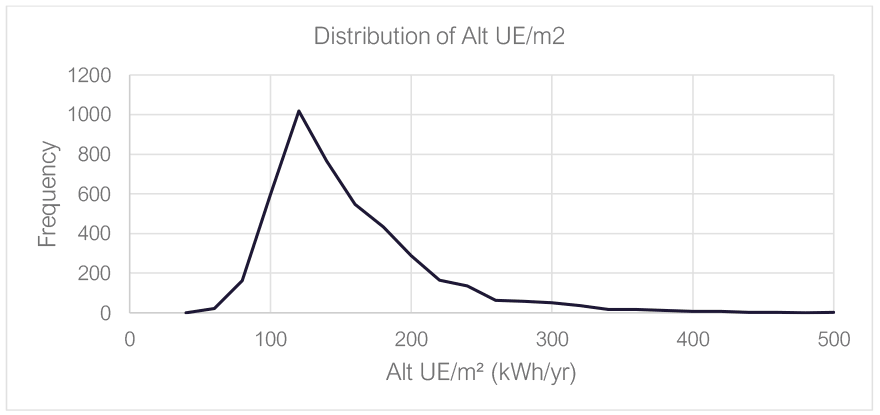
The following graphs and tables are equivalent to the ones shown in the body of this document, but use the alternative definition of UE/m² (with hot water energy excluded) – denoted ‘Alt UE/m²’.
| Equivalent to current SAP rating | ||
|---|---|---|
| Reference point | SAP rating | Alt UE/m² (fit) |
| Threshold of band C | 69 | 120 |
| Mid-point of band C | 74.5 | 90 |
| Top of band C | 80 | 71 |
| Threshold of band B | 81 | 71 |
| Mid-point of band B | 86 | 71 |
| Top of band B | 91 | 71 |
| Current average | 59 | 174 |
| Current median | 64 | 147 |
| Alt UE/m² at percentile | |
|---|---|
| 0.5% | 60 |
| 2.5% | 75 |
| 5.0% | 82 |
| 25.0% | 106 |
| 50.0% | 129 |
| 75.0% | 167 |
| 95.0% | 259 |
| 97.5% | 301 |
| 99.5% | 396 |
| Key stats – Alt UE/m² | |||
|---|---|---|---|
| Average | 145 | ||
| Median | 129 | ||
| 50% are between | 106 | and | 167 |
| 90% are between | 82 | and | 259 |
| 95% are between | 75 | and | 301 |
| 99% are between | 60 | and | 396 |
| Figures for entire stock | |||||
|---|---|---|---|---|---|
| Cumulatively added improvement measures | % homes able to receive this measure | % in band C or better | % reaching Alt UE/m² target | ||
| Total | Change | Total | Change | ||
| No improvements | - | 32.3% | - | 40.8% | - |
| Loft insulation | 18.9% | 35.5% | 3.2% | 45.1% | 4.3% |
| Flat roof insulation | 1.1% | 36.0% | 0.5% | 45.5% | 0.5% |
| Cavity wall insulation | 13.6% | 39.1% | 3.1% | 49.0% | 3.4% |
| Solid wall insulation | 19.0% | 48.0% | 8.9% | 60.9% | 11.9% |
| Floor insulation (suspended) | 68.3% | 61.2% | 13.2% | 78.5% | 17.6% |
| Floor insulation (solid) | 9.0% | 62.7% | 1.5% | 81.1% | 2.6% |
| Hot water cylinder insulation | 9.8% | 63.1% | 1.9% | 81.1% | 2.6% |
| Cylinder thermostat | 52.4% | 63.7% | 0.6% | 81.7% | 0.6% |
| Solar water heating | 78.5% | 66.2% | 2.5% | 82.0% | 0.4% |
| Double Glazing | 2.4% | 66.3% | 0.1% | 82.5% | 0.4% |
| Figures for entire stock | |||||||||
|---|---|---|---|---|---|---|---|---|---|
| Cumulatively added measures | % homes able to receive measure | Mean SAP | Median SAP | Mean Alt UE/m² | Median Alt UE/m² | ||||
| Total | Change | Total | Change | Total | Change | Total | Change | ||
| No improvements | - | 59.4 | - | 64 | - | 144.7 | - | 129.3 | - |
| Loft insulation | 18.9% | 60.6 | 1.2 | 65 | 1 | 136.9 | -7.8 | 124.7 | -4.6 |
| Flat roof insulation | 1.1% | 60.7 | 0.1 | 65 | 0 | 136.1 | -0.8 | 124.3 | -0.4 |
| Cavity wall insulation | 13.6% | 61.4 | 0.7 | 66 | 1 | 131.7 | -4.4 | 120.8 | -3.5 |
| Solid wall insulation | 19.0% | 63.4 | 1.9 | 68 | 2 | 119.6 | -12.1 | 112.8 | -8.0 |
| Floor insulation (suspended) | 68.3% | 66.2 | 2.9 | 70 | 2 | 102.4 | -17.2 | 96.4 | -16.4 |
| Floor insulation (solid) | 9.0% | 66.6 | 0.4 | 71 | 1 | 99.8 | -2.5 | 93.0 | -3.3 |
| Hot water cylinder insulation | 9.8% | 66.8 | 0.6 | 71 | 1 | 99.9 | -2.4 | 93.1 | -3.2 |
| Cylinder thermostat | 52.4% | 66.9 | 0.1 | 71 | 0 | 99.5 | -0.4 | 92.7 | -0.5 |
| Solar water heating | 78.5% | 67.9 | 1.0 | 72 | 1 | 99.3 | -0.3 | 92.4 | -0.3 |
| Double Glazing | 2.4% | 68.0 | 0.1 | 72 | 0 | 98.8 | -0.5 | 92.0 | -0.4 |
Contact
Email: EPCenquiries@gov.scot