Scottish Energy Performance Certificates - new metrics: research
Research report summarising work to develop new EPC metrics for Scottish EPCs. This report accompanies the Energy Performance Certificate reform consultation.
Impact of improvement measures on EPC metrics
This section describes the results of modelling work looking at the likely impact energy efficiency improvement measures could make to the existing and proposed metrics.
Analysis undertaken
Efficiency metrics were initially calculated using SAP 10.2 for SHCS homes in their as-surveyed (i.e. unimproved) state. The first improvement measure listed in the RdSAP 2012[15] improvement measure table (measure A – loft insulation) was added to all homes to which was applicable (according to RdSAP’s logic) and the metrics recalculated. The second improvement measure in the RdSAP table was then added (without removing the first) and the results recalculated. The third measure was then added without removing the first and second), and so on until all applicable measures had been added, cumulatively.
By comparing the modelled results where the first measure was added to the those for the unimproved dwelling the benefit of the first improvement measure was calculated. This was repeated for the full sequence of measures applied. The improvement in each metric and the increase in the number of homes achieving a rating of C or higher could then be calculated after each additional improvement measure.
Results
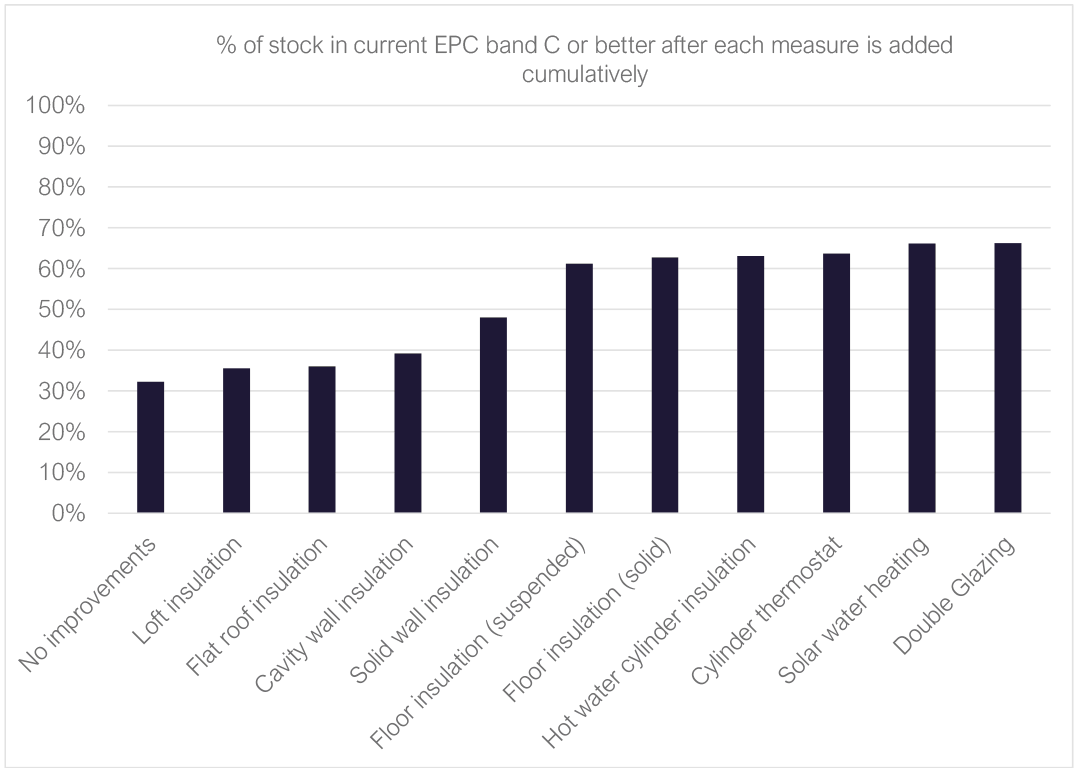
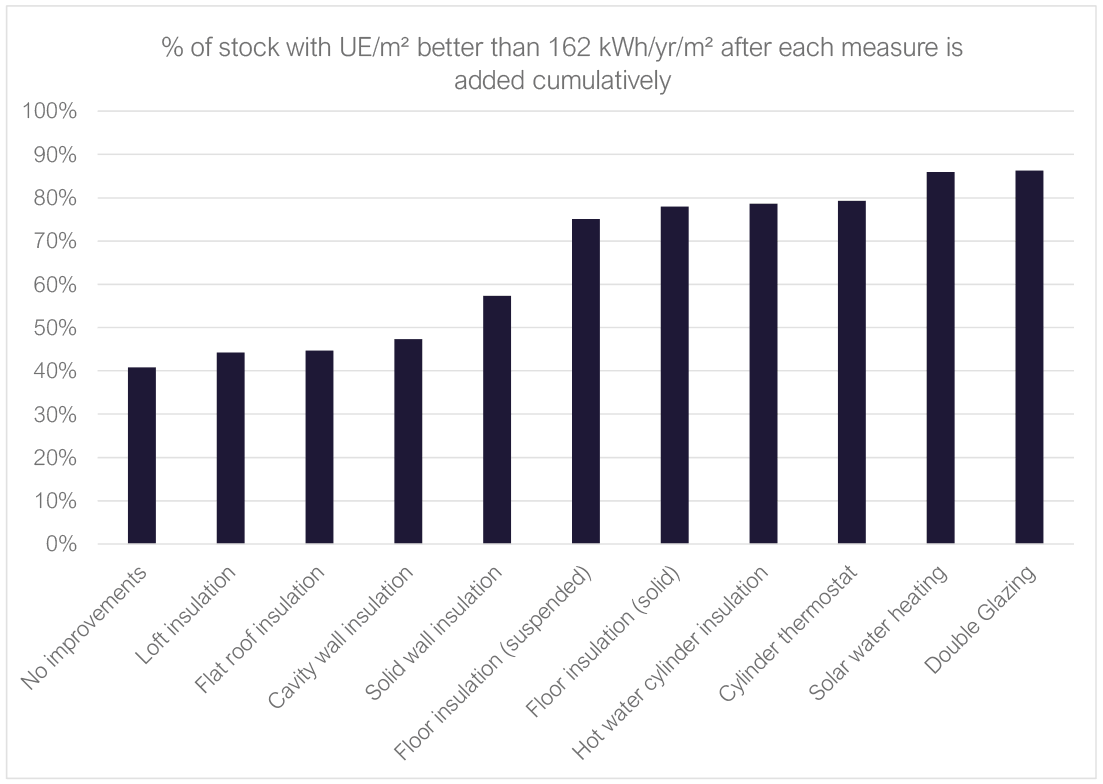
The following table and graph show the potential impact of each improvement measure type on the existing EPC metric and the equivalent UE metric level (162 kWh/yr/m²) for the Scottish housing stock. It can be seen that the improvement potential at the stock level is determined by the saving per home, but also by the number of homes to which the measure can be applied. This explains is why the biggest potential saving is for floor insulation, since a large number of homes can potentially receive this.
| Figures for entire stock | |||||
|---|---|---|---|---|---|
| Cumulatively added improvement measures | % homes able to receive this measure | % in band C or better | % reaching UE/m² target | ||
| Total | Change | Total | Change | ||
| No improvements | - | 32.3% | - | 40.8% | - |
| Loft insulation | 18.9% | 35.5% | 3.2% | 44.3% | 3.5% |
| Flat roof insulation | 1.1% | 36.0% | 0.5% | 44.7% | 0.5% |
| Cavity wall insulation | 13.6% | 39.1% | 3.1% | 47.4% | 2.6% |
| Solid wall insulation | 19.0% | 48.0% | 8.9% | 57.3% | 9.9% |
| Floor insulation (suspended) | 68.3% | 61.2% | 13.2% | 75.1% | 17.8% |
| Floor insulation (solid) | 9.0% | 62.7% | 1.5% | 77.9% | 2.8% |
| Hot water cylinder insulation | 9.8% | 63.1% | 1.9% | 78.7% | 3.5% |
| Cylinder thermostat | 52.4% | 63.7% | 0.6% | 79.3% | 0.7% |
| Solar water heating | 78.5% | 66.2% | 2.5% | 85.9% | 6.6% |
| Double Glazing | 2.4% | 66.3% | 0.1% | 86.2% | 0.3% |
| Figures for entire stock | |||||||||
|---|---|---|---|---|---|---|---|---|---|
| Cumulatively added improvement measures | % homes able to receive this measure | Mean SAP | Median SAP | Mean UE/m² | Median UE/m² | ||||
| Total | Change | Total | Change | Total | Change | Total | Change | ||
| No improvements | - | 59.4 | - | 64 | - | 187.6 | - | 172.8 | - |
| Loft insulation | 18.9% | 60.6 | 1.2 | 65 | 1 | 179.8 | -7.8 | 168.1 | -4.7 |
| Flat roof insulation | 1.1% | 60.7 | 0.1 | 65 | 0 | 179.0 | -0.8 | 167.3 | -0.8 |
| Cavity wall insulation | 13.6% | 61.4 | 0.7 | 66 | 1 | 174.6 | -4.4 | 164.0 | -3.3 |
| Solid wall insulation | 19.0% | 63.4 | 1.9 | 68 | 2 | 162.5 | -12.1 | 155.5 | -8.4 |
| Floor insulation (suspended) | 68.3% | 66.2 | 2.9 | 70 | 2 | 145.2 | -17.2 | 138.4 | -17.1 |
| Floor insulation (solid) | 9.0% | 66.6 | 0.4 | 71 | 1 | 142.7 | -2.5 | 135.9 | -2.5 |
| Hot water cylinder insulation | 9.8% | 66.8 | 0.6 | 71 | 1 | 142.1 | -3.1 | 135.6 | -2.8 |
| Cylinder thermostat | 52.4% | 66.9 | 0.1 | 71 | 0 | 141.5 | -0.7 | 134.9 | -0.7 |
| Solar water heating | 78.5% | 67.9 | 1.0 | 72 | 1 | 133.0 | -8.5 | 126.4 | -8.5 |
| Double Glazing | 2.4% | 68.0 | 0.1 | 72 | 0 | 132.5 | -0.5 | 125.8 | -0.6 |
Recognising that some measures are considerably more expensive and disruptive to install than others, special consideration was given to the impact of the group of measures considered to be relatively cheap and easy to install (loft insulation, cavity wall insulation, suspended floor insulation).
If just loft insulation and cavity wall insulation were applied to all applicable homes the proportion of homes reaching the threshold UE level of 162 kWh/yr/m² would be raised from 40.8% to 46.9%. Adding suspended floor insulation this would rise to 64.7%.
Mapping to an A to G scale
Apart from recommending an equivalent band C threshold value for the proposed new metric and showing the current distribution for this metric in the Scottish housing stock as background, the rating boundaries for the other rating bands are very much a policy decision for SG to consider – there is no technically ‘right’ way to do this. For this reason a spreadsheet tool[16] was supplied to SG to help them consider this further, allowing the band boundaries to be adjusted and the resulting change in the distribution of homes in each band to be observed, with and without packages of improvement measures are added.
Conclusions
Currently, an EPC rating for a dwelling is based on its calculated running costs per m² of floor area. This takes into consideration how well insulated the dwelling is, but also the choice of heating system and the type of fuel it uses.
In this report, a number of possible alternative metrics focussed more on fabric efficiency have been considered. Of these, SG’s favoured metric was one based on useful energy required per m² of floor area. This includes the amount of heat energy needed to maintain a comfortable internal temperature and the amount of energy required to provide hot water for the dwelling’s occupants.
To ensure targets based on the new metric are set at an equivalent level of ambition to those set using the current metric, an analysis was undertaken to model the values obtained by each metric for a representative sample of Scottish homes using data from the Scottish House Condition Survey. By modelling both metrics for each dwelling and determining the relationship between these (on average), it was possible to map a value of the new metric that is equivalent to any level of the existing one. By this approach it was found that homes meeting the threshold level of the current of EPC band C have a useful energy requirement, on average, of 162 kWh/yr/m². The equivalent value using the alternative UE definition (excluding water heating energy) is 120 kWh/yr/m² - see Appendix A for details.
The distribution of existing EPC ratings was modelled using SAP 10.2. This showed that about 32% of homes achieve EPC band C or better, while less than 1% achieve EPC band B or better. Using the new metric, around 40% of homes would meet or surpass the band C equivalent target of 162 kWh/yr per m².
To consider the potential to improve the ratings of homes using the new metric, energy modelling was undertaken to add fabric energy efficiency measures. When a basic set of measures was added (loft insulation, cavity wall insulation) the number of homes reaching the band C equivalent figure of 162 kWh/yr per m² threshold increase from 40.8% to 46.9%. Adding suspended floor insulation) increased this to 64.7%. This shows that, while challenging, it is possible using currently available solutions to bring the majority of the Scottish housing stock past the proposed threshold level.
During the analysis it was noted that a significant proportion of the homes receiving highest EPC ratings at present appear to be using means other than further improving fabric insulation (e.g. by having PV panels). These would not improve the rating under the proposed new metric – suggesting the options for achieving high rating (As and Bs) might be limited, or at least expensive – e.g. deep retrofits. It may have to be accepted that bands A and B are going to be occupied mostly by new dwellings.
Contact
Email: EPCenquiries@gov.scot